MYHma
- Indicatori
- Versione: 1.0
- Attivazioni: 5

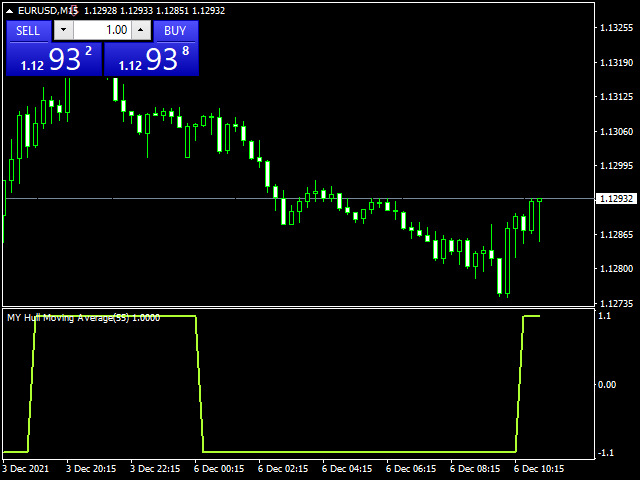
Alan Hull's moving average, more sensitive to the current price activity than the normal MA. Reacts to the trend changes faster, displays the price movement more clearly.
My HMA indicator is the developed state of the standard HMA indicator. The indicator is Non Repaint Version. The indicator shown in a separate window is worth the value of -1 to 1. Default entries will give better results in the M15 chart for the parities. With different entry values, you can also get better results in different time periods.