Indicator summary
- Indicatori
- Versione: 1.0
- Attivazioni: 5

Indicator Summary
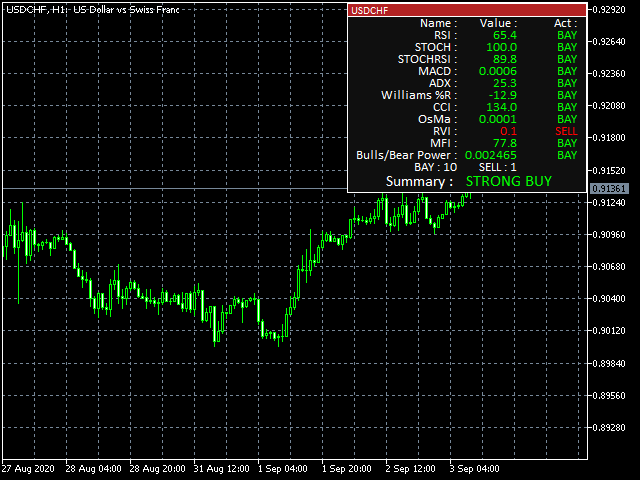
The indicator dashboard displays values and trading actions, as well as provides a summary of trading actions based on 11 built-in indicators.
Built-in Indicators:
-
RSI (Relative Strength Index) - A crossover from the overbought zone downwards is a sell signal. A crossover from the oversold zone upwards is a buy signal. When fluctuating in the zone between overbought and oversold, the signal is formed depending on the value's position relative to 50. Above 50 indicates a buy, below 50 indicates a sell.
-
Stochastic - If the main line value is greater than the signal line, it’s a buy signal. If the main line value is less than the signal line, it’s a sell signal.
-
Stochastic RSI - If the main line value is greater than the signal line, it’s a buy signal. If the main line value is less than the signal line, it’s a sell signal.
-
MACD - If the main line value is greater than the signal line, it’s a buy signal. If the main line value is less than the signal line, it’s a sell signal.
-
ADX (Average Directional Movement Index) - If the D+ line value is greater than D-, it’s a buy signal. If the D+ line value is less than D-, it’s a sell signal.
-
Williams %R - A crossover from the overbought zone downwards is a sell signal. A crossover from the oversold zone upwards is a buy signal. When fluctuating in the zone between overbought and oversold, the signal is formed depending on the value's position relative to -50. Above -50 indicates a sell, below -50 indicates a buy.
-
CCI (Commodity Channel Index) - A crossover from the overbought zone downwards is a sell signal. A crossover from the oversold zone upwards is a buy signal. When fluctuating in the zone between overbought and oversold, the signal is formed depending on the value's position relative to 0. Above 0 indicates a buy, below 0 indicates a sell.
-
Osma (Moving Average of Oscillator) - If the main line value is greater than 0, it’s a buy signal. If the main line value is less than 0, it’s a sell signal.
-
RVI (Relative Vigor Index) - If the main line value is greater than the signal line, it’s a buy signal. If the main line value is less than the signal line, it’s a sell signal.
-
MFI (Money Flow Index) - A crossover from the overbought zone downwards is a sell signal. A crossover from the oversold zone upwards is a buy signal. When fluctuating in the zone between overbought and oversold, the signal is formed depending on the value's position relative to 50. Above 50 indicates a buy, below 50 indicates a sell.
-
Bulls/Bear Power - The sum of the values of the Bulls Power and Bear Power indicators. If the Bulls Power value is greater than the Bear Power, it’s a buy signal. If the Bulls Power value is less than the Bear Power, it’s a sell signal.
After the values, the number of indicators with buy and sell signals is displayed.
Trading signals are formed based on the formed candles. The readings displayed are current.
The final signal is formed based on the following rules:
- 11 or 10 indicators signaling buy or sell - Strong buy or sell, respectively.
- 8 or 9 indicators signaling buy or sell - Buy or sell, respectively.
- From 7 to 5 indicators signaling buy or sell - Neutral signal, refrain from trading actions.
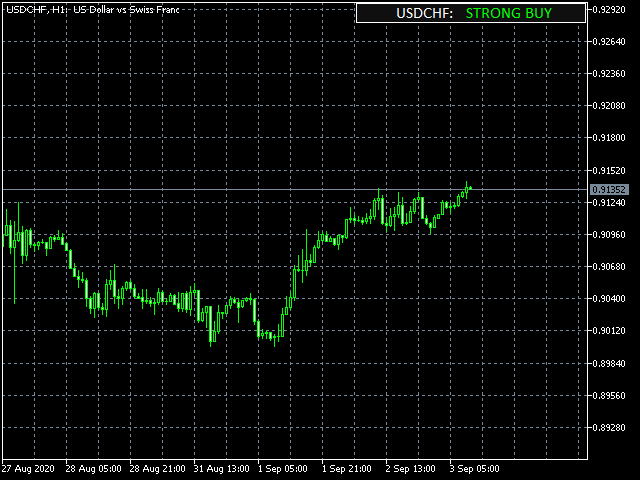
For user convenience, the information panel can be minimized to a minimal size by clicking on it with the left mouse button. To expand the information panel to its normal state, use the same method. Minimize and maximize actions will only occur on the next tick (upon the next price arrival from the trading server). In a non-working market, minimizing the information panel will cause it to disappear. To resume operation, restart the indicator.
L'utente non ha lasciato alcun commento sulla valutazione.