PositionsSizeCal

In the financial world, risk management is the process of identification, analysis and acceptance of uncertainty in investment decisions. Essentially, risk management occurs when an investor or fund manager analyzes and attempts to quantify the potential for losses in an investment, such as a moral hazard, and then takes the appropriate action given his investment objectives and risk tolerance.

This tool should be the success key before you lost your capitals due to the unawareness of market behavior and your burden trade as successful traders keeps themselves away from. The given risk management tools design according to methods as discuss on one of the great web, that teach forex point by point "babypips.com"

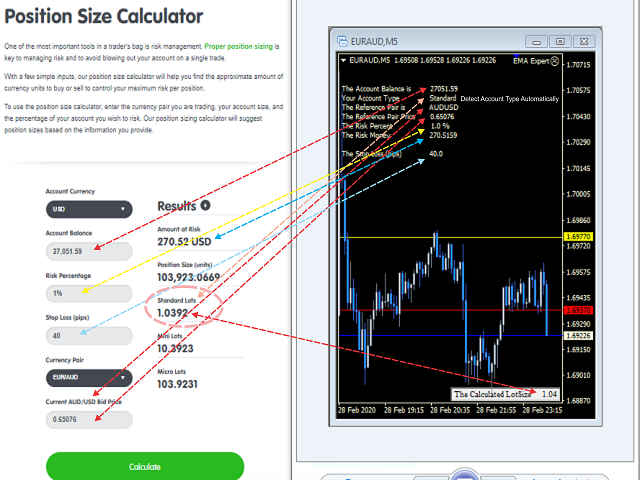
The indicator display exactly the same value as the calculator give on the website…

The tool do not show any data, if the terminal is not connected to the internet.

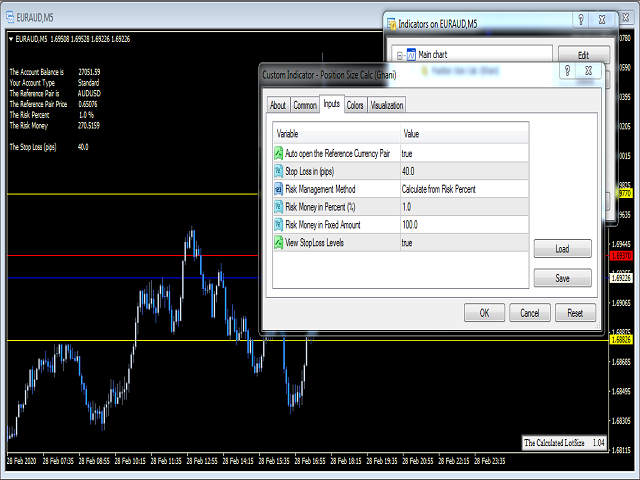
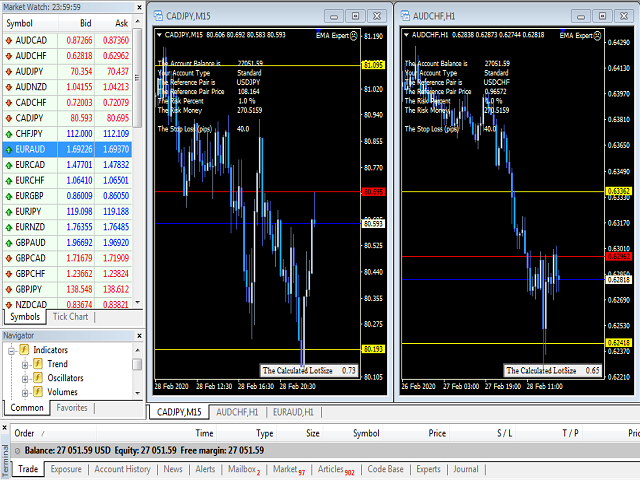
The indicator automatically detect the account type whether (Standard, Mini or Micro) and show the Calculated LotSize to be trade upon that's accordingly maintaining the precision to the best risk management.

Code will freely be attach to the EA for the buyer. 

Prodotti consigliati
Fibonacci calculator is used with Elliot Waves, it can generate remarkable results. A trader could use these levels or ratios to find high probability trades with very small stop loss. You may also use these ratios to find Elliott Waves extensions and to book profit near those levels. For Elliot Wave experts, Fibonacci calculator is a highly useful tool that can assist them in calculating Fibonacci extension and retracement levels for the market price. The indicator proves itself as a useful one
O Touch VWAP é um indicador que permite calcular uma Média Ponderada por Volume (VWAP) apenas apertando a tecla 'w' no seu teclado e após clicando no candle do qual deseja realizar o calculo, clicando abaixo do candle é calculada a VWAP baseado na minima dos preços com o volume, clicando sobre o corpo do candle é calculado uma VWAP sobre o preço medio com o volume e clicando acima do candle é calculado uma VWAP baseado na máxima dos preços com o volume, voce tambem tem a opção de remover a VWAP
-- Semplice ma efficace. Indicatore di inversione - Che cos'è? Un indicatore di sovrapposizione che segue il trend e combina la logica SuperTrend con la tecnologia della curva esponenziale. Rileva la direzione del trend, traccia un canale dinamico sul grafico e invia avvisi in tempo reale quando il trend si inverte. Come funziona? L'indicatore calcola una linea di base esponenziale utilizzando l'ATR e un fattore SuperTrend. Quando il prezzo chiude al di sopra o al di sotto di questa linea di
FREE
Candle Probability Scalper
Martin Alejandro Bamonte
Guida all'uso del Candle Probability Scalper Questo indicatore rende lo scalping facile e al 100% intuitivo. Candle Probability Scalper ti mostrerà a colpo d'occhio le percentuali di forza degli acquirenti e dei venditori in TEMPO REALE sulla candela attuale. Le percentuali vengono aggiornate a ogni tick, consentendoti di sapere, secondo per secondo, cosa stanno facendo la maggior parte degli acquirenti e dei venditori, senza alcun ritardo. Ciò ti aiuterà immensamente a determinare o confermare
NO REPAINT ADVANCED CHART PATTERN INDICATOR By definition, a price ( chart)  pattern is a recognizable configuration of price movement that is identified using a series of  trendlines  and/or curves. When a price pattern signals a change in trend direction, it is known as a reversal pattern; a continuation pattern occurs when the trend continues in its existing direction following a brief pause. Advanced Chart Pattern Tracker is designed to find the MOST ACCURATE patterns. A special script is a
QuantumAlert Stoch Navigator is a free indicator available for MT4/MT5 platforms, its work is to provide "alerts" when the market is inside "overbought and oversold" regions in the form of "buy or sell" signals. This indicator comes with many customization options mentioned in the parameter section below, user can customise these parameters as needful. Join our   MQL5 group , where we share important news and updates. You are also welcome to join our private channel as well, contact me for the p
FREE
Apex Break PRO MT4
Kestutis Balciunas
Apex Break PRO è un indicatore di rottura di linee di tendenza su pivot non ridisegnante per MetaTrader 4. Rileva massimi di pivot e minimi di pivot, traccia linee di tendenza dinamiche inclinate tra pivot consecutivi e genera segnali di acquisto e vendita quando il prezzo rompe quelle linee di tendenza alla chiusura confermata di una candela. Ogni segnale viene filtrato attraverso fino a quattro strati di confluenza indipendenti — tendenza EMA, limiti RSI, rilevamento di picchi di volume e forz
FIBOChannels
Hafis Mohamed Yacine
Fibonacci Channel What is a Fibonacci Channel? The Fibonacci channel is a technical analysis tool that is used to estimate support and resistance levels based on the Fibonacci numbers. It is a variation of the Fibonacci retracement tool, except with the channel the lines run diagonally rather than horizontally. It can be applied to both short-term and long-term trends, as well as to uptrend and downtrends. Lines are drawn at 23.6, 38.2, 50, 61.8, 78.6, 100, 161.8, 200, 261.8, 361.8 and 423.6 p
Retracement Hunter This Indicator based on powerfull daily  levels . support and resistance, Buy / Sell entries which is more based on low risk  and high reward and winning ratio, Enter trade  when you get popup alert , book profit on target1, target 2, target3 levels, most of the trending days it will hit target3, but its always safe  to book partial at target1 or target2 Buy best entry when rule 1) look for Buy 2) Emas aligned less than 0.25 3) Main Ema aligned Buy , it will alert when all th
Crosshair Local Time
Alberto Gauer Borrego
If you ever wanted to know your local time (or NY time) at any bar on the chart without needing to waste time with mental calculations, look no further. This indicator creates a crosshair which you can drag anywhere on the chart and will show you the local time in a label on top of the time axis. Press the "c" key to show/hide the crosshair. Left click it to pick it up and drag anywhere, left click again let it go. You can't hide the crosshair without letting it go first. Time setting inputs
KT Market Speed MT4
KEENBASE SOFTWARE SOLUTIONS
The KT Market Speed is a unique and straightforward oscillator-based technical analysis tool that helps traders visualize the speed at which the price of an instrument changes based on the preset length. The Market Speed representation helps correctly map the price momentum: is it moving fast, slowing down, or trapped in a range? These are the questions the indicator answers, giving traders more bandwidth to execute better-informed trade positions. Formula It's a simple technical analysis tool
Description: The indicator measures, through the zigzag indicator, the levels of trend or correction. It shows in the chart the levels of each low or high detected. KEY LINKS:   How to Install  –  Frequent Questions  -  All Products  How is this indicator useful? This indicator determines, depending on Zigzag parameter if a trend is beginning, developing, or ending This indicator determines the direction of the trend Components Levels as positive or negative numbers, depending on the direction
FREE
Ska ZigZag BuySell
NKATEKO VUKOSI LEROY MASANGO
Ska ZigZag BuySell indicator determines the overbought and oversold regions within a trend. The indicator determines the overbought region by the candlestick high and the oversold region by the candlestick low. This indicator only gives signals with arrow and audible alerts each and every time when a new candlestick appear. To utilize the full strategy i recommend using "Ska ZigZag BuySell" together with "Ska ZigZag Line". The Ska ZigZag Line indicator is available for free. NOTE: Indicator is h
CloseBarInfo
Dmitrii Korchagin
L'indicatore mostra sul grafico l'ora corrente del server e l'ora fino alla chiusura della barra corrente. Le informazioni sono molto utili nei momenti di rilascio delle notizie, quando i commercianti sono in attesa della chiusura della candela, per l'inizio della sessione di trading. La dimensione e il colore del carattere possono essere adattati al modello del grafico. Regolazioni: Text color - Colore del testo di visualizzazione Text size - dimensione del testo di visualizzazione Aggiungimi
FREE
Fibonacci SR Indicator
Martin Eshleman
5 (1)
Fibonacci SR Indicator This indicator creates support and resistance lines. This indicator is based on Fibonacci Retracement and Extension levels. It will consider many combinations of the Fibonacci levels and draw support/resistance lines based on these. This indicator uses tops and bottoms drawn by the ZigZag indicator in its calculations. The ZigZag can also be drawn on the chart, if necessary. The indicator considers many combinations of past reversal points and Fibonacci ratio levels, and w
FREE
SNR LEVEL INDICATOR Accurate Snr level indicator will only display Fresh Levels that are close to the Current Market Price. This indicator is very accurate in mapping Support & resistance levels. there is an alert feature when the price TOUCHES the SNR LEVEL, WHEN CLOSE CANDLE BREAK/REJECT SNR LEVEL. INDICATOR MARKING : - SUPPORT LEVEL = V SHAPE - RESISTANCE LEVEL = APEX LEVEL - GAP RESISTANCE & GAP SUPPORT = OPEN CLOSE CANDLE - SUPPORT BECAME RESISTANCE & RESISTANCE BECAME SUPPORT INDICATOR C
Range Exhaustion
Robert Gerald Wood
L'esaurimento dell'intervallo si verifica quando il prezzo raggiunge o supera l'intervallo previsto per il periodo corrente. A questi livelli, il prezzo inizia a perdere slancio rispetto all'inizio del periodo, quindi è un buon punto per assicurarsi di non assumere nuove posizioni. Questo indicatore ti mostrerà dove è probabile che ciò accada sul tuo grafico, mostrando i livelli per periodi giornalieri, settimanali e mensili. Quando vedi che il prezzo supera questi livelli di esaurimento, ti sta
EForex Camarilla
Veridiana Adorno Kendrick
Become a constantly profitable 5-star forex trader!  We offer a few indicators to support you understand and analyse the market! With our strategies you will improve your trading system and bacome an expert... We have indicators for trend direction, market direction and others.. for multi-time frames and that covers all majors or your favorite trading symbols! Some of them offer a customizable calculation parameters... or Graph features! See how powerful they are! The are also easy-to-use tr
Double HMA lines MTF
Pavel Zamoshnikov
5 (2)
This is a multi-timeframe version of the popular Hull Moving Average (HMA). The Double HMA MTF Light indicator combines two timeframes on a single chart. The HMA of the higher timeframe defines the trend, and the HMA of the current timeframe defines short-term price movements. The indicator is freely distributed and hasn't audio signals or messages. Its main function is the visualization of price movements. If you need advanced functionality of the HMA multi-timeframe indicator (information ab
FREE
Leo Fibonacci
Dmitriy Zaytsev
The indicator is designed for determining Fibonacci levels. Does not repaint/redraw The blue level shows the zero Fibonacci value (it is also the Pivot level) Red levels show calculated Fibonacci levels (used as a rollback or reversal point) Automatic period detection (periods can be entered manually) Adjustable display calculation method. Settings BarsHistory - the number of bars to be used to display the indicator. Method - method of calculation. AutoPeriod - automated period calculation (true
VWAP pro
Mikhail Nazarenko
VWAP   (Value Weighted Average Price)   is an indicator of market makers and banks. It is used by professional traders for intraday, weekly and long-term trading. If you are not familiar with it yet, it is high time to figure it out. How does VWAP work? VWAP shows the volume-weighted average price over a certain period. Its calculation takes into account both the price change and the volume of transactions in each candle. Candles with a higher volume have a greater impact, which increases the ac
Indicators 14 in 1
Makarii Gubaydullin
5 (1)
14 indicatori e strumenti ausiliari per un trading conveniente Questa utility contiene 14 strumenti aggiuntivi che possono essere utili per determinate azioni del trader,   semplificando e accelerando così il processo di trading. Dai un'occhiata al mio  #1 Trade Manager : include 66+ funzioni e indicatori  |   Contattami  se hai domande A causa delle diverse risoluzioni dei monitor, alcuni utenti potrebbero riscontrare che le etichette vengono visualizzate in sovrapposizione o troppo piccole. Se
Free automatic Fibonacci is an indicator that automatically plots a Fibonacci retracement based on the number of bars you select on the BarsToScan setting in the indicator. The Fibonacci is automatically updated in real time as new highest and lowest values appears amongst the selected bars. You can select which level values to be displayed in the indicator settings. You can also select the color of the levels thus enabling the trader to be able to attach the indicator several times with differe
FREE
Follow The Line PRO
Oliver Gideon Amofa Appiah
3.67 (3)
FOLLOW THE LINE (PRO VERSION) This powerful indicator is the full and complete version of my free indicator called "Follow The Line". IT IS BASED ON the popular maxim that: "THE TREND IS YOUR FRIEND" It gives alarms and alerts of all kinds. IT DOES NOT REPAINT and can be used for all currency pairs and timeframes. AVOID FALSE SIGNALS: BUY ONLY when price closes above the green line and the green line is above the blue channel. SELL ONLY when price closes below the pink line and the pink line i
ADR Bands
Navdeep Singh
4.5 (2)
Average daily range, Projection levels, Multi time-frame ADR bands shows levels based on the selected time-frame. Levels can be used as projections for potential targets, breakouts or reversals depending on the context in which the tool is used. Features:- Multi time-frame(default = daily) Two coloring modes(trend based or zone based) Color transparency  
FREE
AllTrendLines
Evgeniy Zhdan
4 (1)
Brief Description of the All Trend Lines Indicator The indicator analyzes the wave structure of the market. What it displays on the chart: First. Wave pivots (semaphores) • Red markers – wave highs • Yellow markers – wave lows • Yellow-green markers – additional local extremes Second. Trend lines • Purple/blue lines – trends based on highs (resistance/support) • Beige/green lines – trends based on lows • Lines are built automatically by connecting wave pivots of the same type Third. Main trend
Market Fractal Analysis, Fractal Swing, Market Flow Fractal Cycles looks for Similar Patterns in the Market that repeat themselves because of the Market Fractal Nature. These patterns are displayed with help of Graphical Objects and Alerts can be received on their arrival. Read the Blog for full information. Features:- Auto Detection of Patterns Customization for Color and Line Styles Alerts, Emails & Push Notifications 
FE Fibo Expansion
Syahirul Nizzam Bin Haron
This is Fibo Expansion. You can use it, as profit target at any level... It use price Highs and Lows and price between... It is simple and easy to use... No Input menu, just drag it on your chart and it ready to use... The blue and red dot color indicate it direction... It also use as the same as fractal high and low price as the points to construct the levels... No more analysis to choose the points..
FREE
Cloud Power
Andriy Sydoruk
Implementation of indication of trend movement with moments for potential stops in the Cloud Power indicator. The transition to the shadow warns of a possible reversal. The entry of the price inside the shadow speaks of a flat movement. The indicator tracks the market trend with unmatched reliability, ignoring sharp market fluctuations and noise around the average price. Simple, visual and efficient use. The indicator does not redraw and does not lag. It can be easily used as an independent t
HF PriceGrid
Wong Sze Wai
5 (1)
This indicator help you to easily calculate the price moving. You can change the gird size withing the input parameter for your trading style, such as hedge, swing trader, ect. It can let you easy to find your takeprofit and stoploss target price in chart. For more about my tools and EA, you can join my channel below, thank you. Telegram channel:   t.me/HenryEAChannel
FREE
Gli utenti di questo prodotto hanno anche acquistato
Neuro Poseidon MT4
Daria Rezueva
4.96 (26)
Neuro Poseidon is a new indicator by Daria Rezueva. It combines precise trading signals with adaptive TP/SL levels - creating best possible trades as a result! Message me and get  Neuro Poseidon Assistant  as a gift to automize your trading process! What makes it stand out? 1. Proven profitability on all assets and timeframes 2. Only confirmed BUY and SELL signals present on the chart 3. Adaptive TP & SL levels generated by the software for each trade 4. Easy to understand - suitable for all
M1 Sniper
Oleg Rodin
5 (23)
M1 SNIPER è un sistema di indicatori di trading facile da usare. Si tratta di un indicatore a freccia progettato per l'intervallo temporale M1. L'indicatore può essere utilizzato come sistema autonomo per lo scalping sull'intervallo temporale M1 e come parte del tuo sistema di trading esistente. Sebbene questo sistema di trading sia stato progettato specificamente per il trading sull'intervallo temporale M1, può comunque essere utilizzato anche con altri intervalli temporali. Inizialmente ho pro
Gann Made Easy
Oleg Rodin
4.84 (164)
Gann Made Easy è un sistema di trading Forex professionale e facile da usare che si basa sui migliori principi del trading utilizzando la teoria di mr. WD Gann. L'indicatore fornisce segnali ACQUISTA e VENDI accurati, inclusi i livelli di Stop Loss e Take Profit. Puoi fare trading anche in movimento utilizzando le notifiche PUSH. CONTATTAMI DOPO L'ACQUISTO PER RICEVERE GRATUITAMENTE LE ISTRUZIONI DI TRADING E OTTIMI INDICATORI EXTRA! Probabilmente hai già sentito parlare molte volte dei metodi d
Scalper Inside PRO
Alexey Minkov
4.74 (68)
Scalper Inside PRO Scalper Inside PRO is an intraday trend and scalping indicator for MetaTrader 4 that uses an exclusive algorithm to quickly detect market direction and key target levels. It automatically calculates entry, exit and multiple profit targets, and shows detailed performance statistics so you can see how different instruments and strategies performed. This helps you choose the most suitable trading instruments for the current market conditions. Additionally, you can easily integrat
PRO Renko System
Oleg Rodin
5 (30)
PRO Renko System è un sistema di trading altamente accurato appositamente progettato per il trading di grafici RENKO. Questo è un sistema universale che può essere applicato a vari strumenti di trading. Il sistema neutralizza efficacemente il cosiddetto rumore di mercato che consente di accedere a segnali di inversione accurati. L'indicatore è molto facile da usare e ha un solo parametro responsabile della generazione del segnale. Puoi facilmente adattare lo strumento a qualsiasi strumento di
Dynamic Forex28 Navigator
Bernhard Schweigert
4.43 (7)
Dynamic Forex28 Navigator - Lo strumento di trading Forex di nuova generazione. ATTUALMENTE SCONTATO DEL 49%. Dynamic Forex28 Navigator è l'evoluzione dei nostri indicatori popolari di lunga data, che combinano la potenza di tre in uno: Advanced Currency Strength28 Indicator (695 recensioni) + Advanced Currency IMPULSE con ALERT (520 recensioni) + CS28 Combo Signals (Bonus). Dettagli sull'indicatore https://www.mql5.com/en/blogs/post/758844 Cosa offre l'indicatore di forza di nuova generazione?
Trend Catcher ind
Ramil Minniakhmetov
5 (1)
INDICATORE TREND CATCHER L'indicatore Trend Catcher analizza i movimenti dei prezzi di mercato, utilizzando una combinazione di indicatori di analisi del trend proprietari dell'autore e personalizzati. Identifica la vera direzione del mercato filtrando il rumore a breve termine e concentrandosi sulla forza del momentum sottostante, sull'espansione della volatilità e sul comportamento della struttura dei prezzi. Utilizza inoltre una combinazione di indicatori personalizzati di smoothing e filtr
Trend Lines PRO
Roman Podpora
5 (1)
LINEE DI TENDENZA PRO       Aiuta a capire dove il mercato sta realmente cambiando direzione. L'indicatore mostra reali inversioni di tendenza e punti in cui i principali attori rientrano. Vedi  Linee BOS   Cambiamenti di tendenza e livelli chiave su timeframe più ampi, senza impostazioni complesse o rumore inutile. I segnali non vengono ridisegnati e rimangono sul grafico dopo la chiusura della barra. VERSIONE MT 5     -      Svela il suo massimo potenziale se abbinato all'indicatore   RFI LEVE
Enigmera
Ivan Stefanov
5 (8)
ENIGMERA: Il cuore del mercato Importante: La demo di MQL5.com funziona nel Strategy Tester e potrebbe non riflettere completamente le funzionalità di Enigmera. Consulta la descrizione, gli screenshot e il video per maggiori dettagli. Non esitare a inviarmi un messaggio se hai domande! Il codice dell'indicatore è stato completamente riscritto. La versione 3.0 aggiunge nuove funzionalità e corregge i bug accumulati dall'inizio dell'indicatore. Introduzione Questo indicatore e sistema di trading
KT Alpha Hunter Arrows MT4
KEENBASE SOFTWARE SOLUTIONS
La maggior parte degli indicatori a frecce ti dà un segnale e poi ti lascia capire da solo tutto il resto. KT Alpha Hunter Arrows ti offre un piano di trading completo. Ogni freccia di segnale viene visualizzata con un piano già tracciato: linea di ingresso, stop loss, quattro livelli di take profit e un verdetto edge in tempo reale che ti indica se quel simbolo e quel timeframe meritano di essere tradati in quel momento. Il pacchetto include un Trade Manager EA che gestisce l’esecuzione dopo il
Questo indicatore è un indicatore per l'analisi automatica delle onde perfetto per il trading pratico! Caso... Nota:   non sono abituato a usare nomi occidentali per la classificazione delle onde a causa dell'influenza della convenzione di denominazione di Tang Lun (Tang Zhong Shuo Zen), ho chiamato l'onda base come   penna   e la banda dell'onda secondaria come   segmento   At allo stesso tempo, il segmento ha la direzione del trend. La denominazione   è principalmente segmento di trend   (que
Genesis Matrix Pro is a professional multi-timeframe trend detection indicator designed to help traders identify high-quality market alignment with clarity and structure. It combines 12 different technical indicators into one visual alignment matrix, allowing traders to quickly see when market conditions are bullish, bearish, or neutral. A signal is generated only when the selected strategies are aligned, helping reduce noise and improve decision-making. PLEASE CONTACT ME AFTER PURCHASE TO GET
Questo prodotto è stato aggiornato per il mercato 2026 e ottimizzato per le ultime build di MT5. AVVISO DI AGGIORNAMENTO PREZZO: Smart Trend Trading System è attualmente disponibile a $99 . Il prezzo aumenterà a $199 dopo i prossimi 30 acquisti . OFFERTA SPECIALE: Dopo aver acquistato Smart Trend Trading System, inviami un messaggio privato per ricevere Smart Universal EA GRATIS e trasformare i tuoi segnali Smart Trend in operazioni automatiche. Smart Trend Trading System è un sistema di tradin
MTF Supply Demand Zones
Georgios Kalomoiropoulos
4.82 (22)
Nuova generazione di zone di domanda e offerta automatizzate. Algoritmo nuovo e innovativo che funziona su qualsiasi grafico. Tutte le zone vengono create dinamicamente in base all'azione dei prezzi del mercato. DUE TIPI DI AVVISI --> 1) QUANDO IL PREZZO RAGGIUNGE UNA ZONA 2) QUANDO SI FORMA UNA NUOVA ZONA Non ottieni un altro indicatore inutile. Ottieni una strategia di trading completa con risultati comprovati.     Nuove caratteristiche:     Avvisi quando il prezzo raggiunge la zona di
PZ Trend Trading
PZ TRADING SLU
4.8 (5)
Capture every opportunity: your go-to indicator for profitable trend trading Trend Trading is an indicator designed to profit as much as possible from trends taking place in the market, by timing pullbacks and breakouts. It finds trading opportunities by analyzing what the price is doing during established trends. [ Installation Guide | Update Guide | Troubleshooting | FAQ | All Products ] Trade financial markets with confidence and efficiency Profit from established trends without getting whips
Step into the world of Forex trading with confidence, clarity, and precision using   Gold Indicator   a next-generation tool engineered to take your trading performance to the next level. Whether you’re a seasoned professional or just beginning your journey in the currency markets, Gold Indicator equips you with powerful insights and help you trade smarter, not harder. Built on the proven synergy of three advanced indicators, Gold Indicator focuses exclusively on medium and long-term trends eli
MetaBands M4
Vahidreza Heidar Gholami
3.5 (6)
MetaBands uses powerful and unique algorithms to draw channels and detect trends so that it can provide traders with potential points for entering and exiting trades. It’s a channel indicator plus a powerful trend indicator. It includes different types of channels which can be merged to create new channels simply by using the input parameters. MetaBands uses all types of alerts to notify users about market events. Features Supports most of the channel algorithms Powerful trend detection algorith
Current event:  https://c.mql5.com/1/326/A2SR2025_NoMusic.gif R. Cos'è l'A2SR ?   * È un indicatore tecnico leader (nessuna riverniciatura, nessun ritardo). -- Guida : -- su https://www.mql5.com/en/blogs/post/734748/page4#comment_16532516 -- e https://www.mql5.com/en/users/yohana/blog A2SR ha una tecnica speciale per determinare i livelli di supporto (domanda) e resistenza (offerta). A differenza del modo ordinario che abbiamo visto in rete, A2SR ha un concetto originale nel determinare i li
Versione Swing M30/H1/H4 disponibile Vuoi catturare i grandi movimenti? Gold Signal Swing Pro (M30/H1/H4). Obiettivo: $20-$80+ per trade. https://www.mql5.com/en/market/product/177643 KURAMA GOLD SIGNAL PRO (MT4) — Sistema di Trading XAUUSD Completo con Filtro a 7 Strati, TP/SL Automatico e Punteggio di Qualità NESSUN REPAINT. NESSUN RIDISEGNO. NESSUN RITARDO. Ogni segnale è permanente. Ciò che vedi è ciò che ottieni. BONUS: Acquista la licenza a vit
BTMM State Engine Pro is a MetaTrader 4 indicator for traders who use the Beat The Market Maker approach: Asian session context, kill zone timing, level progression, peak formation detection, and a multi-pair scanner from a single chart. It combines cycle state logic with a built-in scanner dashboard so you do not need the same tool on many charts at once. What it does Draws the Asian session range; session times can follow broker server offset or be set in inputs. Tracks level progression (L
Advanced Supply Demand
Bernhard Schweigert
4.91 (300)
Speciale Trading- SCONTO DEL 40% La soluzione migliore per qualsiasi trader principiante o esperto! Questo indicatore è uno strumento di trading unico, di alta qualità e conveniente, perché abbiamo incorporato una serie di funzionalità proprietarie e una nuova formula. Con questo aggiornamento, potrai visualizzare doppie zone di timeframe. Non solo potrai visualizzare un TF più alto, ma anche entrambi, il TF del grafico e il TF più alto: MOSTRA ZONE ANNIDATE. Tutti i trader che operano con Of
Neo Wave PRO
Nikolay Raykov
Price & Time Market Structure Indicator A professional market structure tool that analyzes waves through both price and time — not price alone. Main Description NeoWave PRO is a professional market structure indicator for MetaTrader 4 designed for traders who want to move beyond traditional one-dimensional wave tools such as ZigZag, swing indicators, and basic high/low systems. Most wave indicators analyze only one thing: Price. But a real market wave is not only a price movement. A true wave de
RFI levels PRO
Roman Podpora
5 (1)
L'indicatore mostra accuratamente i punti di inversione e le zone di ritorno dei prezzi in cui il       Principali attori   . Vedi dove si formano le nuove tendenze e prendi decisioni con la massima precisione, mantenendo il controllo su ogni operazione. VERSION MT5     -     Rivela il suo massimo potenziale se combinato con l'indicatore   TREND LINES PRO Cosa mostra l'indicatore: Strutture di inversione e livelli di inversione con attivazione all'inizio di un nuovo trend. Visualizzazione dei l
Quant Direction
Georgios Kalomoiropoulos
Quant Direction è uno strumento di analisi di mercato 3D. Offre un'analisi di mercato perfettamente oggettiva, basata su algoritmi, calcolando con precisione le deviazioni percentuali su diversi parametri. Sviluppato utilizzando strumenti di modellazione avanzati basati sull'intelligenza artificiale e rigorosamente testato, questo algoritmo analizza il mercato con una precisione senza pari. È possibile analizzare qualsiasi coppia di valute o strumento finanziario sulla piattaforma. Che si pratic
MonsterDash Harmonic Indicator is a harmonic pattern dashboard. It recognizes all major patterns. MonsterDash is a dashboard that displays all detected patterns for all symbols and (almost) all timeframes in sortable and scrollable format. Users can add their own user defined patterns . MonsterDash can open and update charts with the pattern found. Settings MonsterDash's default settings are good enough most of the time. Feel free to fine tune them to your needs. The color settings are for thos
Apollo SR Master è un indicatore di Supporto/Resistenza con caratteristiche speciali che rendono il trading con le zone di Supporto/Resistenza più semplice e affidabile. L'indicatore calcola le zone di Supporto/Resistenza in tempo reale senza alcun ritardo, rilevando i massimi e i minimi dei prezzi locali. Quindi, per confermare la nuova area SR formata, l'indicatore mostra un segnale speciale che segnala che la zona SR può essere presa in considerazione e utilizzata come un vero e proprio segna
ATTUALMENTE SCONTATO DEL 40% La soluzione migliore per ogni principiante o trader esperto! Questo indicatore è uno strumento di trading unico, di alta qualità e conveniente perché abbiamo incorporato una serie di caratteristiche proprietarie e una nuova formula. Con un solo grafico è possibile leggere la forza delle valute per 28 coppie Forex! Immaginate come migliorerà il vostro trading perché sarete in grado di individuare l'esatto punto di innesco di una nuova tendenza o di un'opportunità
Auto Optimized Parabolic RSI: Motore di Momentum 3D Avanzato La maggior parte degli indicatori per trader privati fallisce perché si affida a parametri statici che smettono di funzionare nel momento in cui la volatilità del mercato cambia. Auto Optimized Parabolic RSI risolve il problema dell'"obsolescenza dell'indicatore" ricalcolando continuamente il proprio vantaggio matematico, portando un adattamento quantitativo di livello istituzionale direttamente sul tuo terminale MT5. Il Vantaggio Prin
PZ 123 Pattern
PZ TRADING SLU
1 (1)
Unlock powerful breakout opportunities The 123 Pattern is one of the most popular, powerful and flexible chart patterns. The pattern is made up of three price points: a bottom, a peak or valley, and a Fibonacci retracement between 38.2% and 71.8%. A pattern is considered valid when the price breaks beyond the last peak or valley, moment at which the indicator plots an arrow, rises an alert, and the trade can be placed. [ Installation Guide | Update Guide | Troubleshooting | FAQ | All Products  ]
Market Makers
Mohamed Hassan
5 (4)
After purchase, contact me privately to receive 1 month of free testing with EA Forex Proton! This advanced MT4 trading robot automatically executes signals from any MT4 indicator, including Market Makers. The latest version also includes AI integration, allowing each trade signal to be analyzed using Artificial Intelligence. Live Signal with EA Forex Proton: Click here Market Makers is a powerful price action trading system designed to identify high-probability Buy and Sell opportunities based
Altri dall’autore
Fibo Projection
Noor Ghani Rahman
5 (1)
This tools is design to easily forecast the projection of the current trend through the inputs of Zigzag and get out of the market when the trend do not the ability to maintain it's volatility to go further... the indicator gets the initial and final price from the value of zigzag automatically by adjusting the intdepth of zigzag. You can also switch from Projection to Extension from the inputs tab of indicator.
FREE
Auto Gann Angle
Noor Ghani Rahman
This Indicator is made on the behalf of traders to trade inside the Gann angles. The indicator has the inside function of auto adjusting the chart window zooming in/out when the terminal is connected to the internet and new Tick come to draw the angles on the proper way of price and time. The angle would be not drawn until the suitable zooming is not achieved upon tick by tick. The starting value of angle drawn is calculated the Zigzag indicator. The zigzag can be adjusted through the back-cand
Pivot Point is a technical tool widely used by traders to predict major support and resistance price levels by calculating previous history and to predict the current price reversal points. Traders want to determine about the swing point from which there should be much possibility that the market price will be getting back, in such analysis pivot point plays an important rule. Different site explaining the logic of pivot point as: A technical analysis indicator used to determine the overall tr
Candle Trigger
Noor Ghani Rahman
Hedging Martingale EA The EA open first 9 Trades of initial Lotsize and from 10 - 19 of Multiplier in the sequence of 10 - 19, 20 - 29, 30 - 39 etc,. which minimize the risk to your capital and calculate the Average TP for Buy and Sell side orders as two TPs, The EA can be test on Meta Terminal Tester, the EA is opening many trades so initial lotsize of 0.01 is best on history record, but you can test by yourself higher lot of 0.02 and 0.03 while the tested timeframe is 30 minutes and 1 hour is
Mechanism : The EA opening trade base on the standard " Japanese CandleSticks Technical Analysis " and confirming the signal by various reversal zone define by "Divergence, Support and Resistance, and some common Indicators like Sto, Bollinger Band, MACD etc" under the CONFIRMATION INPUTS SETTINGS (True/false option). Lot Method: The EA is Implemented with fixed lot size and Auto lot base on specified Risk Management System base on the available account balance by some percent risk of that's. Tr
Japanese candlesticks can be used for any time frame, whether it be one day, one hour, 30-minutes ….whatever you want! They are used to describe the price action during the given time frame. Japanese candlesticks are formed using the open, high, low, and close of the chosen time period. CandleStick Scanner X provides market analysis through the detection and analysis of Japanese candlestick patterns. Candlestick based market analysis is one of the most popular technical analysis methods. Combina
Ikka Martingale
Noor Ghani Rahman
The Ikka Martingale Strategy The EA is design to trade on the basis of martingale with average TP, but here it start from two type of initial trades " Limit Orders and Stop Orders Pending"  for determination of trend direction so You should be want to run different different settings for every pair as you will Optimize the that pair and it will make Profit as It only closes the Open trades on specified Take Profit value in Points.
Auto AndrewFork
Noor Ghani Rahman
1 (1)
Auto Pitchfork Indicator The indicator calculate the Pitch fork for the previous Day (Selectable) with multiple Support and Resistance lines from the Median price which acts as Magnet for the Price that if price touch the above warning (1) or below warning (1) lines and not cross up or down then there is maximum possibilities that it will return to the Median Line, and thus maintain the Price Action in Cyclic Pattern to the Market Move. You are able to select how many warning lines you want to k
GF BetaHedging EA
Noor Ghani Rahman
Beta Hedging EA The EA is trading in Martingale style whether you want to trade at a time sell side or buy side (Selectable) with Increasing Lot/Grid or you can keep these two Constant,... ======= >>>   The EA is design specitially for ECN account so always be test zero spread accounts   <<< ======= This is Martingale base EA so should be want to have at least 3000$ for Per Pair Trading. EURUSD <= 2 spread GBPUSD <= 4 spread NZDUSD <= 4 spread AUDUSD <= 4 spread Trade Closing System: There is Ta
Session Ploter
Noor Ghani Rahman
Auto GMT Base Session Indicator "The Link to find your session time base on your GMT is given inside the indicator Description" You can find your GMT Zone and Session times from the following website to insert into this Indicator inputs, and keep the Keep GMT On as true for the first time, when you determine your Session Times according to your GMT base then you can keep this inputs as false and modify your session time according to your broker, GMT calculation is only need when you don't know t
Filtro:
Nessuna recensione
Rispondi alla recensione