Symbol Profit
- Indicatori
-
Dmitriy Moshnin
 Торговать нужно так, чтобы не было мучительно больно за бесцельно вложенные деньги...
 - Versione: 3.2
- Aggiornato: 24 settembre 2021
- Attivazioni: 5
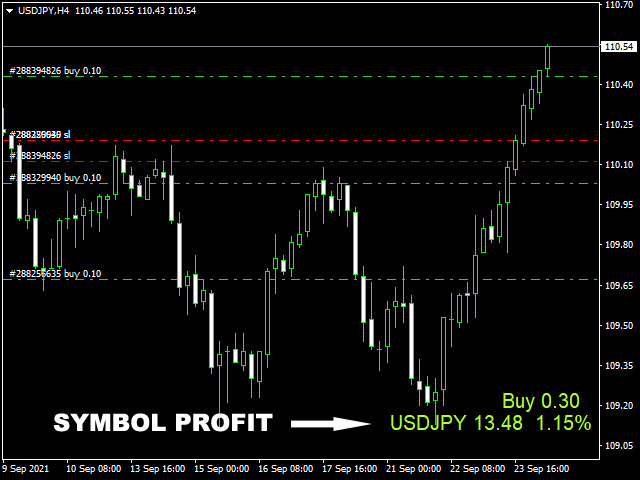
This is an indicator for MetaTrader 4. It is small, nice and compactly sized for a chart window, while conveniently displaying all the necessary information: open position volumes and total profit on them. Font size, corner and color can be set according to your preferences. By default, a positive position is displayed in green and a negative one is shown in red. Happy Trading.
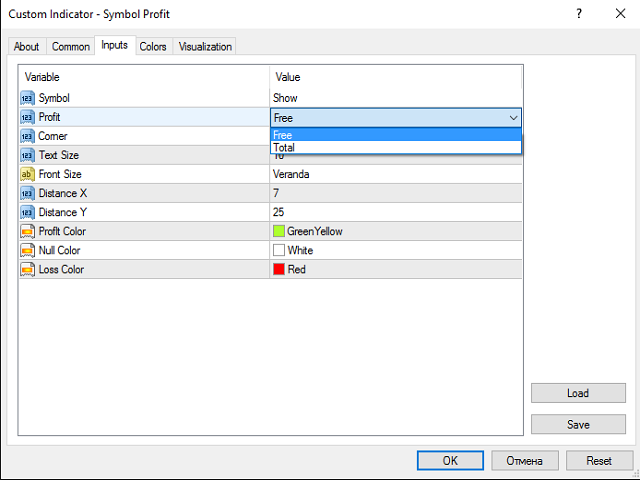
Indicator Parameters
- Symbol - name of the current symbol in the window: Show – display, Hide – do not display;
- Profit – profit of the current instrument: Total - total profit (with commissions and swaps, etc.), Free - net profit (without commissions and swaps, etc.)
- Corner – display corner in the chart window;
- Text Size – font size;
- Front Size - font;
- Distance X – distance along the horizontal axis;
- Distance Y - distance along the vertical axis;
- Proflt Color – color of a profitable position;
- Null Color - color of a zero position;
- Loss Color - color of a losing position.


L'utente non ha lasciato alcun commento sulla valutazione.