Tarzan
- Indicatori
-
Iurii Tokman
 Veda http://ytg.com.ua resource - the author works for automation of trade on the forex market - advisers, experts will, trading robots, indicators, trading strategies, scripts, functions and libraries.
 - Versione: 1.0
- Attivazioni: 20
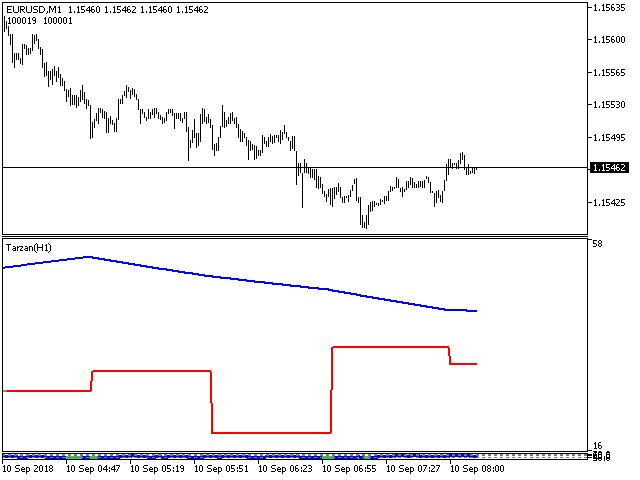
Tarzan
The indicator is based on the reading of the relative strength index.
The fast line is the index readings from the senior period, it is redrawn for the number of bars that fit into one bar of the senior period, for example: if the indicator readings from the H4 period are set and the indicator is set to M15, the redrawing will be 16 bars on the M15 period.
The slow line is a smoothed moving average index.
The indicator uses different types of signals to make trading decisions, depending on the settings.
Description of indicator settings:
- TimeFrame - chart period from which the indicator will be calculated.
- RSI_period - averaging period for calculating the index.
- RSI_applied - used price.
- MA_period - index smoothing period.
- iMA_method - anti-aliasing method
- Alerts - enable a dialog box containing custom data
- Text_BUY - custom text for a buy signal
- Text_SELL - custom text for a sell signal
- Send_Mail - send emails to the address specified in the settings window on the "Mail" tab
- subject - email header
- Send_Notification - send a notification to mobile terminals whose MetaQuotes ID are specified in the settings window on the "Notifications" tab.


L'utente non ha lasciato alcun commento sulla valutazione.