Harmonic Patterns Track Record MT4
- Indicatori
-
Mario Jemic
 Analista Certificato dei Mercati dei Capitali e dei Titoli
Investitore professionale.
Ingegnere sviluppatore dietro FXCM Trading Station.
Ho l’opportunità di lavorare con alcune delle tecnologie più avanzate disponibili oggi.
Posizione attuale: Zagabria, Croazia
Impieghi precedenti: - Versione: 1.0
- Attivazioni: 5
Harmonic patterns that keep their record: every pattern stays on the chart with its result, with statistics per pattern, BUY / SELL zones and a scanner.
Description
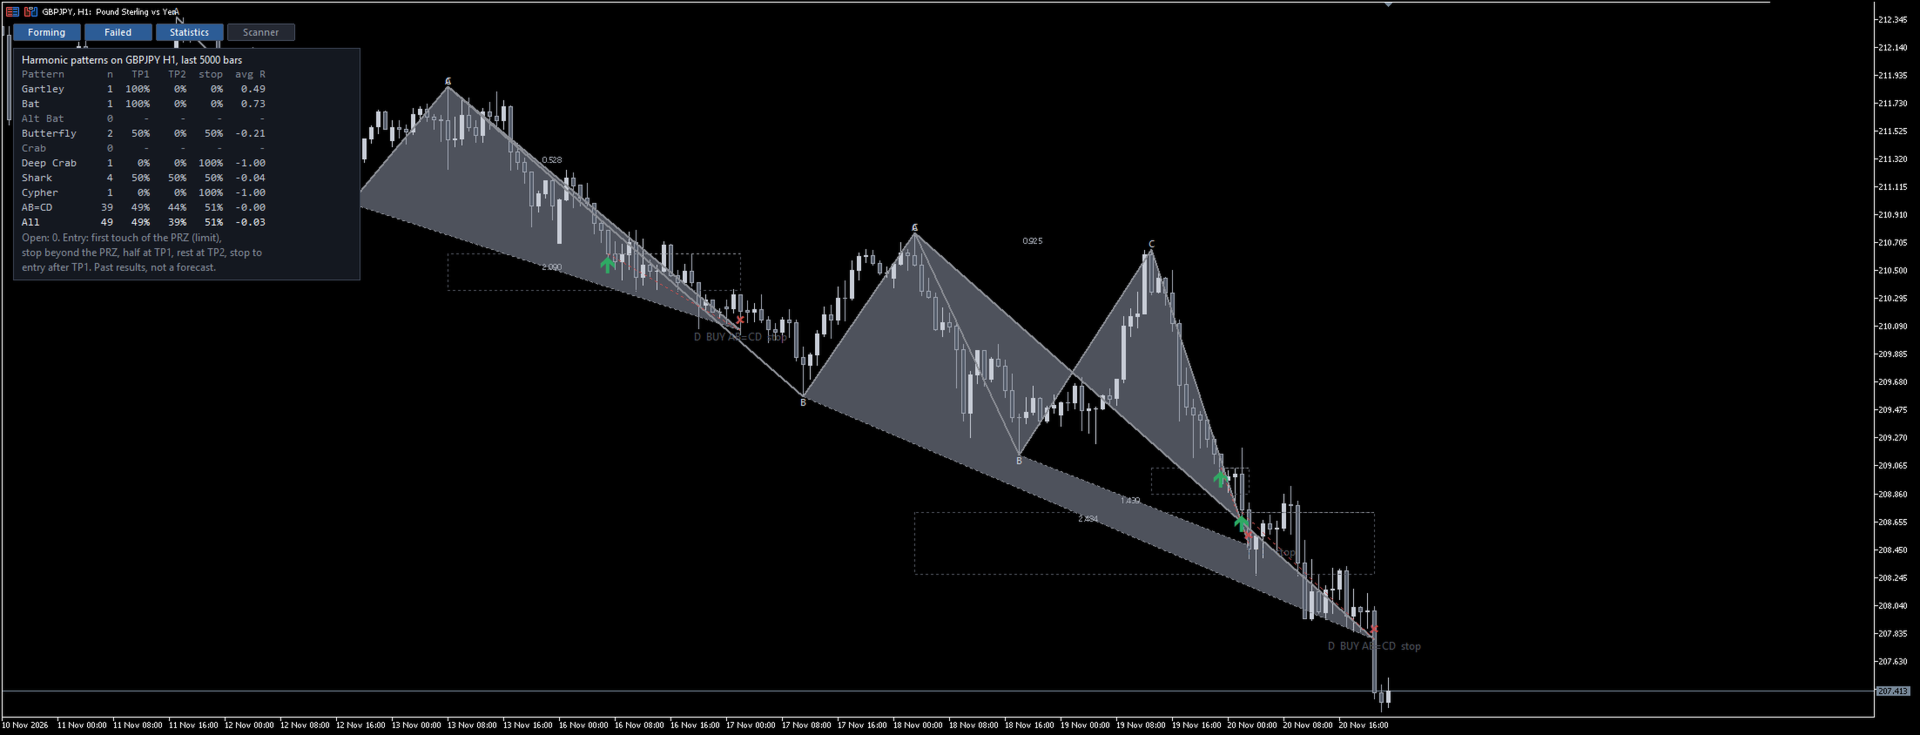
Most harmonic pattern indicators show you a chart full of perfect patterns. The failed ones were redrawn or removed, so the history looks better than any trader could have traded it. Harmonic Patterns Track Record works the other way round: every pattern is tested the way you would trade it, and every result stays on the chart.
How a pattern is traded
1. When the points X, A, B and C are confirmed, the indicator calculates the zone where D completes the pattern (the PRZ): the overlap of the XA (or XC) retracement and the BC projection of the pattern.
2. The chart shows a BUY ZONE or SELL ZONE with the planned limit price, stop, TP1 and TP2.
3. The trade is filled on the first touch of the zone. If price goes beyond C first, or takes too long, the pattern is cancelled.
4. Stop beyond the far side of the zone; TP1 and TP2 are retracements of the move from C to the entry (38.2 % and 61.8 % by default). Half is closed at TP1 and the stop moves to the entry.
5. The result is marked on the chart: a check mark at TP1 or TP2, a cross at the stop. Patterns that hit their stop stay visible in grey (button "Failed").
Nothing is decided with hindsight: the zone is known before price reaches it, and a pattern never changes after it is drawn.
Patterns
Gartley, Bat, Alternate Bat, Butterfly, Crab, Deep Crab, Shark, Cypher and AB=CD, each with its own Fibonacci ratios; every type can be switched off, and the ratio tolerance is an input.
Statistics
The panel shows, for each pattern type on the current symbol and timeframe: number of trades, TP1 reached, TP2 reached, stops and the average result in R. This tells you which patterns are worth trading on this chart and which are not. The figures are past results on your broker's history, not a forecast.
What is on the chart
- Each pattern: X-A-B-C-D with its legs, the measured ratios, BUY or SELL with an arrow at the entry, its zone and the result.
- Open trade: entry, stop, TP1 and TP2 with prices.
- Forming pattern: BUY / SELL ZONE with the limit price, stop and targets, and its name.
- Panel: statistics table and the next zone with all prices.
- Buttons: Forming, Failed, Statistics, Scanner.
Scanner
A list of symbols (13 by default, editable) on the chart timeframe: for each symbol the next zone and its distance in pips, or the latest pattern and its result. Click a row to open that symbol.
Alerts
Alert (and optional push notification) when price reaches the zone of a pattern and when a trade is filled.
Inputs
- Swing depth (bars that confirm a swing point), ratio tolerance, bars to analyse, pattern types.
- Stop, TP1 and TP2 as parts of the leg from C.
- Patterns drawn, ratio labels, colours of bullish, bearish and failed patterns and of BUY / SELL.
- Scanner symbols and bars, alerts, push notifications.
Notes
- Swing points are confirmed after the chosen number of bars, so a zone appears only after C is confirmed.
- The statistics count only closed trades; open ones are shown separately.
- Harmonic patterns do not work everywhere: use the statistics to see where they did on your chart. No result is guaranteed.
- Works on all symbols and timeframes. No DLLs, no external files.