Weinstein Stage Analysis MT5
- Indicatori
-
Mario Jemic
 Analista Certificato dei Mercati dei Capitali e dei Titoli
Investitore professionale.
Ingegnere sviluppatore dietro FXCM Trading Station.
Ho l’opportunità di lavorare con alcune delle tecnologie più avanzate disponibili oggi.
Posizione attuale: Zagabria, Croazia
Impieghi precedenti: - Versione: 1.0
- Attivazioni: 5
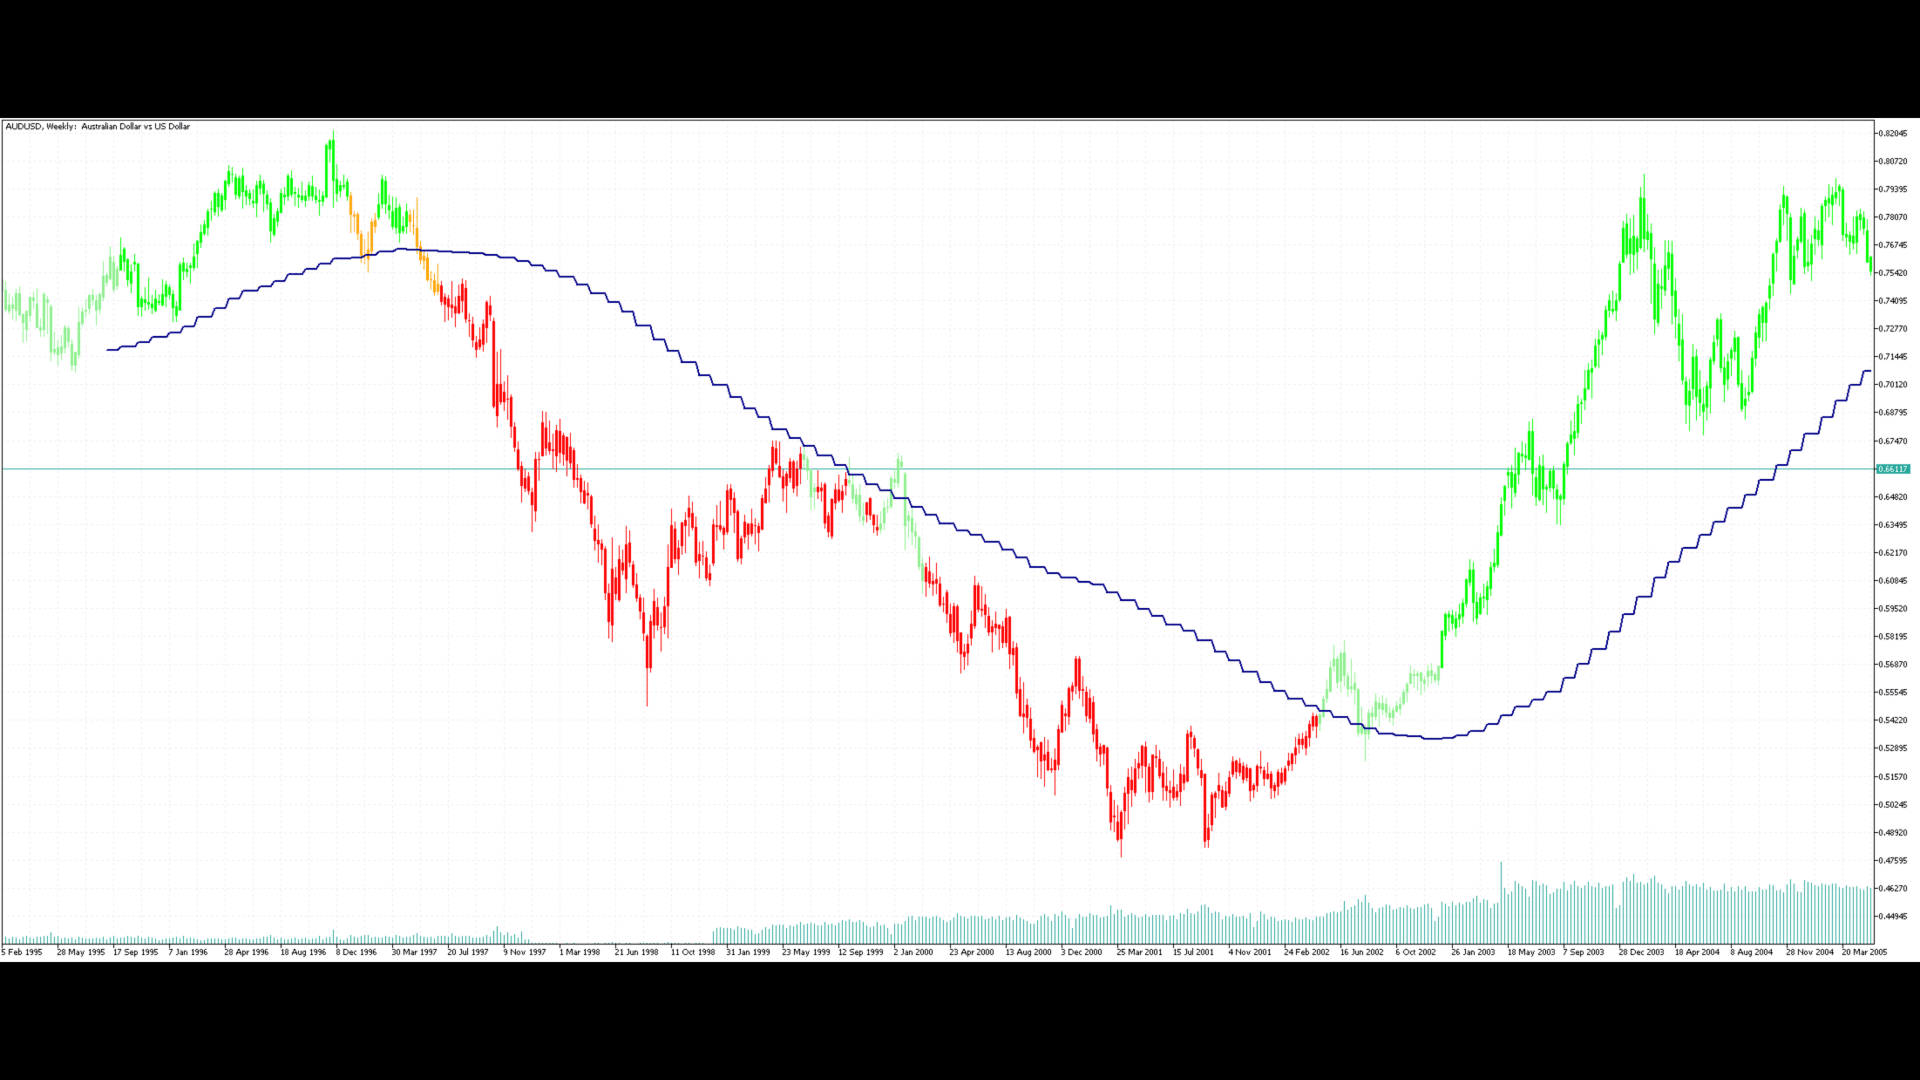
Weinstein Stage Analysis (MTF) – Professional Market Structure Indicator
This indicator implements Stan Weinstein’s Stage Analysis in a clean, modern, and fully MTF-correct way for MetaTrader 5.
It automatically identifies the four classical market stages:
-
Stage 1 – Base / Accumulation
-
Stage 2 – Advancing Trend
-
Stage 3 – Distribution
-
Stage 4 – Declining Trend
Unlike many simplified versions, this indicator:
-
Calculates the trend on a higher timeframe moving average
-
Projects the correct stage onto any lower chart timeframe
-
Does not repaint
-
Works instantly after loading (no refresh required)
Key Features
✔ Multi-Timeframe (MTF) logic
✔ Candle coloring based on market stage
✔ Dynamic MA from selected timeframe
✔ Stable stage transitions (no flickering)
✔ Ideal for trend trading, position trading, and market regime filtering
Perfect for traders who want to:
-
Trade only in Stage 2 trends
-
Avoid chop and distribution phases
-
Align lower-timeframe entries with higher-timeframe structure