Contraction Expansion Meter
- Indicatori
- Versione: 1.0
- Attivazioni: 5

Contraction Expansion Meter
A clear and powerful volatility indicator that visualizes market contraction and expansion in real time.
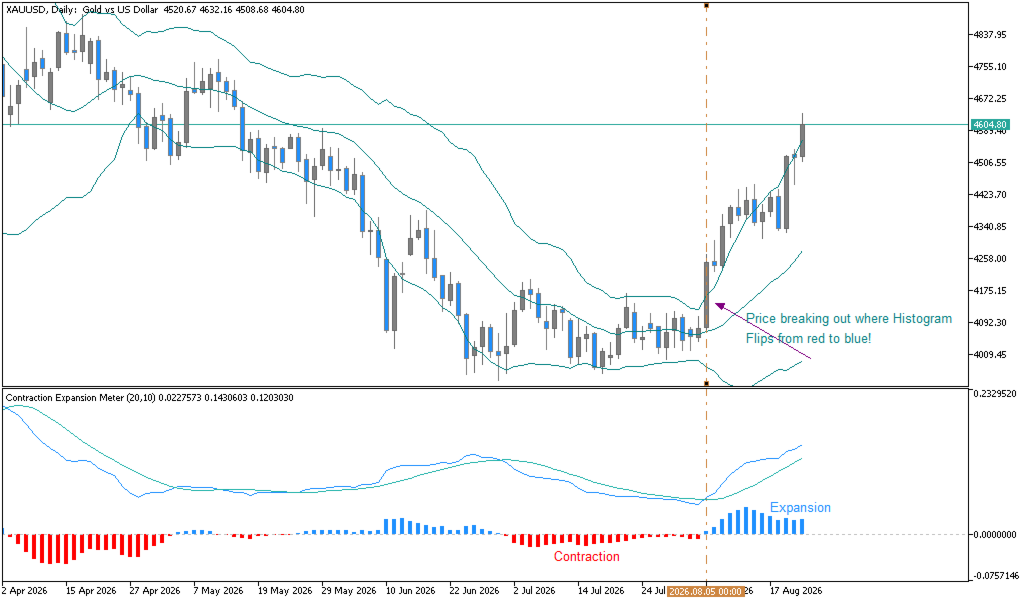
Based on Bollinger Bands logic, the indicator measures the relative width of the bands and compares it to its own moving average. This creates a highly intuitive oscillator that shows when the market is compressing (contraction / squeeze) or expanding (volatility breakout).
What you see on the chart:
- Histogram
- Blue bars → Expansion (volatility is increasing)
- Red bars → Contraction (volatility is decreasing / squeeze)
- Aqua line → Current Deviation Width
- Lime line → Deviation Width Average
When the histogram is deeply red and the lines are close together, the market is in a tight squeeze — often a precursor to a strong directional move. When the histogram turns blue and the lines diverge, volatility is expanding and a trend or breakout is underway.
Key Features
- Clean, non-repainting calculation
- Color-coded histogram for instant visual recognition
- Adjustable Bollinger period, deviation, and squeeze (smoothing) period
- Works on any symbol and any timeframe.
Inputs
- Bands Period (default 20)
- Squeeze Period (default 10)
- Deviation (default 2.0)
- Shift
How to use
- Look for prolonged red histogram periods (contraction) as potential squeeze setups.
- Watch for the histogram to flip from red to blue — this often signals the start of expansion.
- Combine with price action, support/resistance, or your existing strategy for higher-probability entries.
Ideal for traders who want a simple yet effective way to identify volatility regimes, squeeze conditions, and the beginning of strong market moves.
- Squeeze Breakout
Prolonged red histogram + converging lines → high probability of expansion. Enter in the direction of the first strong blue bar breakout. - Trend Continuation
During an established trend, blue histogram peaks confirm volatility expansion and support holding or adding to positions. - Range Exhaustion
Deep red histogram after an extended move often signals volatility contraction and potential mean-reversion or pause. - Multi-Timeframe Filter
Use higher-timeframe Contraction Expansion Meter as a volatility filter: only take lower-timeframe signals when the higher TF is in expansion (blue).