DowTheoryVisual Dow Theory Swing Trend MT5

  • Indicatori
  • Naoto Shimoda
    Naoto Shimoda
    • MetaTrader 4/5 Indicator & EA Developer al  FX.Hamrat
    • Giappone
    • 1166
    FX.Hamrat - MetaTrader 4/5 indicator and Expert Advisor developer based in Japan.
    Over 10 years of trading experience (discretionary and systematic), and 90+ MT4/MT5 programs built so far - including 30+ custom-made projects for individual traders.
  • Versione: 1.1
  • Attivazioni: 10

The Dow Theory structure of the chart — in one look.

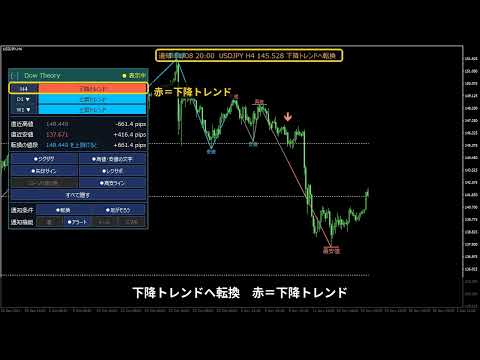
DowTheoryVisual labels every swing high and low as HH, HL, LH or LL and draws a zigzag colored by the trend: blue for an uptrend, red for a downtrend, gray for a range. The panel keeps showing the trend of the current chart and of two higher timeframes side by side.

Features

  1. HH / HL / LH / LL labels: each swing high and low is compared with the previous one.
  2. Trend-colored zigzag: up blue, down red, range gray. The color changes on the bar where the trend changed.
  3. Arrow signs: on the bar where the trend changed. Closed bars only.
  4. Two higher timeframes on the panel, next to the current chart. Switch them with the v buttons (M5 to MN).
  5. Turn level: the price where the current trend would turn, and the distance in pips.
  6. Support / resistance from levels broken again and again, and short lines on the last swing high and low.
  7. Candle coloring by trend with one button.
  8. Notifications: sound, alert, e-mail and push when the trend changes and when all three timeframes line up. Each kind at most once per 60 seconds (adjustable).
  9. Movable panel: drag the title to move it, click it to fold. Works on 125% / 150% display scaling.

How the trend is decided

A bar higher (lower) than the 14 bars on each side is a swing high (low); highs and lows alternate. In an uptrend an LH or LL turns it into a range; in a downtrend an HH or HL turns it into a range. In a range, breaking above the recent high starts an uptrend and breaking below the recent low starts a downtrend. Higher timeframes use the same steps. Swing labels appear after the following bars close, and when a new swing is confirmed the latest arrow sign may move.

Inputs (main)

  • Swing bars on each side, bars to calculate
  • Trend colors; zigzag, labels, arrow signs, swing lines, candle coloring
  • Support / resistance: max lines, merge width, minimum count, style
  • Higher timeframes 1 / 2
  • Panel: show, position, colors, font size, transparent background
  • Time zone, notification interval, notification messages

It does not give buy or sell signals and does not guarantee profits.
Prodotti consigliati
Value Chart Candlesticks
Flavio Javier Jarabeck
4.57 (14)
The idea of a Value Chart indicator was presented in the very good book I read back in 2020 , " Dynamic Trading Indicators: Winning with Value Charts and Price Action Profile ", from the authors Mark Helweg and David Stendahl. The idea is simple and the result is pure genius: Present candlestick Price analysis in a detrended way! HOW TO READ THIS INDICATOR Look for Overbought and Oversold levels. Of course, you will need to test the settings a lot to find the "correct" one for your approach. It
FREE
ZigZag2LineLT
Alberto Da Silva Lira
- iZigZag2LineLT New version 3.0 of the iZigZag2LineLT indicator where it is possible to search for possible exhaustion regions of the market looking for small or large reversals, it follows the same characteristics contained in the indicator of the LTB and LTA lines, Fibonacci, Supports and Resistances with the application of Market Undecided zones (improved version of Stop or Move by Sato´s), in these areas suggestions (through the dotted lines) appear to include pending orders always lookin
Kaido SMC
Alex Amuyunzu Raymond
KAIDO SMC is a Smart Money Concepts indicator built for XAUUSD on MetaTrader 5. It waits for liquidity to be swept, displacement to confirm, and structure to shift — then it presents one clean BUY LIMIT or SELL LIMIT at a high-quality point of interest. No signal spam. No repainting. No arrows on every zone touch. The Idea Behind It Most indicators fire the moment price touches a zone. KAIDO SMC does not. A zone alone means nothing. An FVG alone means nothing. What matters is the full sequence —
L'indicatore consente di determinare la direzione del prezzo corrente e la volatilità del mercato. Questa versione del Traders Dynamic Index ha eliminato il ridisegno dei dati storici, ottimizzata la velocità di calcolo dell'algoritmo, più parametri esterni per un aggiustamento più preciso e le sue funzionalità estese: aggiunta la selezione dell'oscillatore iniziale e le modalità di smoothing delle medie . Parametri: Mode Osc - stima della selezione dell'oscillatore Period Osc - il periodo di ca
Breakout Boxes with Volume Pressure This indicator automates the identification of key consolidation zones (Supply and Demand) based on Market Pivots and Volatility (ATR). Unlike standard support/resistance tools, this indicator provides a unique   Volume Pressure Analysis   inside every box, giving you insight into the battle between Buyers and Sellers before a breakout occurs. Key Features Automated Supply & Demand Zones:   Automatically detects significant Pivot Highs and Lows to draw dyna
Weis Waves
Flavio Javier Jarabeck
2.83 (18)
The original author is David Weis, an expert in the Wyckoff Method. The Weis Wave is a modern adaptation of the 1930's Wyckoff Method, another expert in Tape Reading techniques and Chart Analysis. Weis Waves takes market volume and stacks it into waves according to price conditions giving the trader valuable insights about the market conditions. If you want to learn more about this subject you can find tons of videos in YouTube. Just look for "The Wickoff Method", "Weis Wave" and "Volume Spread
FREE
The indicator highlights the points that a professional trader sees in ordinary indicators. VisualVol visually displays different volatility indicators on a single scale and a common align. Highlights the excess of volume indicators in color. At the same time, Tick and Real Volume, Actual range, ATR, candle size and return (open-close difference) can be displayed. Thanks to VisualVol, you will see the market periods and the right time for different trading operations. This version is intended f
FREE
Easy VWAP
Luca Spinello
VWAP Indicator, the short form of Volume Weighted Average Price, is similar to a moving average but takes into consideration the tick volume of the candles. The indicator calculates the moving average multiplying the price of each candle for the tick volume in the candle. Said calculation weighs with more significance price where more transactions were made. Features: Visual styling customizable Period customizable Ease of use
FREE
OmniSignal Navigator - Smart Entries at Key Levels Trade Like a Professional with this daily/weekly High-Low-Close indicator, designed for scalping or intraday short term trading and precision breakout trading. Suggested Timeframes to trade with: M 5 DO NOT USE THE INDICATOR ON THE M1 TIMEFRAME! Why It Works Perfect for Scalping/Intraday: Targets key zones (PDH/PDL/PDC & PWH/PWL/PWC) on M2, M3, M5, M15 timeframes. (Lower Timeframes = More Signals, Higher Timeframes = Less Signals) No Chart Anal
FREE
Bollinger Bands B
Flavio Javier Jarabeck
4.5 (6)
John Bollinger created this indicator in 2010 as a way to read the original indicator (Bollinger Bands) in a more "technical" way, shown as an oscillator. The typical range of the Bollinger Bands %B is 0 - 0.5 - 1.0, where "0" represents the lower band, the "0.5" the middle band, and "1" the upper band. The line on the indicator represents the Closing prices. As simple as that. SETTINGS Bollinger Bands period of analysis Standard Deviation multiplier Shift Price type to be analyzed If you like
FREE
Stackable VWAP
Flavio Javier Jarabeck
3.5 (4)
Volume Weighted Average Price (VWAP) is a trading benchmark commonly used by Big Players that gives the average price a Symbol has traded throughout the day. It is based on both Volume and price. Additionally we put in this indicator the MVWAP (Moving Volume Weighted Average Price). For those who do not know the usage and the importance od this indicator I recommend a great article about this subject at Investopedia ( https://www.investopedia.com/articles/trading/11/trading-with-vwap-mvwap.asp
FREE
White Weis Volume Ticks
Ricardo Almeida Branco
5 (4)
White Weis Volume This indicator shows the sum of the volume in each wave, bulish or bearish, as idealized by David Weis , but it brings an important addition , which is the marking of the bar with the highest volume of the wave (White Bar)! In coding the indicator, it was sought to optimize the code to require minimal processing during use and not to overload mt5. The indicator can be used for pre-trading analysis and study, where the trader analyzes possible points of support and resistance
This is a buyer and seller aggression indicator that analyzes the shape of each candle and project this data in a histogram form. There are 4 histograms in one. On the front we have two: Upper - Buyer force. Lower - Seller force. At the background we also have two histogram, both with same color. They measure the combined strenght of buyers and sellers. This histograms can be turned off in Input Parameters. It is also possible to have the real or tick volume to help on this force measurement. IN
FREE
This is Gekko's Cutomized Cutomized Average Directional Index (ADX), a customized version of the famous ADX indicator. Use the regular ADX and take advantage two entry signals calculations and different ways of being alerted whenever there is potential entry or exit point. Inputs Period: Period for the ADX calculation; PlotSignalType: How will the indicator calculate entry (swing) signals: 1- ShowSwingsOnTrendLevel : Show Signals for Trend Confirmation Swings; 2- ShowSwingsOnTrendLevelDirection
Renko bricks drawn as time-anchored boxes on your ordinary chart, so brick structure and real time stay visible together. A renko brick prints when price moves a set distance, ignoring how long that takes. That strips out the sideways noise a time chart is full of. The usual way to see them is a separate offline chart, which loses the clock. This draws the same bricks over your normal candles instead, so you keep the time axis, your other indicators, and your orders. How the bricks are built Onl
FREE
QQE Mod Professional
Daniel Ortega Clemente
5 (1)
This indicator implements the QQE (Qualitative Quantitative Estimation) algorithm for MetaTrader 5, incorporating volatility bands logic. The indicator combines the Relative Strength Index (RSI) with Average True Range (ATR) to determine market direction. The histogram changes color based on the interaction between the RSI momentum and the calculated volatility channel. Technical Logic: The algorithm smoothes the RSI values and constructs upper and lower bands. When the smoothed RSI breaks these
FREE
VWAP Indicator
LUC JACOBUS A VERHEECKE
4.11 (27)
Volume Weighted Average Price (VWAP) The volume weighted average price (VWAP) is a  trading   benchmark  used by traders that gives the average price a security has traded at throughout the day, based on both volume and price. It is important because it provides traders with insight into both the trend and value of a security. This indicator VWAP V2 is free and is the manual version of the extended Easy VWAP indicator (30 Euro), where the date and time properties are automatically entered. With
FREE
Overview CAP Channel Trading v4.0 is an advanced channel-based trading indicator for MetaTrader 5. The indicator combines a Linear Weighted Moving Average (LWMA) with Average True Range (ATR) deviations to create adaptive dynamic channels that respond to market volatility in real time. Key Features • Non-repainting channel calculation • Dynamic upper and lower bands based on ATR • Real-time band touch detection with green highlight overlays • Buy and Sell reversal arrows • Multi-layer visu
FREE
Weis Waves è un indicatore tecnico sviluppato da David Weis, ispirato ai principi di Richard Wyckoff. A differenza del volume tradizionale, mostrato barra per barra, Weis Waves accumula il volume in “onde” rialziste o ribassiste, ricominciando il conteggio ogni volta che il prezzo cambia direzione. Questo metodo consente al trader di vedere chiaramente la vera forza del movimento di mercato, poiché ogni onda riflette l’intensità del volume che sostiene la sequenza di candele. Caratteristiche
FREE
PROMETHEUS TECHNICAN VERSION Free | By THE SONS A gift from The Sons — no strings, no trial, no expiry. Every trader deserves access to professional-grade market intelligence. That belief is why Prometheus Technical Version exists, and why it costs nothing. Consider it our handshake to the trading community. What You're Getting This is not a simplified tool dressed up as a gift. Prometheus Technican Version is a fully built, institutional-quality technical analysis indicator running a dual-model
FREE
Ict institutional zones
Marrion Netondo Wabomba
SMC VALID EA (MT5) Version: 1.10 Author: Marrion Brave Wabomba Category: Smart Money Concepts (SMC) and  ICT concepts ICT Smart Money Daily Zones (SMC Pro)  ICT Smart Money Daily Zones (SMC Pro) – ICT Daily Buy & Sell Zones Pro is a professional-grade Smart Money Concepts (SMC) / ICT trading indicator for MetaTrader 5, designed to clearly map institutional daily levels and guide traders with high-probability decision zones . This indicator automatically analyzes the Daily timeframe (PDH / PD
The most important price level in any "Volume profile" is the "Point of Control" . This is the price level with the highest trading volume. It is primarily the level where large players initiate their positions, making it the accumulation/distribution level for the "Smart money" . The idea of the indicator arose after the "MR Volume Profile 5" indicator was made. When creating the "MR Volume Profile 5" indicator, we spent a lot of time comparing the volumes with those from the volume profile in
Indicator Description 4 Hull MA Color + Envelopes is a powerful trend-following indicator for MetaTrader 5 that combines four Hull Moving Averages (HMA) with Moving Average Envelopes to clearly identify market direction, trend strength, and potential reversal or pullback zones. This indicator is designed to reduce noise, react quickly to price movement, and provide a clean visual structure for professional trading.   Key Features   4 Hull Moving Averages (20, 50, 100, 200) Automatic color change
FREE
Indicador Regressão Linear – Par de Ativos - INTRADAY Indicador é um oscilador que faz o plot do Resíduo resultado da regressão linear entre os dois ativos inseridos como input do indicador, representado pela fórmula: Y = aX + b + R Onde Y é o valor do ativo dependente, X é o valor do ativo independente, a é a inclinação da reta entre os dois ativos, b é a intersecção da reta e R é o resíduo. O resíduo representa a quantidade da variabilidade que Y que o modelo ajustado não consegue explicar. E
FREE
Plus BB Color
Leonel Alberto Jose Quintana
Plus BB Color è un indicatore visivo per MetaTrader 5 sviluppato per facilitare la lettura della posizione del prezzo all'interno di una struttura basata sulle Bande di Bollinger e su una media mobile esponenziale dinamica. L'indicatore combina la banda superiore e inferiore, una linea centrale colorata e marcature visive dei possibili estremi di prezzo, aiutando l'utente a identificare aree di espansione, deviazione e possibili punti di esaurimento del movimento. Caratteristiche principali Band
FREE
VWAP and MVWAP
Flavio Javier Jarabeck
4 (9)
Volume Weighted Average Price (VWAP) is a trading benchmark commonly used by Big Players that gives the average price a Symbol has traded throughout the day. It is based on both Volume and price. Additionally we put in this indicator the MVWAP (Moving Volume Weighted Average Price). For those who do not know the usage and the importance od this indicator I recommend a great article about this subject at Investopedia ( https://www.investopedia.com/articles/trading/11/trading-with-vwap-mvwap.asp )
FREE
PZ Penta O MT5
PZ TRADING SLU
3.8 (5)
The Penta-O is a 6-point retracement harmonacci pattern which usually precedes big market movements. Penta-O patterns can expand and repaint quite a bit. To make things easier this indicator implements a twist: it waits for a donchian breakout in the right direction before signaling the trade. The end result is an otherwise repainting indicator with a very reliable trading signal. The donchian breakout period is entered as an input. [ Installation Guide | Update Guide | Troubleshooting | FAQ | A
FREE
This z-score indicator shows the correct z-score of an asset, as it uses the normalized price data for calculation, which is the only correct way. Z-score is only applicable for normal distributed data, therefore not the actual price is considered, but the normalised returns, which were assumed to follow a normal distribution. Returns are mean reverting and assumed to follow a normal distribution, therefore z-score calculation of returns is more reliable than z-score on price, as price is NOT m
Auto Fibonacci
Ali Gokay Duman
5 (3)
This indicator calculates fibonacci levels via moving averages trend and draw these lines. You can change fast and slow Moving Averages settings for customization. Inputs: Fast MA Time Period :  64 Fast MA Shift: 0 Fast MA Method: Smoothed Fast MA Apply To: Median Price Slow MA Time Period: 32 Slow MA Shift: 0 Slow MA Method: Smoothed Slow MA Apply To: Median Price ZigZag: False ZigZag Color: Red ZigZag Type: DashDot ZigZag Width: VeryThin Fibo Settings TrendFibonacci: True FiboTrendColor: Black
FREE
MACD Enhanced
Nikita Berdnikov
4 (4)
Introducing the MACD  Enhanced – an advanced MACD (Moving Average Convergence Divergence) indicator that provides traders with extended capabilities for trend and momentum analysis in financial markets. The indicator uses the difference between the fast and slow exponential moving averages to determine momentum, direction, and strength of the trend, creating clear visual signals for potential entry and exit points. Attention! To achieve the best results, it is recommended to adapt the indicator
FREE
Gli utenti di questo prodotto hanno anche acquistato
Trend Sniper X
Sarvarbek Abduvoxobov
4.9 (40)
Trend Sniper X è un indicatore trend-following multi-timeframe per MetaTrader 5 che aiuta i trader a identificare la direzione del trend e i potenziali punti di inversione con chiarezza e precisione. per MT4: https://www.mql5.com/en/market/product/193245 Informazioni sul prezzo: Il prezzo attuale è promozionale ed è soggetto a modifiche con il rilascio di futuri aggiornamenti e nuove funzionalità. Offerta Bonus: Per ricevere GRATIS l'Auto-Trade Assistant EA per questo indicatore, invia un messa
Smart Trend Trading System — MetaTrader 5 Dopo l'acquisto, inviami un messaggio su MQL5 per ricevere GRATUITAMENTE Smart Universal Expert Advisor, insieme al corso online, al manuale PDF e all'accesso al gruppo privato. STTS riunisce la direzione del trend, i segnali di entrata e uscita, le zone di inversione e i livelli di prezzo importanti direttamente sul grafico. Segui il sistema manualmente oppure collega un EA compatibile separato per eseguire le operazioni automaticamente con le impostazi
Zoryk Gold
Reda El Koutbane
5 (15)
ZORYK — Sistema avanzato di segnali XAUUSD per MetaTrader 5 Conosci sicuramente questa sensazione. Passi molto tempo ad analizzare l’oro. Aspetti il punto d’ingresso corretto. Finalmente apri l’operazione e il prezzo inizia immediatamente a muoversi contro di te. Chiudi troppo presto, sposti lo Stop Loss o esiti per alcuni secondi. Successivamente il mercato raggiunge esattamente l’obiettivo che avevi previsto inizialmente, ma senza di te nella posizione. Il problema non era sempre la direzione.
SuperScalp Pro
Van Minh Nguyen
4.56 (36)
SuperScalp Pro - Professional Multi-Layer Confluence Scalping System SuperScalp Pro è un indicatore avanzato per lo scalping che migliora il Supertrend classico attraverso diversi filtri intelligenti di conferma. Aiuta a identificare opportunità di Buy/Sell con una probabilità maggiore, riducendo significativamente i falsi segnali. Le frecce Buy e Sell vengono visualizzate direttamente sul grafico, mentre i livelli di Stop Loss e Take Profit basati sull’ATR vengono calcolati automaticamente in t
Un nuovo Re in città - Indicatore + Gestione ordini (TP1 + TP2 + TP3) + Invio opzionale di segnali Telegram INCLUSO (GRATIS) (SISTEMA COMPLETO DI TRADING e SEGNALI) Il nostro miglior EA per l’Oro: Gold Slayer Questo indicatore include una strategia avanzata, un sistema di trading con gestione ordini personalizzabile e un sistema mean reversion che combina estensioni di envelope, supportato da molteplici filtri intelligenti di conferma come RSI per individuare ingressi di inversione ad alta proba
SMC Intraday Formula
VividMind Digital Solutions
5 (26)
Cominciamo con la verità. Nessun indicatore da solo ti renderà profittevole. Se qualcuno ti dice il contrario, ti sta vendendo un sogno. Qualsiasi indicatore che mostra frecce perfette di acquisto/vendita può essere reso impeccabile — basta ingrandire la giusta sezione della storia e catturare solo i trade vincenti. Noi non lo facciamo.  SMC Intraday Formula è uno strumento. Legge la struttura del mercato per te, identifica le zone a più alta probabilità e ti mostra esattamente come appare la t
GoldenX Entry MT5
VividMind Digital Solutions
5 (16)
GoldenX Entry è un indicatore per MT5 con un algoritmo adattivo Smart Entry Trend, un sistema di scoring dei segnali, un rilevatore del regime di mercato e un filtro di volatilità. Ogni segnale include un livello di ingresso calcolato, tre livelli di Take-Profit (TP1, TP2, TP3) e un livello di Stop-Loss. È costruito su più livelli analitici progettati per adattarsi a diverse condizioni di mercato, combinando un sistema analitico multilivello con un ottimizzatore integrato e un sistema di traccia
Gann Made Easy è un sistema di trading Forex professionale e facile da usare che si basa sui migliori principi del trading utilizzando la teoria di mr. WD Gann. L'indicatore fornisce segnali ACQUISTA e VENDI accurati, inclusi i livelli di Stop Loss e Take Profit. Puoi fare trading anche in movimento utilizzando le notifiche PUSH. CONTATTAMI DOPO L'ACQUISTO PER RICEVERE GRATUITAMENTE LE ISTRUZIONI DI TRADING E OTTIMI INDICATORI EXTRA! Probabilmente hai già sentito parlare molte volte dei metodi d
Neuro Poseidon MT5
Daria Rezueva
4.75 (52)
Neuro Poseidon is a new indicator by Daria Rezueva. It combines precise trading signals with adaptive TP/SL levels - creating best possible trades as a result! Message me and get  Neuro Poseidon Assistant  as a gift to automize your trading process! What makes it stand out? 1. Proven profitability on all assets and timeframes 2. Only confirmed BUY and SELL signals present on the chart 3. Adaptive TP & SL levels generated by the software for each trade 4. Easy to understand - suitable for al
La leggenda ritorna: Entry Points Pro 10. Il rilancio del leggendario indicatore che per 3 anni è rimasto nella Top-3 del MQL5 Market. Centinaia di recensioni entusiaste (589 su due versioni), migliaia di trader lo usano ogni giorno per operare, 31.000+ download della demo   MT4+MT5 . Ho letto ogni vostra recensione degli ultimi cinque anni — e invece di promesse ho inserito nella versione 10 le risposte. Dall'autore che opera sui mercati dal 1999 e tiene all'onestà, alla propria reputazione e a
ARIPoint
Temirlan Kdyrkhan
1 (4)
ARIPoint is a powerful trading companion designed to generate high-probability entry signals with dynamic TP/SL/DP levels based on volatility. Built-in performance tracking shows win/loss stats, PP1/PP2 hits, and success rates all updated live. Key Features: Buy/Sell signals with adaptive volatility bands Real-time TP/SL/DP levels based on ATR Built-in MA Filter with optional ATR/StdDev volatility Performance stats panel (Success, Profit/Loss, PP1/PP2) Alerts via popup, sound, push, or email Cu
Auto Optimized SpeedAngle è un sistema di vettorizzazione del momento di livello istituzionale che elimina l'overfitting ( curve-fitting ) attraverso l'ottimizzazione continua Walk-Forward (WFO). Invece di affidarsi a input statici che si degradano quando i regimi di mercato cambiano, l'indicatore recalibra dinamicamente i suoi parametri utilizzando la validazione Out-of-Sample (OOS), assicurando che i segnali visualizzati rappresentino reali vantaggi statistici anziché anomalie storiche. Quadro
Welcome to ENTRY IN THE ZONE AND SMC MULTI TIMEFRAME  SPECIAL BENEFIT / FOR OUR MQL5 CUSTOMERS FREE ACCESS TO THE NEW TOOL  — COMING SOON — Learn more on our official website  : https://www.fableedge.net Entry In The Zone and SMC Multi Timeframe is a real-time market analysis tool based on Smart Money Concepts (SMC) , designed to analyze market structure, price direction, and key trading zones. It supports both Single-Timeframe and Multi-Timeframe Analysis , providing a clearer view of overall m
Unix Scalper
Issam Kassas
4 (4)
Unix Scalper — MetaTrader 5 Dopo l'acquisto, inviami un messaggio su MQL5 per ricevere GRATUITAMENTE Smart Universal Expert Advisor, insieme al corso online, al manuale PDF e all'accesso al gruppo privato. Individua il setup. Esamina il piano. Scegli come operare. UNIX Scalper riunisce analisi di mercato, indicazioni BUY/SELL/WAIT e livelli Entry, Stop Loss, TP1 e TP2 in un unico pannello organizzato. VISUALIZZA IL SEGNALE E IL PIANO • Indicazioni chiare: BUY, SELL o WAIT. • Livelli definiti: E
FiboSniper Pro
Van Minh Nguyen
5 (3)
FiboSniper Pro – Multi-Filter Fibonacci System with Auto SL/TP and Control Panel FiboSniper Pro è un indicatore tecnico che combina Fibonacci Envelopes dinamici con diversi filtri di conferma per generare segnali Buy e Sell selezionati. I livelli di Fibonacci vengono calcolati sulla base di Moving Average e ATR e successivamente filtrati tramite ADX, EMA, RSI, ATR, Volume, Time e struttura delle candele. L’indicatore visualizza direttamente sul grafico i livelli automatici di Stop Loss e Take Pr
M1 Sniper MT5
Oleg Rodin
5 (7)
M1 SNIPER   è un sistema di indicatori di trading facile da usare. Si tratta di un indicatore a freccia progettato per l'intervallo temporale M1. L'indicatore può essere utilizzato come sistema autonomo per lo scalping sull'intervallo temporale M1 e come parte del tuo sistema di trading esistente. Sebbene questo sistema di trading sia stato progettato specificamente per il trading sull'intervallo temporale M1, può comunque essere utilizzato anche con altri intervalli temporali. Inizialmente ho p
Porta il tuo vantaggio nel trading sotto i riflettori! M5 Sniper è un nuovo indicatore di MeanFX. Combina segnali di trading precisi con livelli TP/SL adattivi , creando così le migliori operazioni statistiche possibili! Il prezzo aumenta ogni 5 acquisti, il prossimo prezzo è di 69$ Scrivimi dopo l'acquisto per ricevere consigli/guida e un EA bonus Cosa lo rende diverso? Performance statistica comprovata su Gold XAUUSD ( funziona su quasi ogni asset , concentrandosi sulla padronanza di un singol
Divergence Bomber
Ihor Otkydach
4.89 (94)
Ogni acquirente dell’indicatore riceverà inoltre gratuitamente: L’utilità esclusiva “Bomber Utility”, che gestisce automaticamente ogni operazione, imposta i livelli di Stop Loss e Take Profit e chiude le posizioni secondo le regole della strategia I file di configurazione (set file) per adattare l’indicatore a diversi asset I set file per configurare il Bomber Utility in tre modalità: “Rischio Minimo”, “Rischio Bilanciato” e “Strategia di Attesa” Una guida video passo-passo per installare, con
FX Trend MT5 NG
Daniel Stein
5 (6)
FX Trend NG: La Nuova Generazione di Intelligenza di Trend Multi-Mercato Panoramica FX Trend NG è uno strumento professionale di analisi del trend multi-timeframe e monitoraggio dei mercati. Ti consente di comprendere la struttura completa del mercato in pochi secondi. Invece di passare tra numerosi grafici, puoi identificare immediatamente quali strumenti sono in trend, dove il momentum sta diminuendo e dove esiste un forte allineamento tra i timeframe. Offerta di Lancio – Ottieni FX Trend NG
Tokyo mt5 Indicator
Vasiliy Strukov
5 (7)
Il Tokyo Indicator offre una chiara panoramica visiva della direzione del trend, dei potenziali segnali di trading e delle condizioni di mercato. La sua linea di trend a gradini, codificata a colori, distingue le fasi rialziste (in blu) da quelle ribassiste (in magenta). Frecce direzionali dedicate evidenziano potenziali opportunità di acquisto e vendita al variare del trend visualizzato. Una dashboard integrata riunisce in un'unica visualizzazione pratica il segnale corrente, il bias di mercato
RelicusRoad Pro MT5
Relicus LLC
4.96 (24)
RelicusRoad Pro: Sistema Operativo Quantitativo di Mercato 70% DI SCONTO ACCESSO A VITA (TEMPO LIMITATO) - UNISCITI A 2.000+ TRADER Perché la maggior parte dei trader fallisce anche con indicatori "perfetti"? Perché operano su Singoli Concetti isolati. Un segnale senza contesto è una scommessa. Per vincere serve CONFLUENZA . RelicusRoad Pro non è un semplice indicatore. È un Ecosistema Quantitativo completo . Mappa la "Fair Value Road", distinguendo tra rumore e rotture strutturali. Smetti di in
Market Structure Order Block Dashboard MT5 è un indicatore MT5 progettato per i trader che vogliono leggere la struttura di mercato e le principali zone di reazione del prezzo direttamente sul grafico. Combina BOS, ChoCH, Order Blocks, Fair Value Gaps (FVG), Liquidità, Kill Zones, Volume Profile e un pannello compatto per un'analisi rapida. Questo indicatore è rivolto ai trader che utilizzano la struttura di mercato, i concetti ICT e Smart Money come quadro decisionale. Può aiutare a individuare
Scalper Vault   è un sistema di scalping professionale che ti fornisce tutto il necessario per scalping di successo. Questo indicatore è un sistema di trading completo che può essere utilizzato dai trader di forex e opzioni binarie. L'intervallo di tempo consigliato è M5. Il sistema fornisce segnali di freccia accurati nella direzione della tendenza. Ti fornisce anche i segnali più alti e più bassi e i livelli di mercato di Gann. Gli indicatori forniscono tutti i tipi di avvisi, comprese le noti
Ciao a tutti i trader! Molti investitori individuali utilizzano script web lenti. Un approccio sistematico è essenziale per un trading redditizio. L'indicatore Astro AI non è semplicemente una visualizzazione su un grafico. Si tratta di una sofisticata rete neurale composta da due agenti che operano direttamente all'interno del terminale. Dettagli tecnici del sistema: 1. Agente 1: Analista (Rete neurale grafica – GNN) Il mercato non è costituito da singole barre di prezzo, ma da una rete di
Adaptive Price Action Engine Acquista un indicatore, ricevi l'EA gratis Analisi Auto-Ottimizzata del Trend e dei Pattern Candlestick Multi-Timeframe I mercati cambiano continuamente e non tutti i pattern di Price Action hanno lo stesso valore in ogni condizione di mercato. Adaptive Price Action Engine è progettato per adattarsi alle condizioni di mercato in continua evoluzione, combinando struttura del trend, analisi Multi-Timeframe, pattern Candlestick e ottimizzazione statistica in un unico fr
Smart Price Action Concepts — MetaTrader 5 Dopo l'acquisto, inviami un messaggio su MQL5 per ricevere GRATUITAMENTE Smart Universal Expert Advisor, insieme al corso online, al manuale PDF e all'accesso al gruppo privato. Osserva la struttura. Identifica le zone. Costruisci il tuo piano di trading. Riunisci Smart Money Concepts (SMC), analisi in stile ICT e azione del prezzo in un grafico organizzato. Identifica la struttura del mercato, gli order block, i livelli di riferimento della liquidità e
Atomic Analyst MT5
Issam Kassas
4.47 (60)
Atomic Analyst — MetaTrader 5 Dopo l'acquisto, inviami un messaggio su MQL5 per ricevere GRATUITAMENTE Smart Universal Expert Advisor, insieme al corso online, al manuale PDF e all'accesso al gruppo privato. Atomic Analyst riunisce l’azione del prezzo, la direzione del trend, i segnali di entrata e uscita, lo Stop Loss e diversi livelli di Take Profit direttamente sul grafico. INDIVIDUA IL SEGNALE. COMPRENDI IL CONTESTO OPERATIVO. Atomic Analyst organizza la sua analisi in informazioni visive ch
Crystal Heikin Ashi Signals
Muhammad Jawad Shabir
5 (4)
Crystal Heikin Ashi Signals—Professional Trend & Signal Detection Indicator Advanced Heikin Ashi Visualization with Intelligent Signal System for Manual & Automated Trading Final Price: $149 ---------> Price goes up $10 after every 10 sales . Limited slots available — act fast . Overview User Guide PDF Crystal Heikin Ashi Signals is a professional-grade MetaTrader 5 indicator that combines pure Heikin Ashi candle visualization with an advanced momentum-shift detection system. Designed for both m
Power Candles MT5
Daniel Stein
4.58 (12)
Power Candles V3 - Indicatore di forza ad ottimizzazione automatica Power Candles V3 trasforma la forza delle valute e degli strumenti in un piano di trading attuabile su ogni grafico a cui è collegato. Invece di limitarsi a colorare le candele, esegue un'auto-ottimizzazione in tempo reale in background e ti fornisce i migliori valori di Stop Loss, Take Profit e soglia di segnale per il simbolo che hai davanti. Basta un clic per adottarlo nel trading live: i raggi di ingresso, Stop Loss e Take P
Quant Direction MT5
Georgios Kalomoiropoulos
Quant Direction è uno strumento di analisi di mercato 3D. Offre un'analisi di mercato perfettamente oggettiva, basata su algoritmi, calcolando con precisione le deviazioni percentuali su diversi parametri. Sviluppato utilizzando strumenti di modellazione avanzati basati sull'intelligenza artificiale e rigorosamente testato, questo algoritmo analizza il mercato con una precisione senza pari. È possibile analizzare qualsiasi coppia di valute o strumento finanziario sulla piattaforma. Che si pratic
Altri dall’autore
See the Dow Theory direction of six timeframes in one panel. DowgatorPro2 judges the current trend direction (up or down) automatically by Dow Theory, using closed bars only. It carries over the features of the earlier e-DowgatorPro and puts first that even a beginner can read the direction without confusion. The direction of six timeframes (M1 to D1) is shown on the panel in color. Features Check direction mismatch: see on the panel whether your chart's timeframe agrees with the higher timefram
The levels of higher timeframes, on the chart you are watching. LineTraderPro2 finds swing highs and lows with Dow Theory rules and draws horizontal lines at the levels the market watches, for any of 20 timeframes from M1 to W1. Each line is labeled with its timeframe (H1, D1 and so on) and the date of the swing, so you can see at a glance which timeframe a level belongs to without switching charts. What you see on the chart Horizontal lines: the swing highs above the price and the swing lows be
See the market's fear level on the chart you trade. VixChecker shows the VIX (the volatility index often called the fear index) in a sub-window as one bar per day, colored by level: normal (blue), caution (yellow, 20 or above by default) and fear (red, 30 or above). The current value, the change from the previous close and the time of the value are shown in a small panel, and the value can also be shown on the main chart. Where the VIX values come from (please read before buying) The indicator d
Round numbers on your chart, and a notice when the price gets close. RoundNumberAlert draws horizontal lines at round numbers (150.000, 150.500 ...) and watches them for you. When the price enters the touch range, only that line blinks and you get one notification. Major round numbers stand out in gold, and a small panel shows how many pips are left to the next round number above and below. Features Round-number lines: the step starts at 10 pips (for example 50 pips: 150.000, 150.500 ...). Major
Entry signals as finger marks: yellow for trend-following, pink for counter-trend. SignRAMB combines RSI, ATR, MACD, a moving average, Dow theory and the candles, and marks the places where the price may turn up or down, based on past chart patterns. A finger pointing up is a buy, pointing down is a sell. Signals are decided on closed bars and never repaint. Signals are not always right. Use them as one indicator, together with your own reading of the chart. They are meant for the move right aft
Which currency is strong right now — in one panel. CurrencyStrength takes the RSI of the 28 pairs of USD, EUR, JPY, GBP, AUD, CHF, CAD and NZD, turns it into a score from −100 to +100 for each currency, and shows them as bars, strongest first. Features Strength ranking: strong currencies in green, weak ones in red, scored from −100 to +100. Automatic symbol detection: the pairs are found from each symbol's base and profit currency, so suffixes and prefixes (EURUSD#, EURUSD.pro, m.EURUSD, EURUSDm
Trendlines drawn for you — and a good shape kept as your basis. TrendLineSnap finds the swing highs and swing lows on your chart, joins them and draws one high trendline and one low trendline. Triangles, channels, wedges and horizontal levels used in line trading show up as lines. Automatic trendlines are redrawn whenever a new swing forms. When you see a shape you want to trade, save it. The saved line does not move. When the price comes near it again, show the saved line next to the current li
Where is the price inside the range — in one panel. BoxRangeSnap looks for price zones where the highs and lows touched the same top and bottom again and again, and draws them as a big box and a small box. The panel keeps showing the distance from the price to the top and bottom of the current box. Features Automatic range boxes: a big box and a small box, newest first. The current box is highlighted and extends to the last closed bar. Adjustable detection: minimum touches on the top and bottom,
The Dow Theory structure of the chart — in one look. DowTheoryVisual labels every swing high and low as HH, HL, LH or LL and draws a zigzag colored by the trend: blue for an uptrend, red for a downtrend, gray for a range. The panel keeps showing the trend of the current chart and of two higher timeframes side by side. Features HH / HL / LH / LL labels: each swing high and low is compared with the previous one. Trend-colored zigzag: up blue, down red, range gray. The color changes on the bar wher
Key levels on nine timeframes, and an alert the moment the price breaks out. Prices that were stopped again and again are levels many traders watch. BreakerDetectPro finds the zones where swing highs and swing lows gather and draws one level above and one below the price for each timeframe you select, from M1 to MN1. Higher-timeframe levels are drawn on the chart you are looking at. Features Automatic key levels: one level above and one below the price, from swing highs and lows that gather in t
See the Dow Theory direction of six timeframes in one panel. DowgatorPro2 judges the current trend direction (up or down) automatically by Dow Theory, using closed bars only. It carries over the features of the earlier e-DowgatorPro and puts first that even a beginner can read the direction without confusion. The direction of six timeframes (M1 to D1) is shown on the panel in color. Features Check direction mismatch: see on the panel whether your chart's timeframe agrees with the higher timefram
The levels of higher timeframes, on the chart you are watching. LineTraderPro2 finds swing highs and lows with Dow Theory rules and draws horizontal lines at the levels the market watches, for any of 20 timeframes from M1 to W1. Each line is labeled with its timeframe (H1, D1 and so on) and the date of the swing, so you can see at a glance which timeframe a level belongs to without switching charts. What you see on the chart Horizontal lines: the swing highs above the price and the swing lows be
Know exactly how long until the next release, and what came out. EconomicStopper shows the time to each economic release as a countdown, lists the upcoming events with their importance, and shows the actual value and the surprise against the forecast after the release. Everything is in one panel on the chart. It reads the economic calendar built into MetaTrader 5, so it needs no DLL and no web requests. How it behaves over time More than 5 minutes before: the timer counts down every second and t
See the market's fear level on the chart you trade. VixChecker shows the VIX (the volatility index often called the fear index) in a sub-window as one bar per day, colored by level: normal (blue), caution (yellow, 20 or above by default) and fear (red, 30 or above). The current value, the change from the previous close and the time of the value are shown in a small panel, and the value can also be shown on the main chart. Where the VIX values come from (please read before buying) The indicator d
Round numbers on your chart, and a notice when the price gets close. RoundNumberAlert draws horizontal lines at round numbers (150.000, 150.500 ...) and watches them for you. When the price enters the touch range, only that line blinks and you get one notification. Major round numbers stand out in gold, and a small panel shows how many pips are left to the next round number above and below. Features Round-number lines: the step starts at 10 pips (for example 50 pips: 150.000, 150.500 ...). Major
Entry signals as finger marks: yellow for trend-following, pink for counter-trend. SignRAMB combines RSI, ATR, MACD, a moving average, Dow theory and the candles, and marks the places where the price may turn up or down, based on past chart patterns. A finger pointing up is a buy, pointing down is a sell. Signals are decided on closed bars and never repaint. Signals are not always right. Use them as one indicator, together with your own reading of the chart. They are meant for the move right aft
Which currency is strong right now — in one panel. CurrencyStrength takes the RSI of the 28 pairs of USD, EUR, JPY, GBP, AUD, CHF, CAD and NZD, turns it into a score from −100 to +100 for each currency, and shows them as bars, strongest first. Features Strength ranking: strong currencies in green, weak ones in red, scored from −100 to +100. Automatic symbol detection: the pairs are found from each symbol's base and profit currency, so suffixes and prefixes (EURUSD#, EURUSD.pro, m.EURUSD, EURUSDm
Trendlines drawn for you — and a good shape kept as your basis. TrendLineSnap finds the swing highs and swing lows on your chart, joins them and draws one high trendline and one low trendline. Triangles, channels, wedges and horizontal levels used in line trading show up as lines. Automatic trendlines are redrawn whenever a new swing forms. When you see a shape you want to trade, save it. The saved line does not move. When the price comes near it again, show the saved line next to the current li
Where is the price inside the range — in one panel. BoxRangeSnap looks for price zones where the highs and lows touched the same top and bottom again and again, and draws them as a big box and a small box. The panel keeps showing the distance from the price to the top and bottom of the current box. Features Automatic range boxes: a big box and a small box, newest first. The current box is highlighted and extends to the last closed bar. Adjustable detection: minimum touches on the top and bottom,
Key levels on nine timeframes, and an alert the moment the price breaks out. Prices that were stopped again and again are levels many traders watch. BreakerDetectPro finds the zones where swing highs and swing lows gather and draws one level above and one below the price for each timeframe you select, from M1 to MN1. Higher-timeframe levels are drawn on the chart you are looking at. Features Automatic key levels: one level above and one below the price, from swing highs and lows that gather in t
Filtro:
Nessuna recensione
Rispondi alla recensione