AlgoLens Analyst
- Indicatori
- Versione: 2.0

AlgoLens Analyst is a FREE edition built to let you try the AlgoLens approach on your own charts. It is a lightweight on-chart dashboard that reads the market across several timeframes and shows the picture in one clear, movable panel — fast, honest context before you decide, with no signals that promise the impossible.
FREE EDITION — WHAT YOU GET
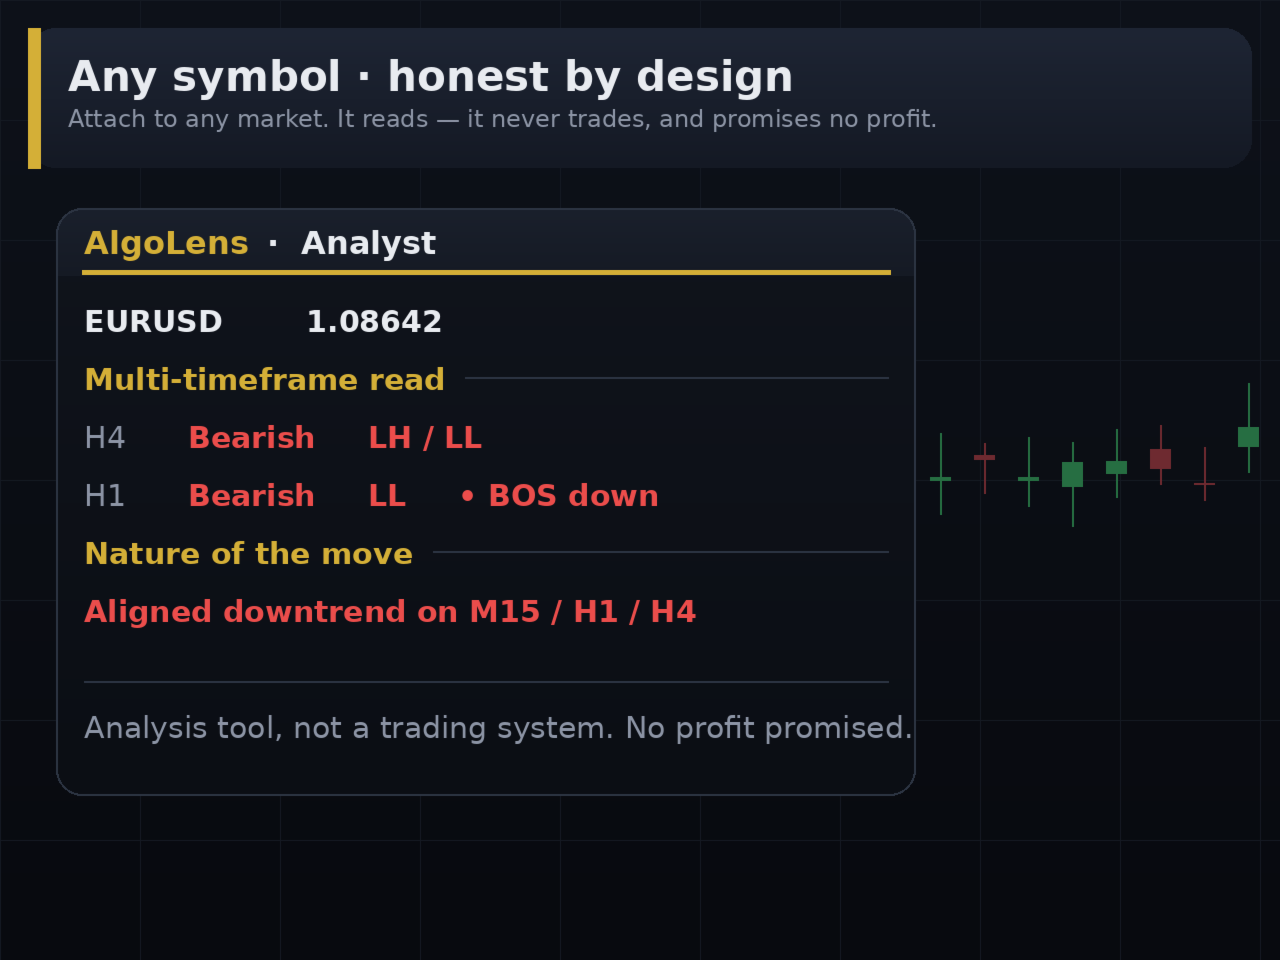
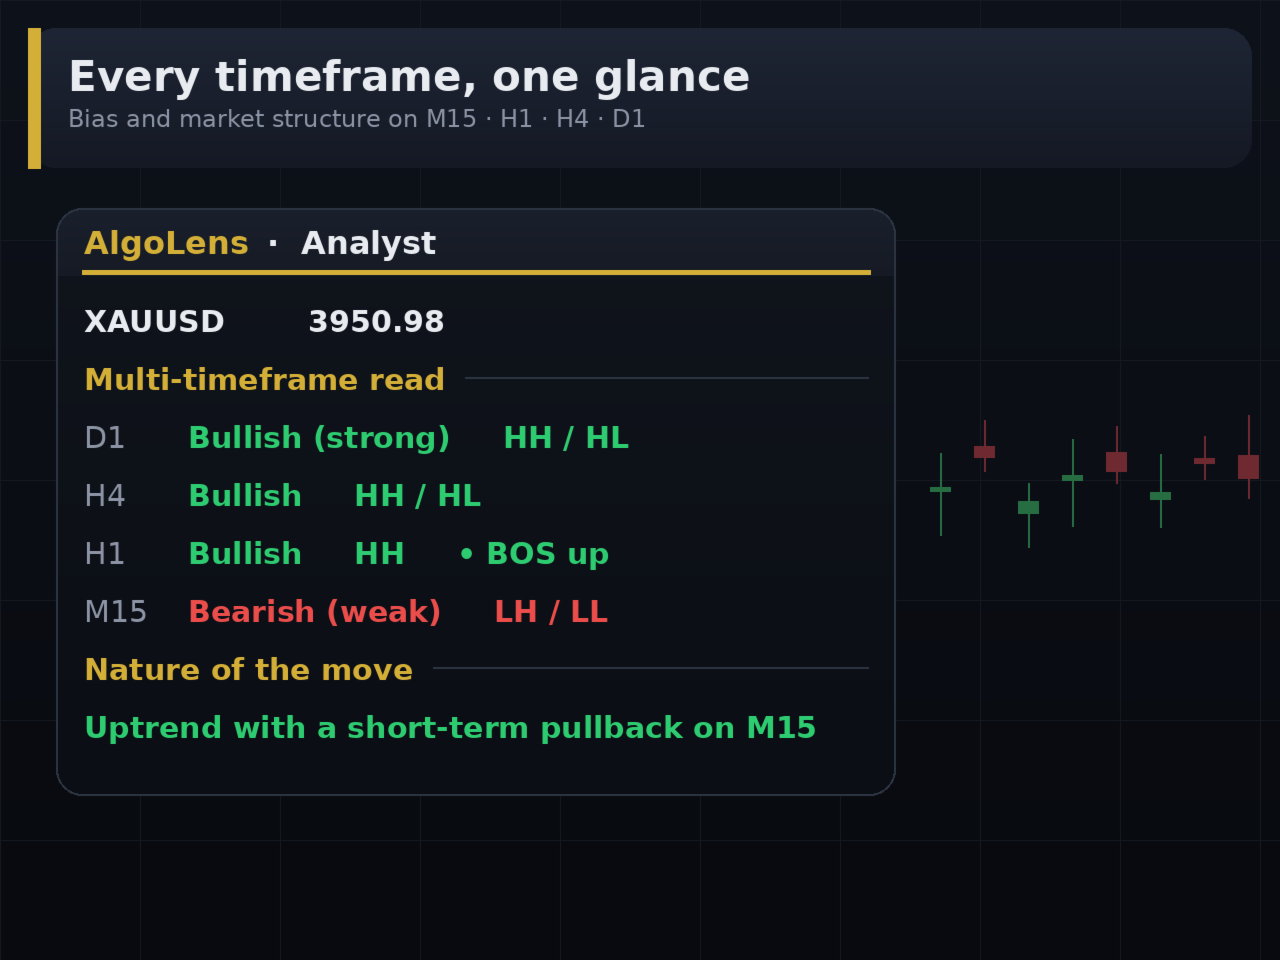
- Multi-timeframe read: trend and market structure on each timeframe, side by side (M15, H1, H4, D1).
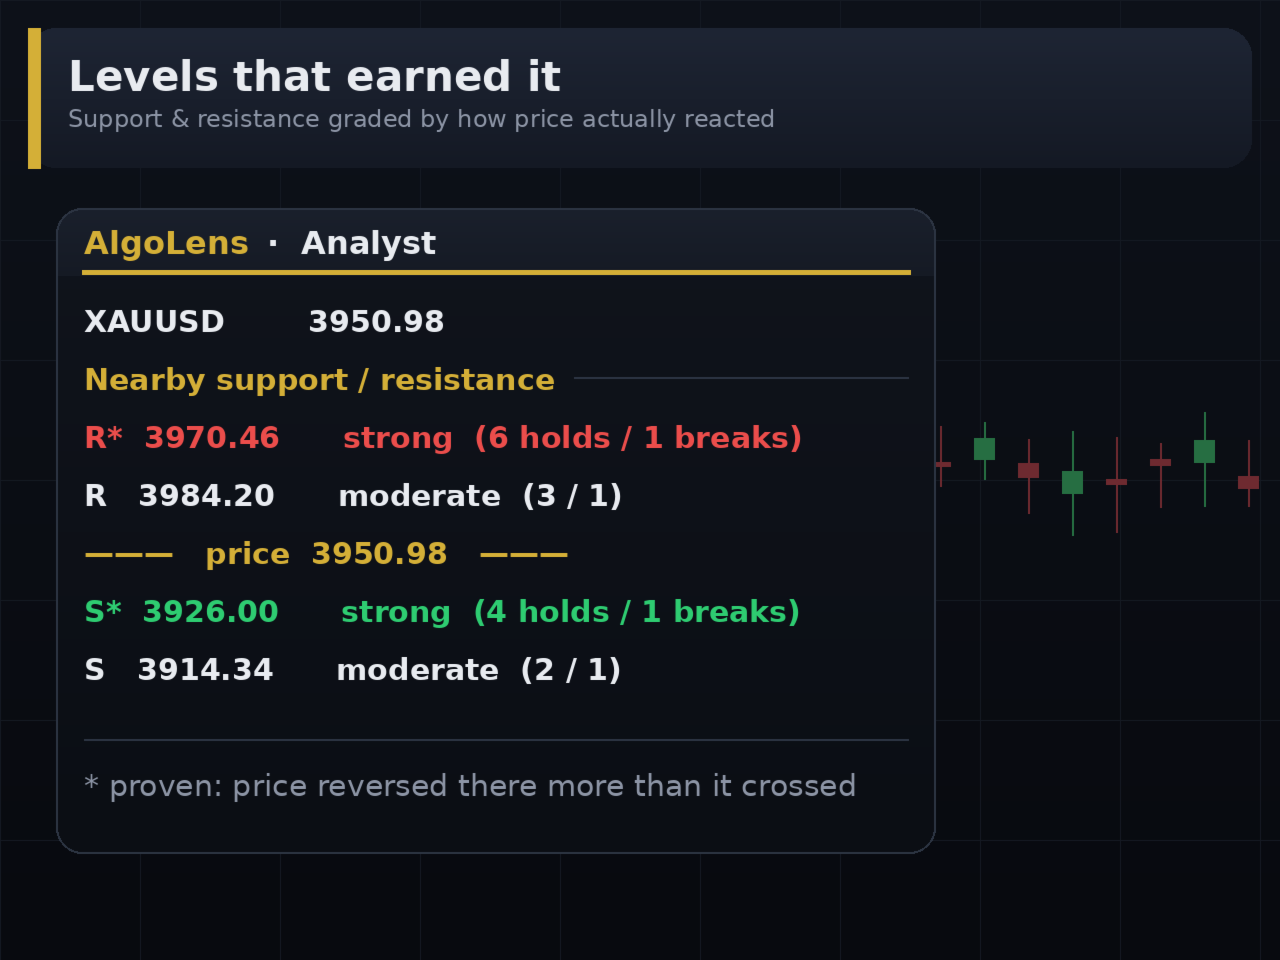
- Nearby support and resistance: the closest levels above and below price, graded by how price has actually reacted at them.
- Nature of the current move: trend, pullback, or range.
- Polished, movable and resizable panel; dark or light theme.
- Works on any symbol (forex, metals, indices, crypto) and any timeframe.
This free edition focuses on the core read. Its analysis is intentionally streamlined — it is a taste of the full engine, ideal for getting familiar with the panel and the AlgoLens style.
WANT THE DEEP ANALYSIS? — AlgoLens Analyst Pro
For wider and deeper market analysis, upgrade to AlgoLens Analyst Pro, which adds:
- A deep market map: liquidity pools, order blocks, fair-value gaps, and liquidity sweeps.
- A reversal-zone radar with confluence scoring (where price is likely to turn, and why).
- A unified suggested-trades panel that weighs every engine and shows the single strongest read, with entry, stop and target context.
- Premium / discount, candle-by-candle reading, and more.
(AlgoLens Analyst Pro is a separate paid product.)
HONEST BY DESIGN
Both editions are ANALYSIS and visualization tools. They do NOT open or manage trades, do NOT send buy/sell orders, and make NO promise of profit. Past behavior of a level or a trend does not guarantee future results. Always use your own risk management.
Questions or feedback? Leave a comment — we read every one and keep improving the tool.