CurrencyStrength 8 Currencies RSI Ranking MT5

  • Indicatori
  • Naoto Shimoda
    Naoto Shimoda
    • MetaTrader 4/5 Indicator & EA Developer al  FX.Hamrat
    • Giappone
    • 666
    FX.Hamrat - MetaTrader 4/5 indicator and Expert Advisor developer based in Japan.
    Over 10 years of trading experience (discretionary and systematic), and 90+ MT4/MT5 programs built so far - including 30+ custom-made projects for individual traders.
  • Versione: 5.3
  • Attivazioni: 10

Which currency is strong right now — in one panel.

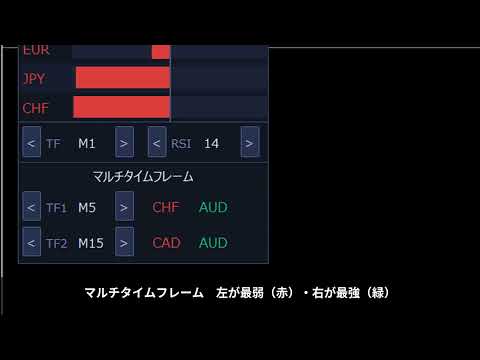
CurrencyStrength takes the RSI of the 28 pairs of USD, EUR, JPY, GBP, AUD, CHF, CAD and NZD, turns it into a score from −100 to +100 for each currency, and shows them as bars, strongest first.

Features

  • Strength ranking: strong currencies in green, weak ones in red, scored from −100 to +100.
  • Automatic symbol detection: the pairs are found from each symbol's base and profit currency, so suffixes and prefixes (EURUSD#, EURUSD.pro, m.EURUSD, EURUSDmicro ...) need no settings. When a pair exists twice, the one named like the chart symbol is used.
  • Panel buttons: change the timeframe (M1 to MN) and the RSI period on the panel.
  • Multi-timeframe: up to two extra timeframes, each showing its strongest and weakest currency.
  • Agreement frame: when all timeframes agree, the strongest gets a gold frame and the weakest a red one.
  • Notifications: alert, e-mail and push when the strongest or weakest changes, or when all timeframes agree (the same kind at most once per 300 seconds, adjustable).
  • Movable panel: drag the title to move it, click it to fold. Position and panel settings are remembered per chart.
  • Your own currency list: 2 to 12 currencies, including gold, silver and crypto — add XAU, XAG, BTC, ETH (or GOLD, SILVER at some brokers). With only one pair (usually vs USD) the value is marked as reference.
  • Same value any time: the EMA smoothing is calculated over past bars, so the values do not depend on when you attached the indicator.
  • Light: recalculates only when a new bar opens (every second when "current bar" is selected), and redraws only what changed.

How it is calculated

RSI (0–100) → (RSI − 50) / 50, added to the base currency and subtracted from the quote currency, averaged per currency, smoothed with an EMA, then scaled so that the strongest currency is +100 and the weakest −100. By default the last closed bar is used.

Inputs (main)

  • RSI period, smoothing (EMA), bar used, timeframe, extra timeframes 1 and 2, currency list
  • Notifications on/off, kinds (change / agreement), alert, e-mail, push, interval
  • Colors, transparent background, font size, panel position

In the Strategy Tester

The ranking and the panel work when the tester has the history of the other pairs. Notifications are written to the log only.

This indicator shows the relative strength of currencies. It does not trade, does not give investment advice and does not promise any results.
Altri dall’autore
See the Dow Theory direction of six timeframes in one panel. DowgatorPro2 judges the current trend direction (up or down) automatically by Dow Theory, using closed bars only. It carries over the features of the earlier e-DowgatorPro and puts first that even a beginner can read the direction without confusion. The direction of six timeframes (M1 to D1) is shown on the panel in color. Features Check direction mismatch: see on the panel whether your chart's timeframe agrees with the higher timefram
The levels of higher timeframes, on the chart you are watching. LineTraderPro2 finds swing highs and lows with Dow Theory rules and draws horizontal lines at the levels the market watches, for any of 20 timeframes from M1 to W1. Each line is labeled with its timeframe (H1, D1 and so on) and the date of the swing, so you can see at a glance which timeframe a level belongs to without switching charts. What you see on the chart Horizontal lines: the swing highs above the price and the swing lows be
See the market's fear level on the chart you trade. VixChecker shows the VIX (the volatility index often called the fear index) in a sub-window as one bar per day, colored by level: normal (blue), caution (yellow, 20 or above by default) and fear (red, 30 or above). The current value, the change from the previous close and the time of the value are shown in a small panel, and the value can also be shown on the main chart. Where the VIX values come from (please read before buying) The indicator d
Round numbers on your chart, and a notice when the price gets close. RoundNumberAlert draws horizontal lines at round numbers (150.000, 150.500 ...) and watches them for you. When the price enters the touch range, only that line blinks and you get one notification. Major round numbers stand out in gold, and a small panel shows how many pips are left to the next round number above and below. Features Round-number lines: the step starts at 10 pips (for example 50 pips: 150.000, 150.500 ...). Major
Entry signals as finger marks: yellow for trend-following, pink for counter-trend. SignRAMB combines RSI, ATR, MACD, a moving average, Dow theory and the candles, and marks the places where the price may turn up or down, based on past chart patterns. A finger pointing up is a buy, pointing down is a sell. Signals are decided on closed bars and never repaint. Signals are not always right. Use them as one indicator, together with your own reading of the chart. They are meant for the move right aft
Which currency is strong right now — in one panel. CurrencyStrength takes the RSI of the 28 pairs of USD, EUR, JPY, GBP, AUD, CHF, CAD and NZD, turns it into a score from −100 to +100 for each currency, and shows them as bars, strongest first. Features Strength ranking: strong currencies in green, weak ones in red, scored from −100 to +100. Automatic symbol detection: the pairs are found from each symbol's base and profit currency, so suffixes and prefixes (EURUSD#, EURUSD.pro, m.EURUSD, EURUSDm
See the Dow Theory direction of six timeframes in one panel. DowgatorPro2 judges the current trend direction (up or down) automatically by Dow Theory, using closed bars only. It carries over the features of the earlier e-DowgatorPro and puts first that even a beginner can read the direction without confusion. The direction of six timeframes (M1 to D1) is shown on the panel in color. Features Check direction mismatch: see on the panel whether your chart's timeframe agrees with the higher timefram
The levels of higher timeframes, on the chart you are watching. LineTraderPro2 finds swing highs and lows with Dow Theory rules and draws horizontal lines at the levels the market watches, for any of 20 timeframes from M1 to W1. Each line is labeled with its timeframe (H1, D1 and so on) and the date of the swing, so you can see at a glance which timeframe a level belongs to without switching charts. What you see on the chart Horizontal lines: the swing highs above the price and the swing lows be
Know exactly how long until the next release, and what came out. EconomicStopper shows the time to each economic release as a countdown, lists the upcoming events with their importance, and shows the actual value and the surprise against the forecast after the release. Everything is in one panel on the chart. It reads the economic calendar built into MetaTrader 5, so it needs no DLL and no web requests. How it behaves over time More than 5 minutes before: the timer counts down every second and t
See the market's fear level on the chart you trade. VixChecker shows the VIX (the volatility index often called the fear index) in a sub-window as one bar per day, colored by level: normal (blue), caution (yellow, 20 or above by default) and fear (red, 30 or above). The current value, the change from the previous close and the time of the value are shown in a small panel, and the value can also be shown on the main chart. Where the VIX values come from (please read before buying) The indicator d
Round numbers on your chart, and a notice when the price gets close. RoundNumberAlert draws horizontal lines at round numbers (150.000, 150.500 ...) and watches them for you. When the price enters the touch range, only that line blinks and you get one notification. Major round numbers stand out in gold, and a small panel shows how many pips are left to the next round number above and below. Features Round-number lines: the step starts at 10 pips (for example 50 pips: 150.000, 150.500 ...). Major
Entry signals as finger marks: yellow for trend-following, pink for counter-trend. SignRAMB combines RSI, ATR, MACD, a moving average, Dow theory and the candles, and marks the places where the price may turn up or down, based on past chart patterns. A finger pointing up is a buy, pointing down is a sell. Signals are decided on closed bars and never repaint. Signals are not always right. Use them as one indicator, together with your own reading of the chart. They are meant for the move right aft
Filtro:
Nessuna recensione
Rispondi alla recensione