GGT Index Reversion
- Experts
- Versione: 1.3

GGT Index Reversion — a published dip-buying rule for US500 / USTEC (free beta)
What it does
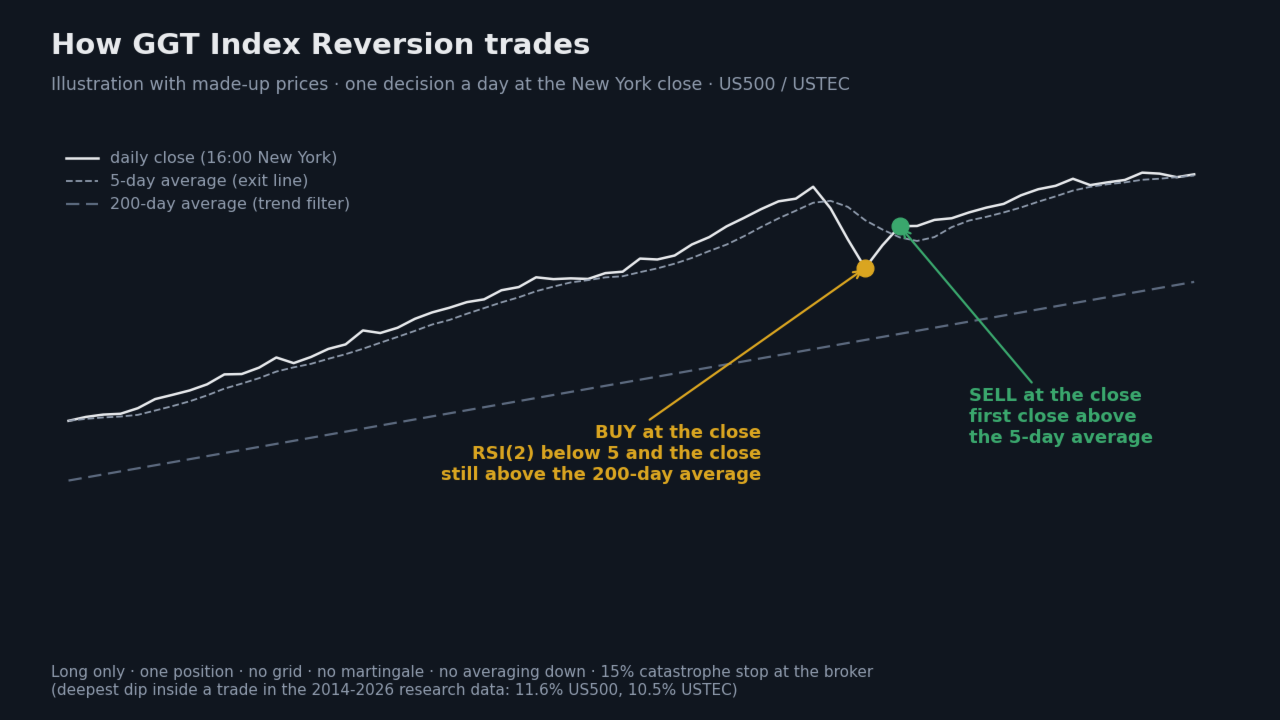
- Once a day, two minutes before the New York stock market closes (16:00 New York), it looks at the S&P 500 or Nasdaq 100 CFD.
- BUY when the 2-period RSI is below 5 and the price is above its 200-day average: a sharp short-term dip inside an uptrend.
- SELL at the first close above the 5-day average. A trade lasts about 3 trading days on average; most of the time the EA is out of the market.
- Long only. One position. No grid, no martingale, no averaging down, no recovery.
- Every order is sent with a catastrophe stop 15% below the entry. It is a safety net, not part of the tested rule: the deepest dip inside a trade in the 2014-2026 research data was 11.6% (US500) and 10.5% (USTEC).
- No DLL, no internet, nothing to download. The on-chart dashboard shows the RSI, both averages, today's decision time and the position.
Where the rule comes from
The 2-period RSI pullback rule was published by Larry Connors and Cesar Alvarez in 2008. We use the published values (RSI 2 below 5, 200-day trend filter, exit above the 5-day average), wrote them down before we tested anything, and did not tune them afterwards.
Read this before you look at any number
- Few trades: about 5 a year per index. At the default size the yearly result is small. This is a calm system, not a fast one.
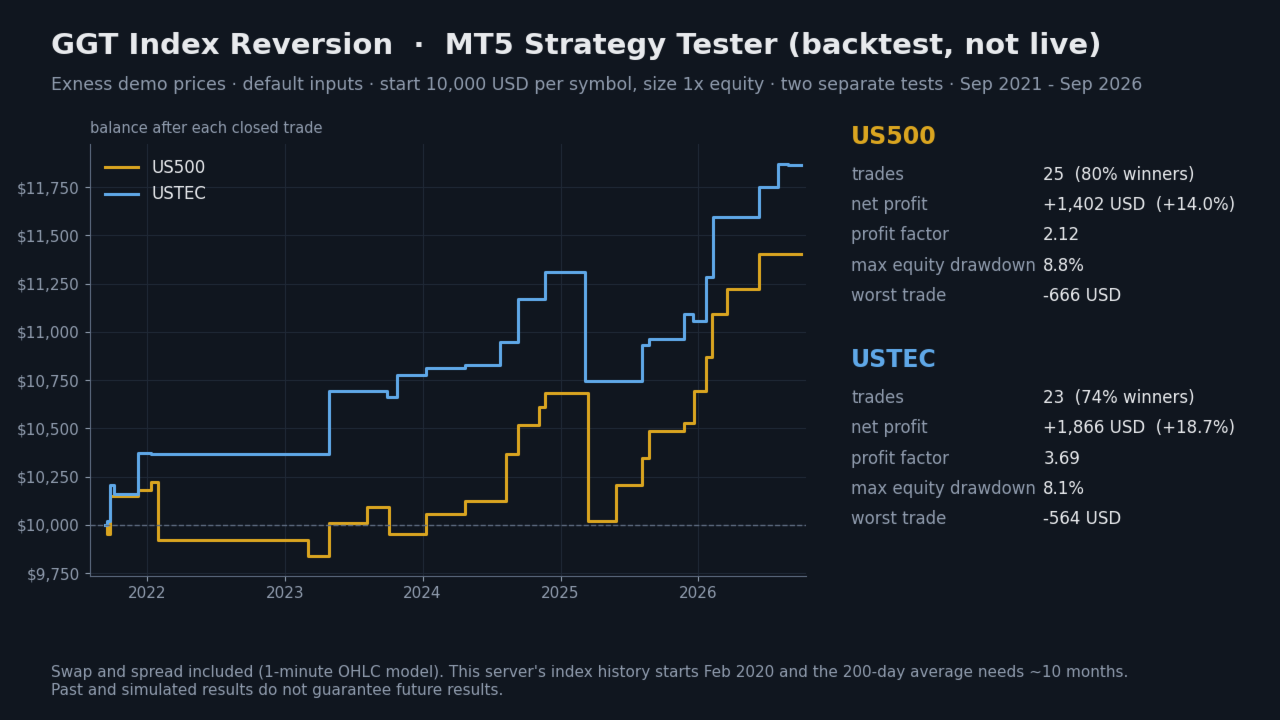
- The tested rule has no stop-loss. A trade can stay negative for a week or more. Worst trade in the MT5 test: -666 USD, -6.2% of the account (US500, Feb-Mar 2025: price -5.75% plus 18 nights of swap).
- All results below are backtests. This is a beta: run it on a demo account first.
Strategy Tester results (backtest, not live trading), Sep 2021 - Sep 2026
Exness demo prices, 1-minute OHLC, default inputs, 10,000 USD start, size 1x equity, swap and spread included. This server's index history starts in Feb 2020 and the 200-day average needs about 10 months.
| Symbol | Trades | Winners | Net profit | Profit factor | Max equity drawdown |
|---|---|---|---|---|---|
| US500 | 25 | 80% | +1,402 USD (+14.0%) | 2.12 | 8.8% |
| USTEC | 23 | 74% | +1,866 USD (+18.7%) | 3.69 | 8.1% |
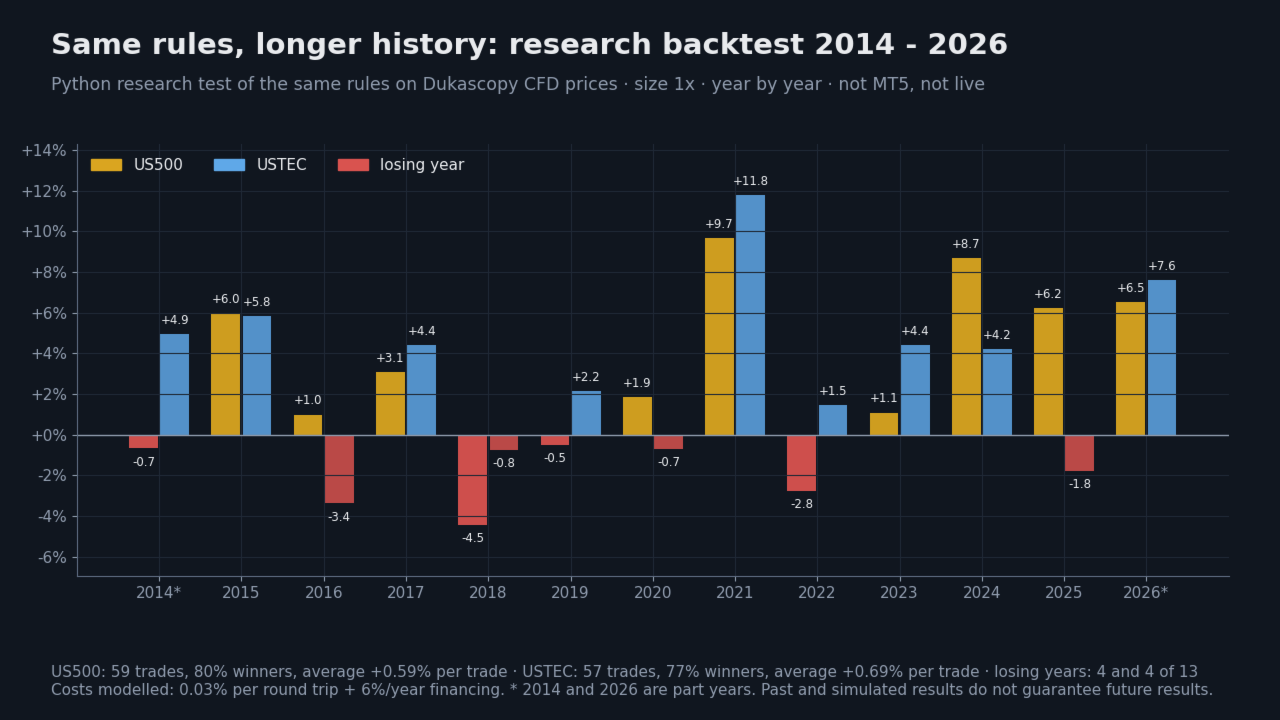
Longer history: research backtest 2014 - 2026 (Python, not MT5)
The same rule on Dukascopy CFD prices, costs modelled: 0.03% per round trip + 6% a year financing. Size 1x.
- US500: 59 trades, 80% winners, average +0.59% per trade.
- USTEC: 57 trades, 77% winners, average +0.69% per trade.
- 4 losing years out of 13 for each index.
| Year | US500 | USTEC |
|---|---|---|
| 2014 (part) | -0.7% | +4.9% |
| 2015 | +6.0% | +5.8% |
| 2016 | +1.0% | -3.4% |
| 2017 | +3.1% | +4.4% |
| 2018 | -4.5% | -0.8% |
| 2019 | -0.5% | +2.2% |
| 2020 | +1.9% | -0.7% |
| 2021 | +9.7% | +11.8% |
| 2022 | -2.8% | +1.5% |
| 2023 | +1.1% | +4.4% |
| 2024 | +8.7% | +4.2% |
| 2025 | +6.2% | -1.8% |
| 2026 (to Sep) | +6.5% | +7.6% |
Position size
- Size = account equity x "Position size" (default 1.0) / value of 1 lot. 1.0 means the position is worth about your equity: no extra leverage.
- If the broker's minimum lot is at most 2x the planned size, the EA uses the minimum lot; if it is larger, the trade is skipped and the reason is shown on the dashboard.
- 2x or 3x size doubles or triples both the gains and the dips.
Requirements
- Symbol: the S&P 500 or Nasdaq 100 CFD (US500, USTEC, US500Cash, NAS100, ...). One chart per index; H1 recommended.
- The terminal must be running at the New York close: use a VPS.
- Hedging or netting account. Long index CFDs pay a daily swap, so check your broker's swap before you run it live.
- Server time: "Auto" (default) reads the terminal clock when live. In the Strategy Tester it recognises Exness (GMT+0) and otherwise reads the Sunday re-open from the price history. For an unusual broker clock, choose "New York close (GMT+2/+3)" or "Fixed GMT offset".
Inputs
- Strategy: RSI period (2), RSI buy level (5), trend average days (200), exit average days (5). These are the published values; keep them.
- Execution: decide minutes before the close (2), retry window after the close (10 min), server time mode, fixed GMT offset, max spread % (0.05).
- Money: position size x equity (1.0), max lot (0 = none), catastrophe stop % (15, 0 = off).
- Dashboard: corner, position, fonts, buttons, journal copy of the dashboard.
- Identity: magic number, order comment, research log.
This is a free beta: please report problems in the comments.
Trading involves risk of loss. Past and simulated results do not guarantee future results.