Ospe Dual MACD Buy Sell Signal
- Indicatori
- Versione: 1.20

Two EMA-difference histograms with confirmed crossover labels and historical BUY and SELL boxes.
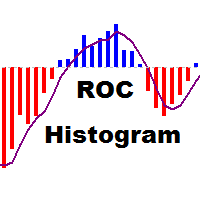
Ospe Dual MACD plots two MACD-style EMA differences in one separate window: a 12/26 pair and a 5/13 pair by default. It displays colored histograms and matching lines. The color of each histogram changes with its position relative to zero and its movement from the preceding bar.
When the faster difference crosses above the slower difference on a completed candle, the indicator places a green BUY box below that candle. A cross below places a red SELL box above it. Historical boxes are drawn for the selected number of closed candles. The current, incomplete candle does not produce a signal box. Optional pop-up alerts report new confirmed signals after the initial load.
The indicator is visual and does not place, modify, or close trades. The lines are EMA differences; there is no separate smoothed MACD signal line. A crossover is a market observation, not a profit forecast.
Inputs:
Slow pair fast EMA: default 12.
Slow pair slow EMA: default 26.
Fast pair fast EMA: default 5.
Fast pair slow EMA: default 13.
Show signals: show green BUY and red SELL boxes on the price chart.
Signal history bars: number of completed bars to label, default 300; set to 0 to hide boxes.
Popup alerts: notify once when a new completed candle confirms a crossover, default off.
How to use:
Attach the indicator to any MT5 symbol and timeframe. The histogram window shows the two EMA differences. The chart shows closed-candle crossover boxes when Show signals is enabled. Experiment with EMA settings and timeframe in the Strategy Tester visual mode before using the information in a trading plan.
Requirements:
MetaTrader 5; no external indicators, files, DLLs, broker restriction, account lock, or internet access required.