Multi Level Trade Setup Scanner Pro
- Indicatori
- Versione: 2.1
- Aggiornato: 8 ottobre 2026
- Attivazioni: 20

Multi-Levels Trade Setup Scanner Pro - Professional User Guide
The Philosophy Behind This Indicator
This is not just another MT5 indicator that paints pretty colors on your chart and tells you what already happened. This is a systematic market structure analysis engine that does the heavy lifting of multi-timeframe analysis across your entire watchlist, so you don't have to spend hours flipping between pairs and timeframes trying to spot the same setups manually.
The indicator is built around a core truth that professional traders understand: liquidity drives price. Markets don't move because of patterns or indicators - they move because institutional orders need to be filled. The smart money leaves footprints, and this indicator is designed to detect those footprints across three different but complementary strategies, then rank the resulting trade opportunities by their confluence and reward-to-risk ratio.
What This Indicator Actually Does
Let me be clear about what happens when you click that "SCAN MARKET" button. Behind the scenes, the indicator is doing the following:
The Higher Timeframe Analysis (H1)
For every single symbol in your Market Watch, the indicator pulls H1 data and identifies the Buy-side Liquidity (BSL) and Sell-side Liquidity (SSL) levels. These are simply the highest high and lowest low over a lookback period you control (default 50 bars). These levels represent where resting buy and sell orders are clustered - the areas that price is likely to sweep before reversing.
The indicator then checks the most recent closed H1 bars (default 5 bars) to see if price has wicked through either of these liquidity levels and closed back inside the range. When this happens, you get an "HTF Active Signal" - the market has just shown you where the liquidity hunt happened.
This is important to understand: The indicator doesn't predict where liquidity will be swept. It tells you after it has been swept, which is actually far more reliable because you're trading a reaction to confirmed price action rather than guessing where price might go.
The Lower Timeframe Confirmation (M5)
Once an H1 liquidity sweep is detected, the indicator drops down to the M5 timeframe and looks for the confirmation sequence that separates winning trades from losing ones:
1. Structure Break (CHoCH) - After the sweep, price must break a minor swing point in the direction opposite the sweep. This shows that momentum has shifted.
2. Fair Value Gap Formation - The impulsive move that breaks structure creates an FVG (also known as an "imbalance"). This is where price moved so fast that fair value hasn't been re-established.
3. Price Retracement into the FVG - The setup becomes "ready" only when price pulls back into that FVG. This gives you a clear entry zone with defined risk.
The combination of these three elements - liquidity sweep, structure break, and FVG retracement - creates a high-probability trade setup with a clear entry, stop loss, and take profit level.
The Three Strategies Explained
The indicator actually runs three separate but related strategies simultaneously. Understanding each one helps you appreciate why the "confluence" ranking system matters.
Strategy 1: HTF Direction + HTF FVG + Pullback
This strategy starts by determining the overall H1 trend using a fast/slow EMA cross (default 20/50 periods). It then looks for an H1 FVG in that trend direction. Once price has pulled back into that H1 FVG, the strategy watches for a sweep of a minor M5 swing point to trigger the entry.
Think of this as the "trend pullback" strategy - you're trading with the higher timeframe trend but entering on a lower timeframe liquidity sweep. The H1 FVG acts as a magnet, and you're looking for price to kiss that magnet before continuing.
Strategy 2: HTF Liquidity Sweep → LTF CHoCH + FVG
This is the baseline strategy described above. It's the most straightforward and relies purely on the liquidity sweep concept. The H1 identifies the sweep, the M5 confirms it with a structure break and FVG, and you get a ready signal when price retraces.
This strategy works well in all market conditions because it doesn't require a trend - it just requires that institutional liquidity has been swept and the market is reacting as expected.
Strategy 3: Single-Timeframe Equal Highs/Lows
This strategy operates entirely on the M5 timeframe. It looks for "equal" swing highs or swing lows (within a tolerance you define) - these are mini liquidity pools that retail traders might not notice but that institutional algos absolutely will.
When price sweeps one of these equal levels, the strategy looks for an FVG formed by the resulting impulse move. This is the "local liquidity" strategy that catches smaller but often faster-moving setups.
Why Confluence Matters
Here's where the indicator really shines. A setup from a single strategy is good. A setup where two strategies agree is better. A setup where all three strategies point in the same direction is the holy grail.
The indicator calculates a "confluence score" for every signal - how many of the three strategies agree on the direction. When you see a signal with "[S1+S2+S3]" next to it, you're looking at a setup where all three independent methods of analysis are pointing to the same trade. This dramatically increases the probability of success because you're not relying on a single approach that might be flawed in current market conditions.
The signals are ranked first by confluence, then by reward-to-risk ratio. A 2/3 or 3/3 confirmed setup will always outrank a lone 1/3 setup, regardless of how good the RR might appear. This is intentional - we want you taking the highest-probability setups, not chasing the highest potential payout with lower odds.
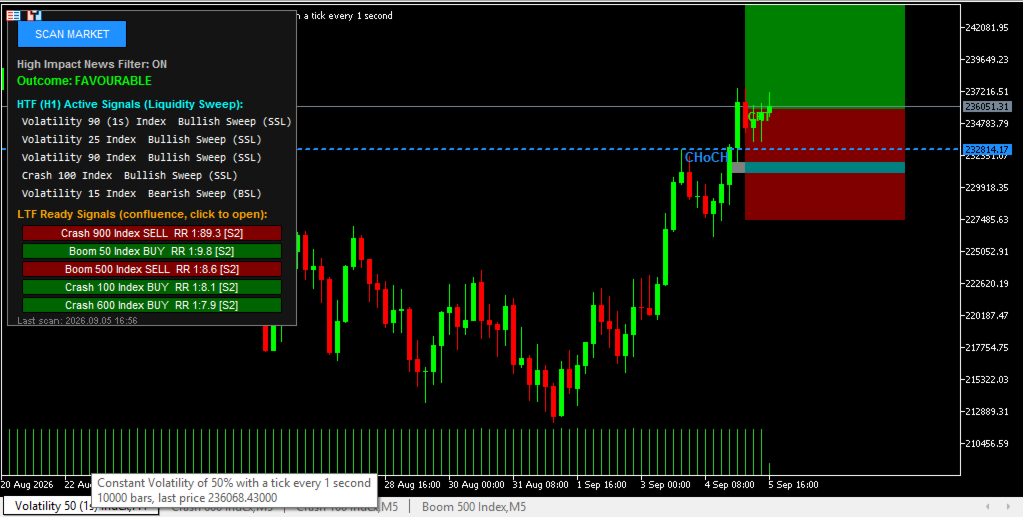
Reading the Dashboard
The dashboard is divided into two main sections:
HTF Active Signals (Top Section)
This list shows every symbol where an H1 liquidity sweep has been detected. The indicator doesn't filter these - it shows you all of them so you can see which pairs are "active" at the H1 level. This is useful for understanding broader market dynamics.
If you see a symbol here that isn't in the LTF Ready Signals list, it means the H1 sweep happened but the M5 confirmation hasn't completed yet. This doesn't mean the setup is invalid - it might just not be ready yet.
LTF Ready Signals (Bottom Section - Clickable)
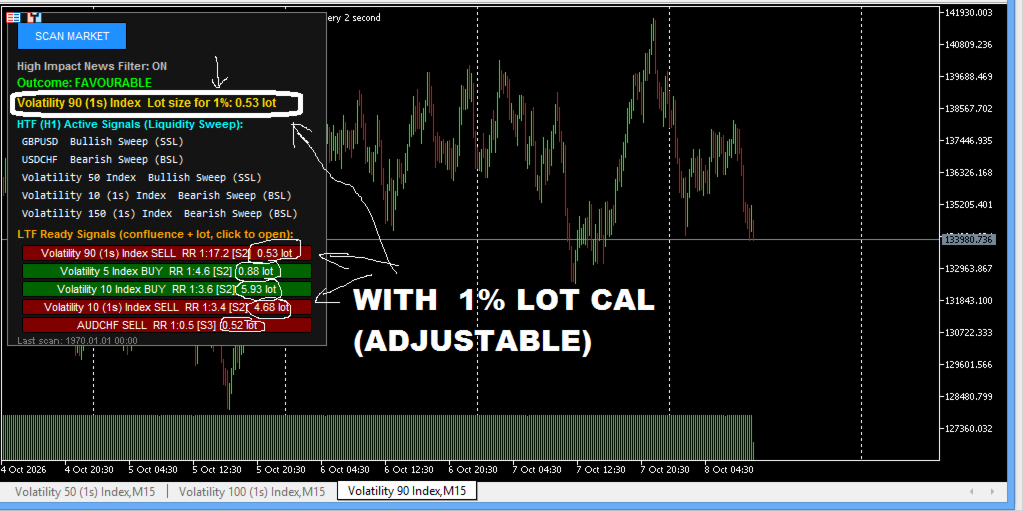
These are the setups you can actually trade right now. Each line shows:
· The symbol
· The direction (BUY or SELL)
· The reward-to-risk ratio
· Which strategies agreed on this setup (e.g., "[S2+S3]")
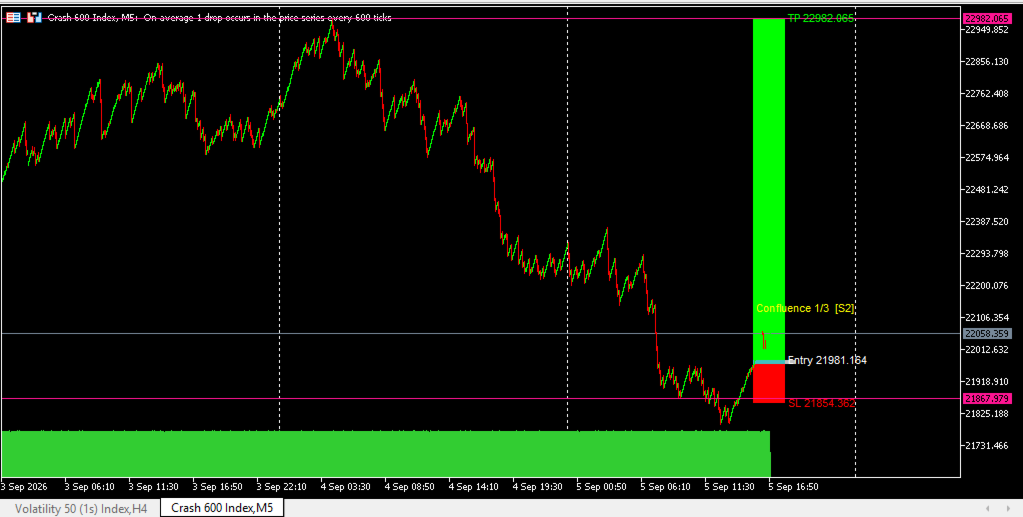
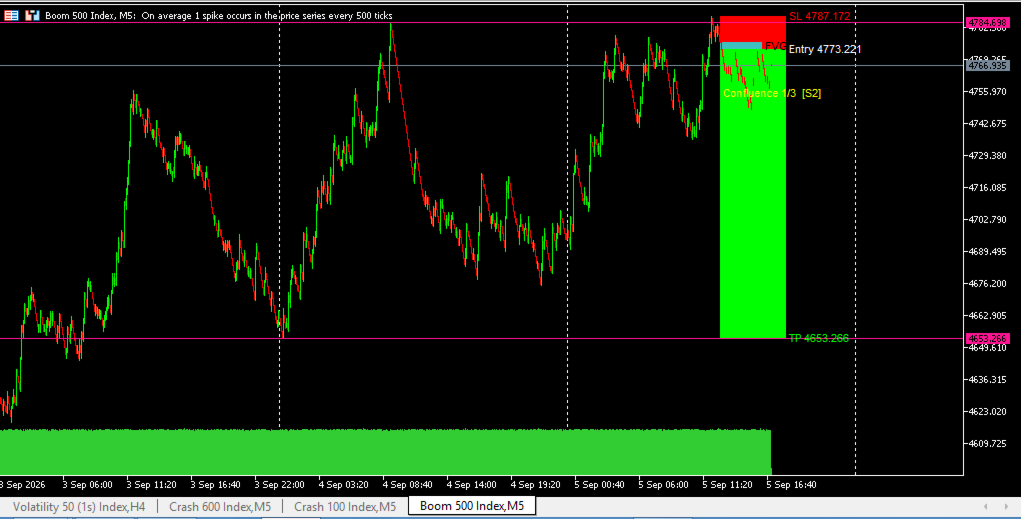
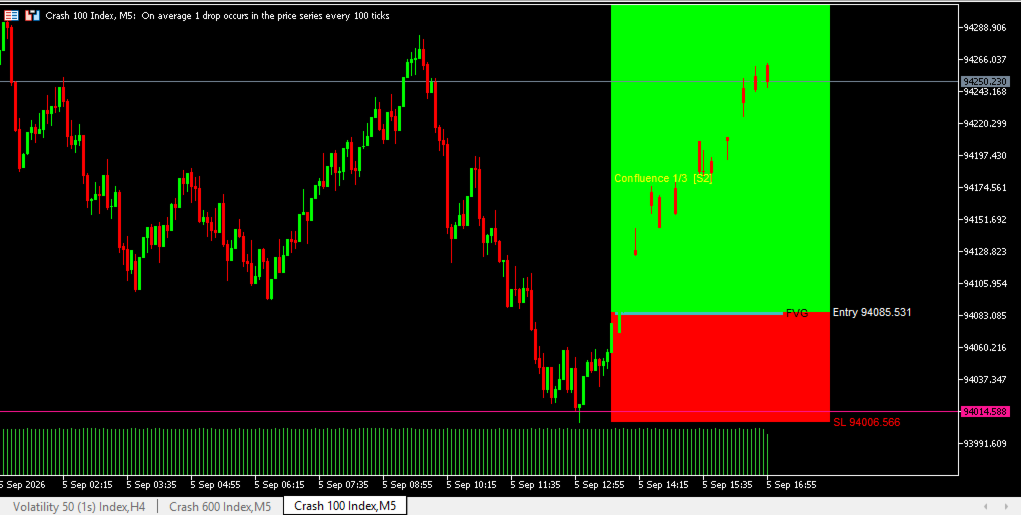
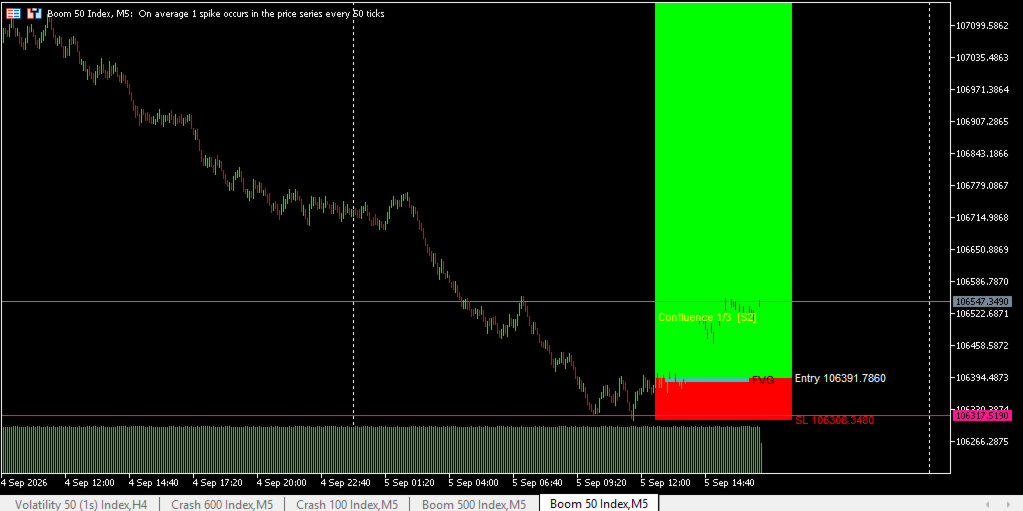
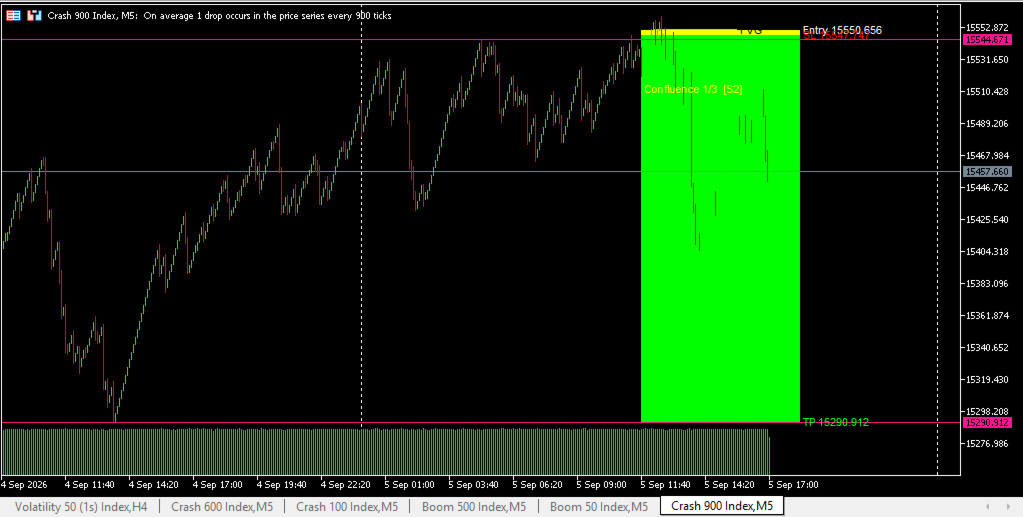
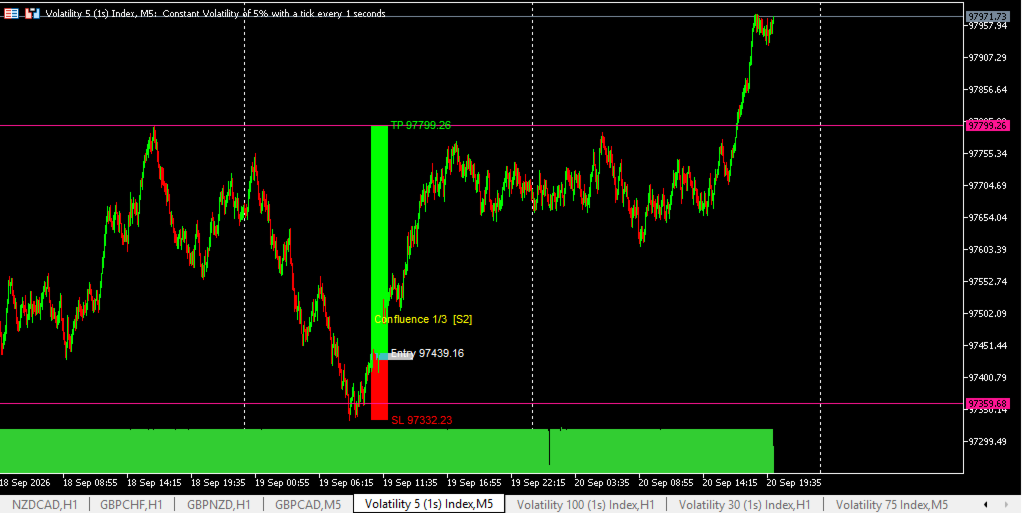
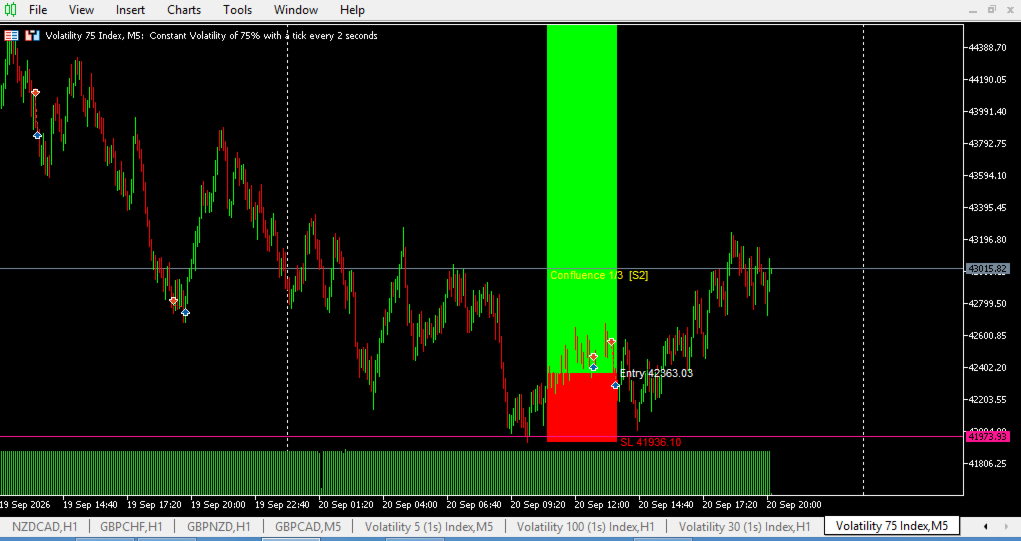
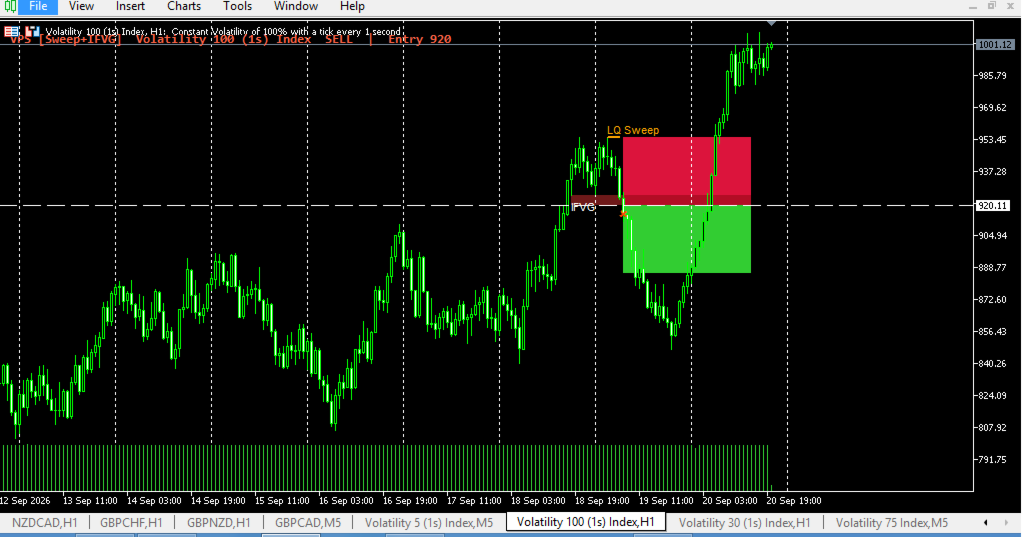
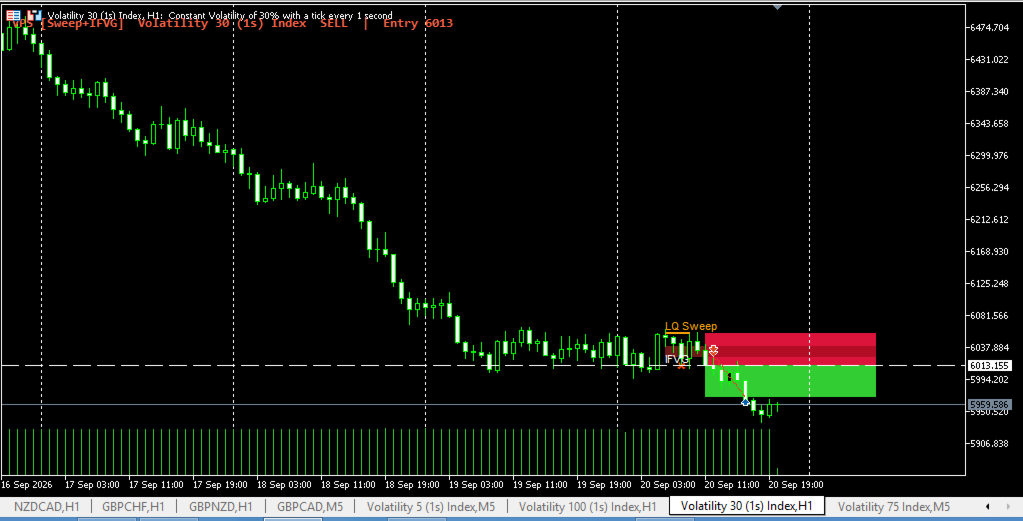
Click any of these buttons and the indicator will open a new M5 chart for that symbol with everything drawn automatically - the BSL/SSL levels, the FVG box, your entry line, stop loss, and take profit. The chart will also show which strategies contributed to the confluence.
The News Filter
High impact news events can obliterate even the most perfect technical setup. The indicator includes a news filter that checks for high-impact economic events involving either the base or quote currency of each pair.
When a high-impact event is within the buffer period (default 30 minutes before/after), the "Outcome" will show "NOT FAVOURABLE" in red. This is a hard filter - if you're using it, signals during these periods are suppressed. You can disable this if you prefer to trade news events, but I strongly recommend leaving it on unless you're specifically trading news.
Practical Usage Guidelines
When to Scan
The indicator doesn't run continuously by default. You control when it scans either by clicking the "SCAN MARKET" button or by enabling the auto-scan timer. I recommend using the auto-scan feature set to 300 seconds (5 minutes). This keeps the dashboard fresh without overwhelming your system.
Why not scan every tick? Because the setups are based on closed bars, not tick-by-tick price movement. Scanning every 5 minutes is more than sufficient to catch new setups as they form.
How to Use the Signals
When you see a signal on the dashboard, click it to open the M5 chart with all drawings. Here's how to interpret what you're seeing:
The Liquidity Lines (Pink)
· Buy-side Liquidity (BSL) - the upper line
· Sell-side Liquidity (SSL) - the lower line
These define the range that was swept. Price moving above BSL or below SSL triggered the initial signal. You'll notice the indicator draws these on your chart so you can see exactly where the liquidity was.
The Fair Value Gap (Silver Box)
This is your entry zone. The theory is that price will retrace into this gap before continuing in the direction of the setup. The indicator only triggers when price has actually touched the FVG, so you're not guessing about whether the retracement will happen - it has already begun.
The Trade Boxes
· Green box: Entry to Take Profit
· Red box: Entry to Stop Loss
The entry is set at the edge of the FVG (the discount/premium edge). The stop loss is placed beyond the sweep extreme plus a buffer (default 50 points). The take profit targets the opposite liquidity pool.
The Confluence Annotation
Yellow text on the chart shows which strategies agreed and the confluence score. This is your confidence indicator.
Optimal Timing
These setups work best when the higher timeframe (H1) is showing a clear directional bias. While Strategy 2 can work in ranging markets, Strategies 1 and 3 perform better when there's a clear H1 trend.
Avoid taking signals during:
· Major news events (use the filter)
· Low liquidity periods (Asian session for forex pairs)
· The first hour after the weekly open
· Just before major central bank announcements
Risk Management Suggestions
The indicator calculates RR for you, but risk management is personal. Here are some guidelines:
· Minimum RR: Only take setups with at least 1:2 reward-to-risk. The indicator will show you the RR - if it's below 2, consider whether the confluence justifies the lower ratio.
· Position Sizing: Use the SL distance (shown on the chart) to calculate your position size. The indicator doesn't do this for you - you need to determine the appropriate lot size based on your account size and risk tolerance.
· Confluence Filter: I suggest only taking signals with at least 2/3 confluence unless you're an experienced trader who understands the nuances of each individual strategy. The 3/3 signals are rare but when they appear, they deserve full attention.
· Correlation Awareness: If the indicator shows signals on multiple correlated pairs (e.g., EURUSD, GBPUSD), the setups are likely not independent. Take the best one rather than splitting your risk across correlated trades.
Invalidating a Setup
The indicator includes an invalidation check - if price closes back through the swept liquidity level (BSL for bullish setups, SSL for bearish ones), the setup is considered dead. This prevents you from taking trades where the market has reversed the original signal.
However, you should also manually invalidate a trade if:
· Price closes beyond the sweep extreme and doesn't immediately reverse
· The FVG is completely violated (price closes above the FVG for bullish, below for bearish)
· A higher timeframe resistance/support level is breached
The Debug Mode
If you enable debug mode, the indicator will log everything it's doing in the Experts tab. This is incredibly useful for understanding why a particular symbol isn't showing a signal or why a setup might be getting filtered out.
Common debug messages you might see:
· "insufficient H1 bars" - the symbol doesn't have enough historical data on your terminal
· "no minor structure point found yet" - the M5 confirmation hasn't completed
· "FVG too small" - the gap was less than your minimum point threshold
· "setup invalidated" - price closed back through the sweep extreme
Common Pitfalls to Avoid
Don't chase the signal. When a setup appears, it's already "ready" - price has already retraced into the FVG. The entry is defined. There's no need to rush. Place your order at the entry level and let the market come to you.
Don't ignore the confluence. A 1/3 signal with a 1:4 RR might look tempting, but the probability of success is lower. The indicator ranks by confluence for a reason.
Don't trade every signal. You'll see multiple signals across different pairs. Be selective. Pick the ones with the highest confluence and best RR that also align with your broader market view.
Don't override the filter. If you're using the news filter and it says "NOT FAVOURABLE", respect it. The 30-minute buffer is there because high-impact news can cause unpredictable volatility that invalidates even the best setups.
Don't ignore the chart drawings. When you click a signal and the M5 chart opens, take time to review what the indicator has drawn. Does the FVG look realistic? Is the entry at a reasonable level? The indicator is systematic but not infallible - use your judgment as well.
The Chart Display Controls
The indicator includes several visual preferences you can adjust:
· Bullish and bearish candle colors
· BSL/SSL line colors
· FVG box color
· TP/SL box colors
These are cosmetic - they don't affect the signal generation - but setting them to colors that work well with your chart background can make the setups much easier to read.
The indicator also automatically applies period separators for timeframes below H4 and disables the grid by default. This is to keep your charts clean and professional.
Final Thoughts
This indicator is a tool, not a holy grail. It combines three well-established trading methodologies into a single scanning engine and ranks the results by confluence and RR. The heavy lifting of multi-timeframe analysis is done for you, but you still need to exercise judgment and discipline.
The setups it generates are based on institutional footprint - liquidity sweeps, structure breaks, and fair value gaps. These are concepts that work because they reflect actual market mechanics rather than arbitrary indicator crossovers.
Use the dashboard as a filtering mechanism. Let it scan the market while you focus on analysis and decision-making. When a high-confluence setup appears, open the chart, confirm the levels look reasonable, and execute the trade with proper risk management.
That's the rhythm. Scan, filter, confirm, execute. The indicator handles the scanning and filtering. You handle the confirming and executing.
One final note: This indicator is designed to be attached to ANY timeframe chart. The scanning logic always uses H1 and M5 data regardless of what timeframe you're viewing. So feel free to attach it to your favorite H4 or Daily chart - the scanner will still work exactly the same way. The chart you attach it to is simply your "control panel" where the dashboard lives.
Now go scan the market and let the setups come to you.