TradePulseMonitor MT4 Pro
- Utilità
- Versione: 1.3
- Aggiornato: 30 ottobre 2026

TradePulseMonitor for MetaTrader 4 & 5
OVERVIEW
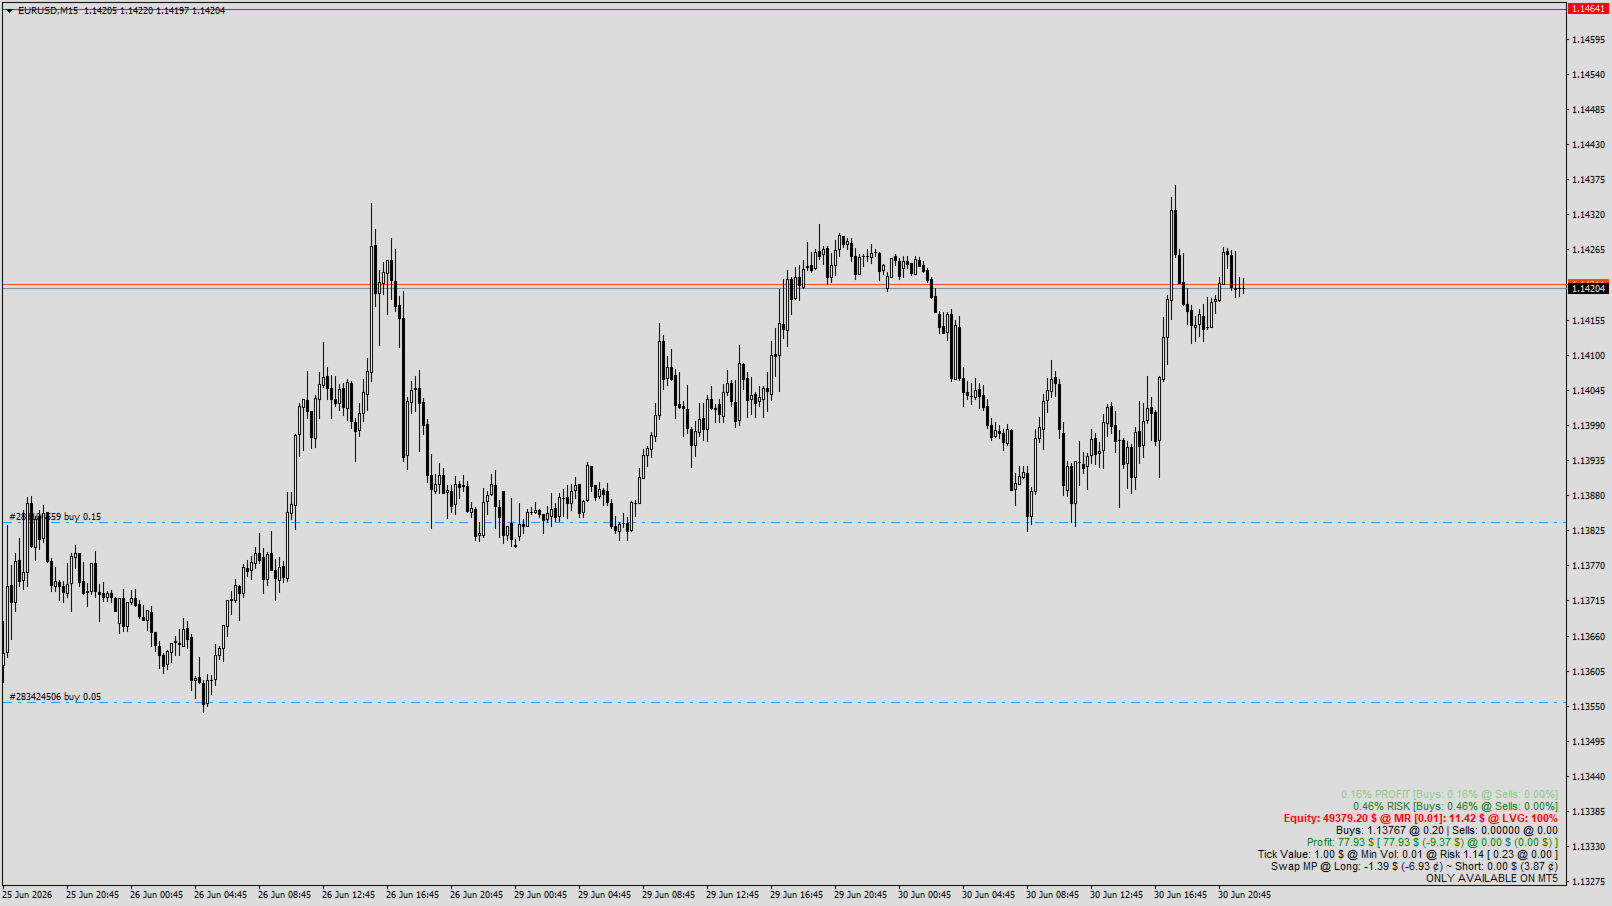
TradePulseMonitor is a real-time, on-chart dashboard that shows everything you need to know about your position on the current symbol: profit, risk, exposure, margin, swaps and historical performance. All data is consolidated in a compact panel in the lower-right corner of the chart, so you no longer need to keep switching to the Terminal window.
All position, profit and risk figures refer to the symbol of the chart the indicator is attached to. Percentages are calculated relative to your current account equity, and all monetary values are shown in your account currency.
DASHBOARD
- Current Price: the live Bid price, shown in large type with the symbol's precision.
- Profit %: overall floating profit of the symbol as a percentage of equity, broken down into Buys % and Sells %. Swaps and commissions are included.
- Risk %: margin-based exposure as a percentage of equity. Overall risk uses the net volume (|Buys − Sells|), so hedged positions offset each other; Buys % and Sells % are shown separately.
- Smart color alerts: the Profit % and Risk % lines change color progressively (from green to red) as values move away from neutral, switch to bold and blink once key thresholds are crossed (profit below −2% or above +4%, risk from 6%), so dangerous situations are impossible to miss.
- Equity & Margin: account equity (green when the account is in profit, red when in loss), the margin required (MR) for the minimum tradable volume, account leverage and, on MT5, the margin mode (Netting / Hedge / Exchange).
- Positions: average entry price and total volume for open Buy and Sell positions.
- Profit: floating profit in currency for the symbol, with the Buy and Sell breakdown and the swap + commission part of each side in brackets. Colored green/red according to the result.
- Tick Value & Risk Index: tick value in currency, minimum volume, and the Risk Index.
- Swap: swap calculation mode, the daily swap of your current Long and Short positions in currency, and the swap for the minimum volume in cents (¢).
- Historical Performance (MT5 only): closed-trade results for the symbol — Total (TP), Yearly (YP), Monthly (MP) and Daily (DP) profit, including commissions, fees and swaps.
HOW THE RISK INDEX WORKS
The Risk Index measures the notional exposure of a position in units of 100,000 of your account currency. On a EUR account, 1.00 lot of EURUSD has an index of about 1, which works as the reference baseline. Any other instrument (indices, metals, crypto, stocks, CFDs) is expressed on the same scale, so you can compare at a glance how much "EURUSD-equivalent" exposure one lot represents. The first value is the index for 1 lot; the values in brackets are the actual index of your open Buy and Sell positions.
DISPLAY MODES
- Advanced mode (default): all lines shown.
- Basic mode: a compact view with price, equity, positions, profit and historical performance.
HOTKEYS
All hotkeys work directly on the chart (keys pressed together with Shift are ignored, avoiding conflicts with other tools):
- 1 to 9 and 0: show/hide chart subwindows 1 to 10 (0 = subwindow 10). Hidden subwindows collapse to minimum height and are restored to the height you set in the inputs — ideal for decluttering charts with several oscillators.
- S: show/hide the dashboard.
- A: switch between Advanced and Basic mode.
- F: force an immediate refresh of all data.
- T: show/hide open trade levels on the chart.
- Z: show/hide closed trade history on the chart (MT5 only).
- U: deselect all objects on the chart.
SETTINGS
- Show Report: show the dashboard on start.
- Report update period (default M1) and History update period (default M15, MT5).
- Comments colour.
- Lot size for margin calculation (minimum 0.01, or the symbol's minimum volume if larger).
- Subwindow height in pixels for each of the 10 subwindows.
Your display settings (dashboard visibility, mode, trade levels, subwindow states) are saved per chart and restored automatically after timeframe changes, recompilation or terminal restart. Only one instance can run per chart.