Markov Regime
- Indicatori
-
Csongor Pall
 My Trading Journey
April 23, 2014 was the day I made my first deposit with a broker. Back then, I knew very little about trading — and even less about trading robots. - Versione: 1.1
Markov Regime — Bull / Bear / Sideways
Markov Regime is a lightweight market-state indicator that answers one question on any chart: what regime are we in, how persistent is it, and what is the long-run balance between Bull, Bear and Sideways?
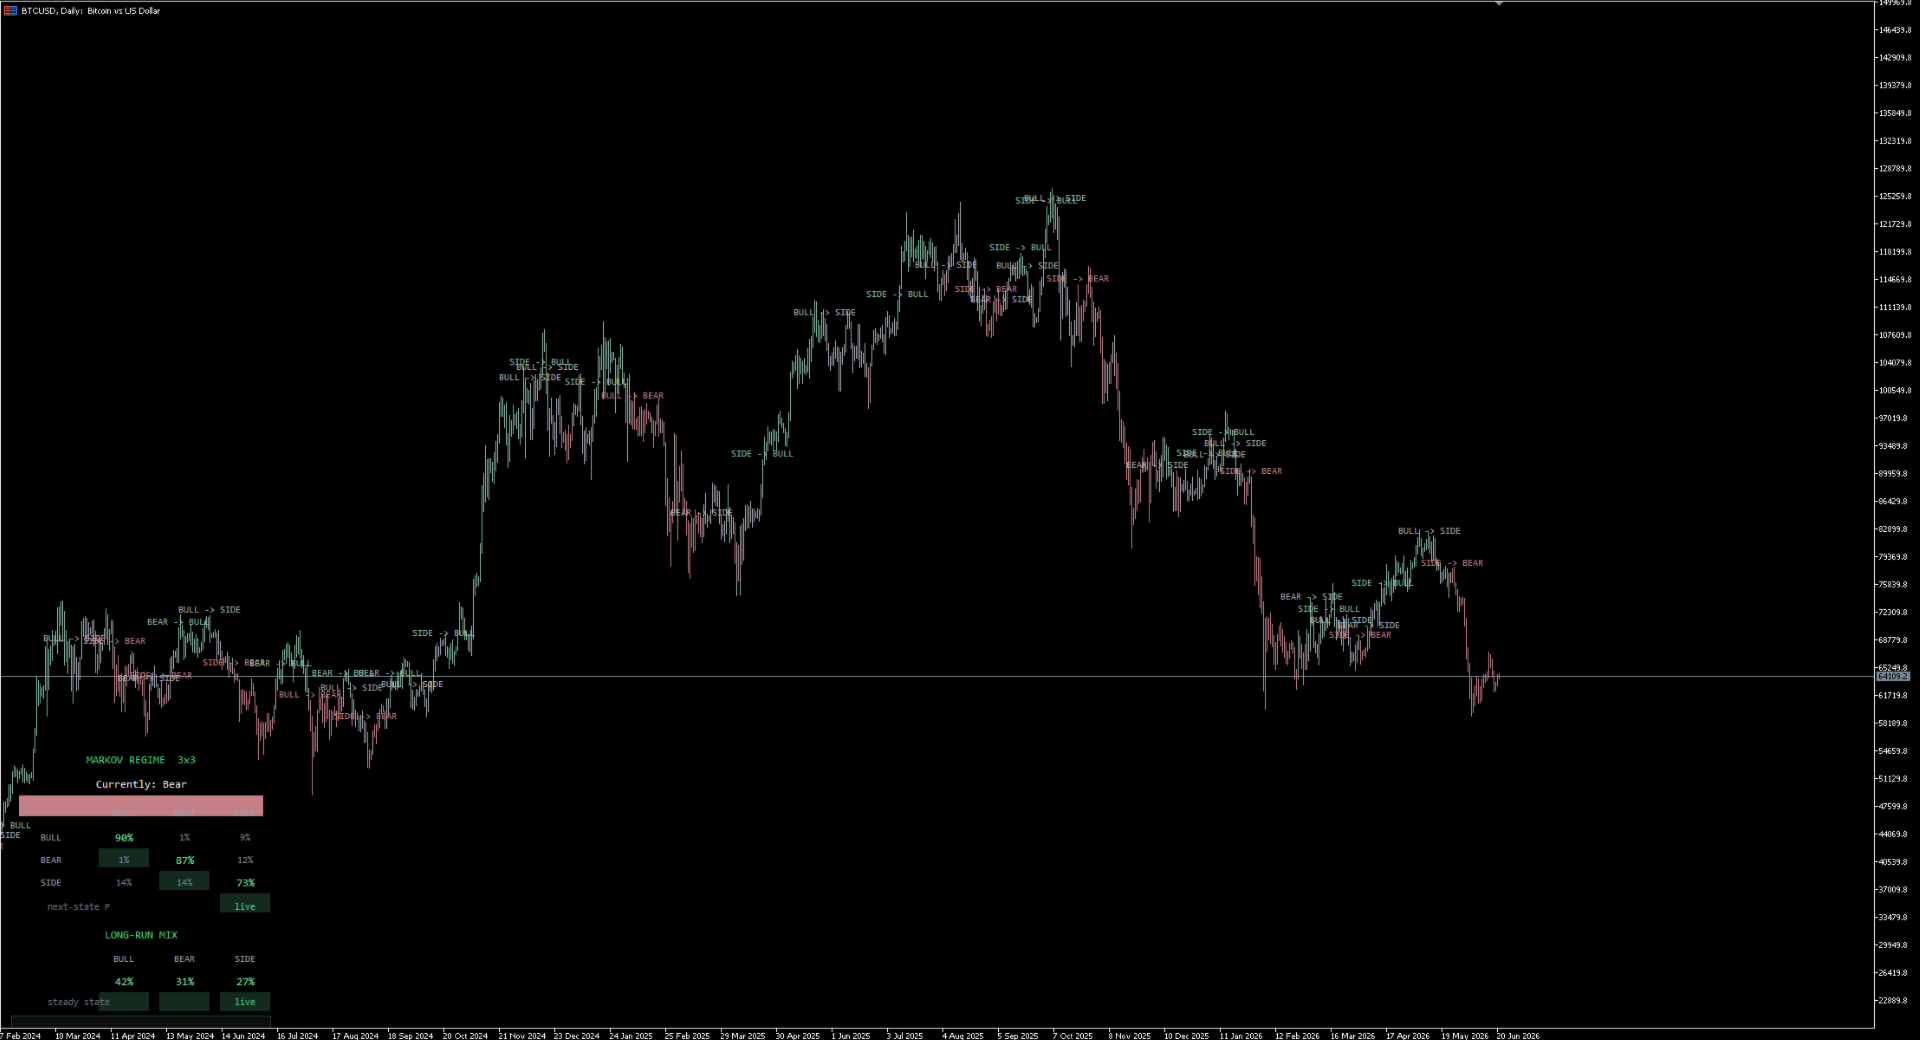
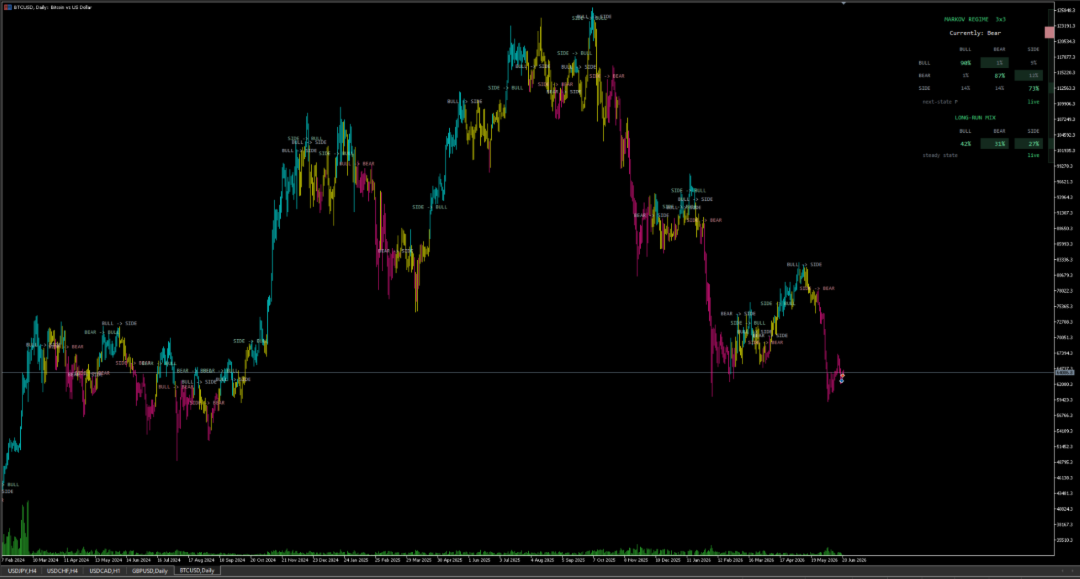
It classifies every bar, colours the price by regime, and prints a live 3×3 transition matrix plus the long-run (stationary) distribution directly on your chart.
───────────────────────────────────────────── What it does ─────────────────────────────────────────────
For each bar the indicator measures the rolling return over a configurable window and assigns one of three states:
- Bull — rolling return above the Bull threshold
- Bear — rolling return below the Bear threshold
- Sideways — anything in between
From the history of those states it builds, in real time:
- A transition matrix — the probability of moving from today's state to the next state (Bull→Bull, Bull→Bear, and so on). The diagonal shows persistence: how stable each regime tends to be.
- The stationary distribution — the long-run share of time the market spends in each regime, obtained by raising the transition matrix to a high power until the values settle.
───────────────────────────────────────────── The idea behind it ─────────────────────────────────────────────
- The Markov property — the model rests on the principle that the probability of moving to a future market state depends only on the current state, not on the path taken to reach it.
- Hamilton, 1989 — the approach traces back to James Hamilton's 1989 paper, which introduced Markov-switching models to describe how an economy moves between states such as expansion and recession.
- Use in practice — in quantitative finance, regime models of this kind are used as environmental filters, for example to adjust risk exposure when the market moves from a calm, low-volatility state into a high-volatility one. This indicator brings that same regime view onto your chart in a simple visual form.
───────────────────────────────────────────── What you see on the chart ─────────────────────────────────────────────
- Regime-coloured candles — each candle is tinted by its state (soft green = Bull, muted rose = Bear, cool grey = Sideways), so the current regime and its turning points are easy to read at a glance.
- Live matrix panel — a corner card showing the 3×3 transition matrix with the persistence diagonal highlighted, the current-regime banner, and the long-run mix table underneath. All values update as new bars close.
- Transition labels — a marker is placed on the chart (for example BULL → BEAR) only when a regime change is durable. A filter requires the new state to hold for a set number of confirmed bars before it is labelled, which keeps ranging periods free of unnecessary markers.
───────────────────────────────────────────── How to read it ─────────────────────────────────────────────
- A high diagonal value (for example Bull→Bull around 80%) means the regime is stable: trends tend to continue, which suits trend-following approaches.
- Low diagonal values, with high off-diagonal values, mean a ranging, mean-reverting market where regimes change quickly.
- The long-run mix describes the structural character of the instrument: for example a market that spends most of its time in one regime versus one that is more balanced.
Use it as a standalone read of market structure, as a confirmation layer over your own analysis, or as a quick context check before taking a trade.
───────────────────────────────────────────── Settings you can adjust ─────────────────────────────────────────────
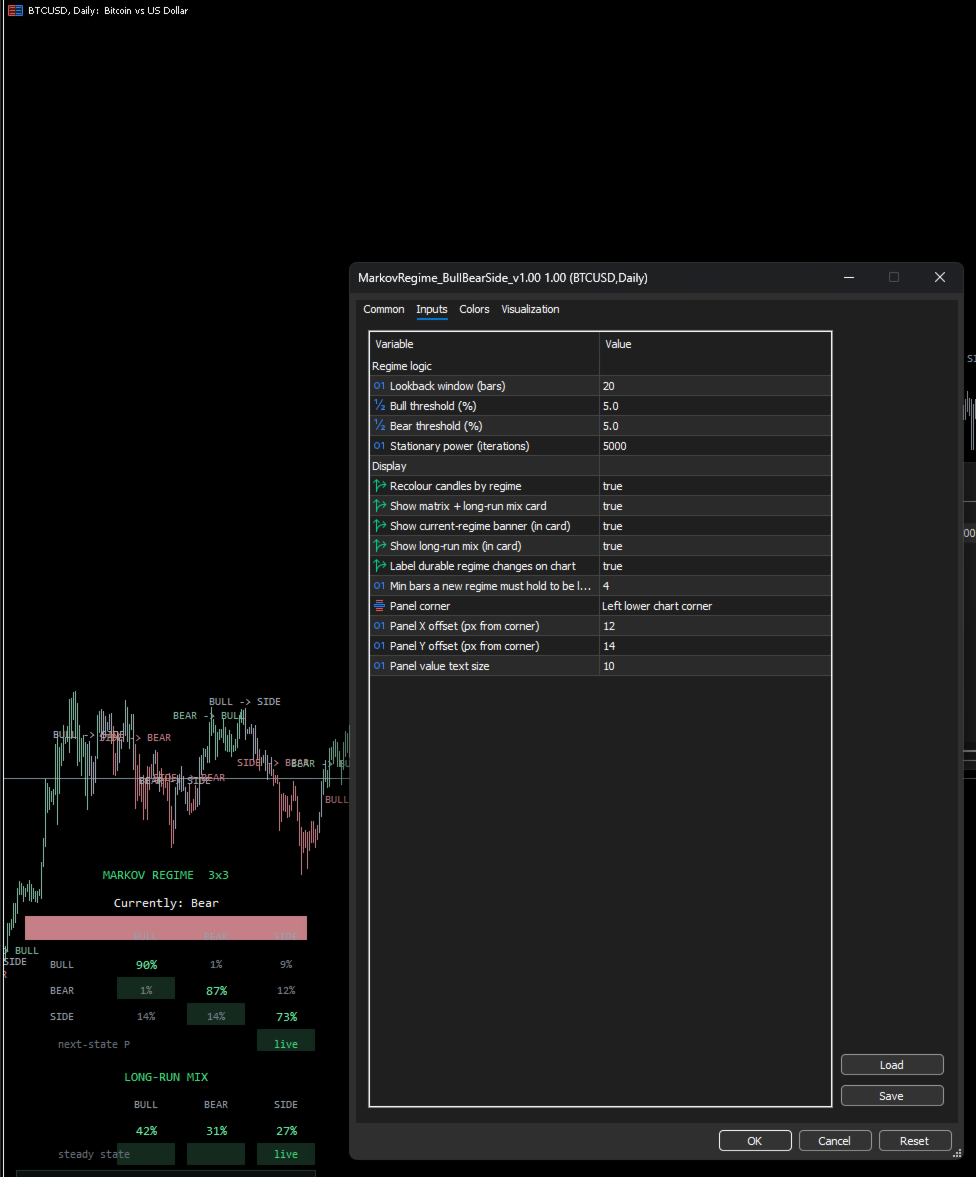
- Lookback window (bars) — the rolling-return window (default 20)
- Bull threshold (%) — a return above this labels the bar Bull (default 5.0)
- Bear threshold (%) — a return below the negative of this labels the bar Bear (default 5.0; can be set independently for asymmetric markets)
- Stationary power (iterations) — how many times the matrix is multiplied for the long-run mix (default 50)
- Recolour candles, show panel, show banner, show long-run mix, show transition labels — each visual element can be turned on or off
- Min bars a new regime must hold to be labelled — the filter for the on-chart transition markers (default 4)
- Panel corner, horizontal offset, vertical offset, text size — full control over panel placement and sizing
The thresholds are percentage-based, so scale them to your timeframe. Suggested starting points for a 20-bar window, to be adjusted to preference:
- Daily (D1) — 5.0%
- 4-hour (H4) — about 2.0%
- 1-hour (H1) — about 1.0%
- 15-minute (M15) — about 0.5%
- 5-minute (M5) — about 0.3%
- 1-minute (M1) — about 0.13%
───────────────────────────────────────────── Opening the settings on a chart ─────────────────────────────────────────────
To change the parameters while the indicator is running on a chart:
The quickest method is Ctrl+I, which opens the Indicators List for the current chart. Select "Markov Regime", click Properties, go to the Inputs tab, modify the desired values, and click OK. The indicator recalculates immediately using the new settings.
Alternative method: right-click on the chart, open the Indicators List, select the indicator, and click Properties.
Note: the Edit button opens the source code in MetaEditor, not the settings. To change parameters, always use Properties.
Convenience tip: if you adjust settings often, use the Save button at the bottom of the Inputs tab to store your preferred configuration as a .set file (for example MarkovRegime_M5.set). You can reload it later with the Load button, so you do not have to re-enter your threshold values for each timeframe.
───────────────────────────────────────────── Compatibility and behaviour ─────────────────────────────────────────────
- Any symbol, any timeframe — the indicator uses the chart's own price data and adapts to the period you load it on.
- Any account type — it is an analytical indicator only. It does not place trades and has no dependency on hedging, netting, or broker settings.
- Closed-bar values are fixed and the history does not repaint. Only the live forming bar updates until it closes, which is expected. The transition matrix is computed from confirmed bars only.
- It runs in the Strategy Tester for visual review.
───────────────────────────────────────────── Notes ─────────────────────────────────────────────
This indicator is for analytical and informational purposes only. It is not financial advice and does not generate orders. Markets carry risk, and you are responsible for your own trading decisions.
───────────────────────────────────────────── Attribution and license ─────────────────────────────────────────────
This is a MetaTrader 5 port of an open-source, MIT-licensed regime-detection framework. Credit for the underlying method goes to Roan. The original work is copyright Lewis Jackson Ventures Ltd, released under the MIT License. The port, the on-chart panel, the candle colouring, and the transition labelling are the contribution of the publisher.
───────────────────────────────────────────── Version ─────────────────────────────────────────────
Version 1.01 — initial release.
This first build includes regime classification, candle colouring, the live 3×3 transition matrix, the stationary distribution, and the filtered transition labels, all configurable. Feedback is welcome and will guide future updates.