Awesome SnR

Awesome AO 4-Color AUTO REFRESH Indicator

Advanced Momentum & Zero-Cross Visualization Tool for MT4

The Awesome AO 4-Color AUTO REFRESH indicator is a powerful upgraded version of the classic Awesome Oscillator designed for professional Forex traders who want cleaner momentum visualization, automatic chart marking, and better trade confirmation.

Built by FXSignalSpot, this indicator transforms the standard AO into a more advanced trading assistant by adding:

  • 4-color momentum histogram logic
  • Automatic zero-cross vertical signals
  • Candle trace horizontal levels
  • Auto-refresh protection after timeframe changes
  • Smart chart cleanup system
  • Fully customizable line styles and colors

This version is optimized for smoother performance, better visual analysis, and non-cluttered chart behavior.

Key Features

1. Advanced 4-Color AO Histogram

Unlike the default MT4 Awesome Oscillator, this version separates momentum into 4 distinct market conditions:

Rising Above Zero

  • Shows strengthening bullish momentum
  • Colored separately for easy trend continuation detection

Falling Above Zero

  • Shows weakening bullish momentum
  • Helps identify possible pullbacks or reversals

Rising Below Zero

  • Shows bearish weakness
  • Useful for spotting potential bullish reversals

Falling Below Zero

  • Shows strengthening bearish momentum
  • Ideal for sell continuation setups

This color separation helps traders instantly understand market momentum without needing additional indicators.

2. Automatic Zero-Cross Signal Detection

The indicator automatically detects when the AO crosses the zero level:

  • Bullish zero-cross
  • Bearish zero-cross

When a cross happens, the system automatically draws:

  • A vertical signal line
  • A horizontal candle trace line

This makes historical analysis and live signal tracking extremely easy.

3. Vertical Signal Lines

The indicator plots highly visible vertical lines directly on the chart whenever momentum shifts occur.

Buy Cross

  • Draws bullish vertical line

Sell Cross

  • Draws bearish vertical line

These lines help traders quickly identify:

  • Trend reversals
  • Momentum shifts
  • Entry timing
  • Breakout confirmation zones
4. Candle Trace Horizontal Levels

At every zero-cross signal, the indicator also draws a horizontal line from the signal candle high.

This feature helps traders identify:

  • Key breakout levels
  • Resistance zones
  • Momentum trigger levels
  • Potential retest areas

Perfect for:

  • Breakout traders
  • Smart money traders
  • Momentum scalpers
5. AUTO REFRESH System (Timeframe Change Fix)

One major issue with many MT4 indicators is chart freezing or object duplication after changing timeframes.

This indicator includes a fully integrated:

  • Auto refresh engine
  • Automatic object cleanup
  • Safe redraw logic

Benefits:

  • No duplicate signal lines
  • Cleaner charts
  • Stable performance
  • Faster refresh after TF switching
6. Smart Object Cleanup

The indicator intelligently removes old signal objects based on your selected limit.

This prevents:

  • Chart clutter
  • MT4 slowdown
  • Excessive object accumulation

The cleanup engine keeps only the most recent signals visible.

7. Fully Customizable

Every visual element can be customized.

You can change:

  • Vertical line colors
  • Horizontal line colors
  • Line styles
  • Line widths
  • Maximum number of saved signals

This allows traders to match the indicator perfectly with their trading templates.

Recommended Trading Usage

This indicator works extremely well for:

  • Trend following
  • Momentum trading
  • Gold trading (XAUUSD)
  • Forex scalping
  • Breakout strategies
  • Smart money concepts
  • Confirmation entries

Best used together with:

  • Market structure
  • Support & resistance
  • Trend filters
  • Price action confirmation

Prodotti consigliati
Free automatic Fibonacci is an indicator that automatically plots a Fibonacci retracement based on the number of bars you select on the BarsToScan setting in the indicator. The Fibonacci is automatically updated in real time as new highest and lowest values appears amongst the selected bars. You can select which level values to be displayed in the indicator settings. You can also select the color of the levels thus enabling the trader to be able to attach the indicator several times with differe
FREE
Email Drawdown Alert
Roman Starostin
5 (12)
Free informative Indicator-helper. It'll be usefull for traders who trade many symbols or using grid systems (Averaging or Martingale). Indicator counts drawdown as percent and currency separate. It has a number of settings: Count deposite drawdown according equity value and send e-mail or notifications to user if DD more than set; Sending e-mail when max open orders reached; Shows price and remaining pips amount before MarginCall on current chart and Account generally; Display summary trade lot
FREE
Discover the power of precision and efficiency in your trading with the " Super Auto Fibonacci " MT4 indicator. This cutting-edge tool is meticulously designed to enhance your technical analysis, providing you with invaluable insights to make informed trading decisions. Key Features: Automated Fibonacci Analysis: Say goodbye to the hassle of manual Fibonacci retracement and extension drawing. "Super Auto Fibonacci" instantly identifies and plots Fibonacci levels on your MT4 chart, saving you tim
FREE
Trendline indicator
David Muriithi
2 (1)
Are you tired of drawing trendlines every time you're analyzing charts? Or perhaps you would like more consistency in your technical analysis. Then this is for you. This indicator will draw trend lines automatically when dropped on a chart. How it works Works similar to standard deviation channel found on mt4 and mt5. It has 2 parameters: 1. Starting Bar 2. Number of bars for calculation The   starting bar   is the bar which drawing of the trend lines will begin, while the   number of bars for c
FREE
Rainbow MT4
Jamal El Alama
Rainbow MT4 is a technical indicator based on Moving average with period 34 and very easy to use. When price crosses above MA and MA changes color to green, it’s a signal to buy. When price crosses below MA and MA changes color to red, it’s a signal to sell. The Expert advisor ( Rainbow EA MT4) based on Rainbow MT4 indicator, as you can see in the short video below is now available here .
FREE
Silver Bullet MT4
Saksham Solanki
5 (2)
Contact me for any queries or custom orders, if you want to use this in an EA. Key Features: Pattern Recognition : Identifies Fair Value Gaps (FVGs) Spots Break of Structure (BOS) points Detects Change of Character (CHoCH) patterns Versatile Application : Optimized for candlestick charts Compatible with any chart type and financial instrument Real-Time and Historical Analysis : Works seamlessly with both real-time and historical data Allows for backtesting strategies and live market analysis Vi
FREE
Extremum Reverse Bar
Yurij Izyumov
2.8 (5)
This indicator has been created for finding the probable reversal points of the symbol price. A small candlestick reversal pattern is used it its operation in conjunction with a filter of extremums. The indicator is not redrawn! If the extremum filter is disabled, the indicator shows all points that have a pattern. If the extremum filter is enabled, the condition works – if the history Previous bars 1 candles back contains higher candles and they are farther than the Previous bars 2 candle, such
FREE
Auto Supply and Demand Oscillator is an indicator for MetaTrader 4 and MetaTrader 5 that detects supply and demand zones automatically and displays them as a single oscillator value at the bottom of the chart, instead of drawing rectangles directly on price. Concept Supply zones are price areas where strong selling created a sharp downward move away from a balance area. Demand zones are price areas where strong buying created a sharp upward move. Traditional implementations draw boxes on the
FREE
The free version of the Hi Low Last Day MT4 indicator . The Hi Low Levels Last Day MT4 indicator shows the high and low of the last trading day . The ability to change the color of the lines is available . Try the full version of the Hi Low Last Day MT4 indicator , in which additional indicator features are available : Displaying the minimum and maximum of the second last day Displaying the minimum and maximum of the previous week Sound alert when crossing max . and min . levels Selecting an arb
FREE
High Low Open Close MT4
Alexandre Borela
4.81 (21)
Se ti piace questo progetto, lascia una recensione a 5 stelle. Questo indicatore disegna i prezzi aperti, alti, bassi e di chiusura per i specificati periodo e può essere regolato per un determinato fuso orario. Questi sono livelli importanti guardati da molti istituzionali e professionali commercianti e può essere utile per voi per conoscere i luoghi dove potrebbero essere più attivo. I periodi disponibili sono: Giorno precedente. Settimana precedente. Mese precedente. Precedente trimestre. A
FREE
Indicatore Smart FVG MT4 – Rilevamento Avanzato del Fair Value Gap per MetaTrader 4 L'indicatore Smart FVG per MetaTrader 4 offre rilevamento, monitoraggio e avvisi professionali dei Fair Value Gap (FVG) direttamente sui tuoi grafici. Combina un filtro basato sull'ATR con una logica sensibile alla struttura per eliminare il rumore, adattarsi alla liquidità e mantenere solo gli squilibri più rilevanti per decisioni operative precise. Vantaggi principali Rilevamento accurato degli FVG: individua
FREE
Segni a mano le zone di offerta e le zone di domanda e ottieni ogni volta un risultato leggermente diverso? Questo indicatore gratuito per MetaTrader 4 le disegna con un'unica regola fissa, descritta per intero qui sotto, così puoi verificare ogni zona da solo. L'idea: una candela forte (corpo di almeno X volte l'ATR) lascia subito prima di sé una "base" di 1-10 candele piccole. Una candela forte rialzista che chiude sopra la base la trasforma in una zona di domanda; una ribassista che chiude s
FREE
Quantum Falcon Signal Free is a smart visual trading indicator for MetaTrader 4 designed for Forex and Gold traders. The indicator combines: • Trend analysis • RSI momentum confirmation • MACD momentum filtering • ATR volatility filtering • Higher timeframe confirmation • Smart exit signal detection Main Features: • Smart Buy and Sell signals • Exit Buy / Exit Sell alerts • Real-time dashboard on chart • Professional candle arrows • Multi-timeframe trend confirmation • ATR market volatility filt

FREE
Traditional MACD MT4
Daniel Lewis
4.6 (57)
MACD indicator in MetaTrader 4/5 looks different than MACD does in most other charting software. That is because the MetaTrader 4/5 version of MACD displays the MACD line as a histogram when it is traditionally displayed as a line. Additionally, the MetaTrader 4/5 version computes the Signal line using an SMA, while according to MACD definition it is supposed to be an EMA. The MetaTrader 4/5 version also does not compute a true MACD Histogram (the difference between the MACD/Signal lines). This
FREE
Blahtech VWAP
Blahtech Limited
5 (3)
Blahtech VWAP - Volume Weighted Average Price (VWAP) is the ratio of price to total volume. It provides an average price over a specified time interval.  Links [  Install  |  Update  |  Documentation   ] Feature Highlights Configurable VWAP Line Sessions, intervals, anchored or continuous Previous day settlement line Standard Deviation bands Alerts at bar close or real time Automatic Broker or Tick volumes Significantly reduced CPU usage Input Parameters Expert Advisor Mode  - Reserved for iC
FREE
PZ Penta O MT4
PZ TRADING SLU
2.33 (3)
The Penta-O is a 6-point retracement harmonacci pattern which usually precedes big market movements. Penta-O patterns can expand and repaint quite a bit. To make things easier this indicator implements a twist: it waits for a donchian breakout in the right direction before signaling the trade. The end result is an otherwise repainting indicator with a very reliable trading signal. The donchian breakout period is entered as an input. [ Installation Guide | Update Guide | Troubleshooting | FAQ | A
FREE
YOU CAN NOW DOWNLOAD FREE VERSIONS OF OUR PAID INDICATORS . IT'S OUR WAY OF GIVING BACK TO THE COMMUNITY ! >>>    GO HERE TO DOWNLOAD This system is an Heiken Ashi system based on RSI calculations . The system is a free open source script originally published on TradingView by JayRogers . We have taken the liberty of converting the pine script to Mq4 indicator . We have also added a new feature which enables to filter signals and reduces noise on the arrow signals. Background HEIKEN ASHI Th
FREE
NeuroTrend Cloud è un indicatore di tendenza gratuito per MetaTrader 4. Mostra la direzione del trend e i segnali, e segnala anche le fasi laterali in cui è meglio non operare. Il verde indica un trend rialzista, il rosso un trend ribassista, il grigio una fase laterale senza segnali. I segnali non vengono ridisegnati. Come funziona La linea centrale è una KAMA (media mobile adattiva di Kaufman): veloce nei trend, lenta nei mercati agitati. La nuvola che la circonda si basa sull'ATR: si allarga
FREE
SWING HIGHS LOWS DETECTOR Swing Detection with Divergence Analysis -------------------------------------------------- Identify swings. Spot divergences. Trade with confluence. -------------------------------------------------- WHAT THIS INDICATOR DOES This indicator automatically detects structural swing highs and lows using configurable depth and deviation filtering. It then analyzes RSI and MACD to detect regular and hidden divergences between consecutive swings of the same type. Diver
FREE
Follow The Line
Oliver Gideon Amofa Appiah
3.94 (16)
FOLLOW THE LINE GET THE FULL VERSION HERE: https://www.mql5.com/en/market/product/36024 This indicator obeys the popular maxim that: "THE TREND IS YOUR FRIEND" It paints a GREEN line for BUY and also paints a RED line for SELL.  It gives alarms and alerts of all kinds. IT DOES NOT REPAINT and can be used for all currency pairs and timeframes. Yes, as easy and simple as that. Even a newbie can use it to make great and reliable trades. NB: For best results, get my other premium indicators for more
FREE
This indicator alerts you when/before new 1 or 5 minute bar candle formed. In other words,this indicator alerts you every 1/5 minutes. This indicator is especially useful for traders who trade when new bars formed. *This indicator don't work propery in strategy tester.Use this in live trading to check functionality. There is more powerful Pro version .In Pro version,you can choose more timeframe and so on. Input Parameters Alert_Or_Sound =Sound ----- Choose alert or sound or both to notify y
FREE
OrderBlock TS Roman
Vladislav Vlastovskii
4 (6)
Индикатор строит блоки заказов (БЗ) по торговой системе (ТС) Романа. Поиск блоков осуществляется одновременно на двух таймфремах: текущем и старшем (определяемым в настройках). Для оптимизации и игнорирования устаревших блоков в настройках задается ограничение количества дней в пределах которых осуществляется поиск блоков. Блоки строятся по правилам ТС состоящем из трех шагов: какую свечу вынесли (что?); какой свечой вынесли (чем?); правило отрисовки (как?).
FREE
Our offer also includes a free panel — Indicator Panel — which allows you to show or hide indicators created by BOToBRACIA ->  MT4  /   MT5 Our offer also includes a version for MetaTrader 5 ->  https://www.mql5.com/en/market/product/171195?source=Site+Market+Product+Page Pivot Points   are a classic technical analysis indicator that calculates the central pivot point (PP) as well as support (S1–S3) and resistance (R1–R3) levels based on the previous day’s High, Low, and Close. The indicator
FREE
Fx BFP Pivot Points
Maged Ait Abbi
5 (6)
A forex   pivot point   strategy could very well be a trader’s best friend as far as identifying levels to develop a bias, place stops and identify potential profit targets for a trade. Pivot points have been a go-to for traders for decades. The basis of pivot points is such that price will often move relative to a previous limit, and unless an outside force causes the price to do so, price should stop near a prior extreme. Pivot point trading strategies vary which makes it a versatile tool for
FREE
WAD Stoch
Yonny Pascal Ekwa Mezui
WAD Divergence + Stochastic Overview WAD Divergence + Stochastic is a technical indicator designed to assist traders in identifying potential market turning points. It combines price behavior with momentum confirmation to highlight areas where buying or selling pressure may be shifting. The indicator works directly on the chart and provides clear visual signals to support decision-making in fast-moving markets. How It Works The indicator analyzes the relationship between price movement and inte
FREE
Candle Countdown — Tempo preciso fino alla chiusura della candela per MT4 Candle Countdown è uno strumento semplice e preciso che mostra il tempo rimanente fino alla chiusura della candela corrente direttamente sul grafico. Quando l’ingresso dipende dalla chiusura della candela, anche pochi secondi possono fare la differenza. Questo indicatore ti permette di vedere il tempo esatto e prendere decisioni senza fretta o supposizioni. Un indicatore per il controllo preciso della chiusura della cande
FREE
Awesome Pivot Indicator
Komang Putra Riswanjaya
4 (1)
The Pivot Indicator is a vital tool for technical analysis used by traders in the financial markets. Designed to assist in identifying potential reversal points or trend changes, this indicator provides valuable insights into key levels in the market. Key features of the Pivot Indicator include: Automatic Calculations: The Pivot Indicator automatically calculates Pivot Point, Support, and Resistance levels based on the previous period's high, low, and close prices. This eliminates the complexity
FREE
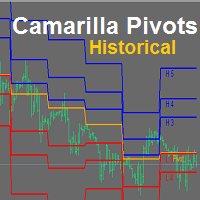
YOU CAN NOW DOWNLOAD FREE VERSIONS OF OUR PAID INDICATORS . IT'S OUR WAY OF GIVING BACK TO THE COMMUNITY ! >>>    GO HERE TO DOWNLOAD Camarilla Pivots Historical plots the historical data of the camarilla pivot point levels on the chart. The Camarilla Pivot levels was originated in 1989 by Nick Scott. The levels are used as primary support and resistance levels by Intraday traders. The levels are calculated with the following formula: R4 = C + RANGE * 1.1/2 R3 = C + RANGE * 1.1/4 R2 = C + RANG
FREE
HMA Trend
Pavel Zamoshnikov
4.56 (72)
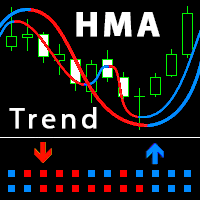
A trend indicator based on the Hull Moving Average (HMA) with two periods. The Hull Moving Average is an improved variant of the moving average, which shows the moment of trend reversal quite accurately. It is often used as a signal filter. Combination of two types of Hull Moving Averages makes a better use of these advantages: HMA with a slow period identifies the trend, while HMA with a fast period determines the short-term movements and signals in the trend direction. Features The movement d
FREE
Check my paid tools they work great and I share Ea's based on them for free please r ate The Dual Timeframe RSI (Relative Strength Index) indicator is a novel trading tool that allows traders to monitor RSI readings from two different timeframes on a single chart. This dual perspective enables traders to identify potential trend confirmations and divergences more effectively. For instance, a trader might use a 1-hour RSI alongside a daily RSI to ensure that short-term trades align with the broa
FREE
Gli utenti di questo prodotto hanno anche acquistato
Currency Strength Wizard è un indicatore molto potente che ti fornisce una soluzione all-in-one per un trading di successo. L'indicatore calcola la potenza di questa o quella coppia forex utilizzando i dati di tutte le valute su più intervalli di tempo. Questi dati sono rappresentati in una forma di indice di valuta facile da usare e linee elettriche di valuta che puoi utilizzare per vedere il potere di questa o quella valuta. Tutto ciò di cui hai bisogno è collegare l'indicatore al grafico che
Trend SniperX MT4
Sarvarbek Abduvoxobov
5 (6)
Trend Sniper X è un indicatore di trend-following multi-timeframe per MetaTrader 5 che aiuta i trader a identificare la direzione del trend e i potenziali punti di inversione con chiarezza e precisione. Per MT5: https://www.mql5.com/en/market/product/181101 Informazioni sul prezzo: Il prezzo attuale è promozionale ed è soggetto a modifiche con il rilascio dei prossimi aggiornamenti e nuove funzionalità. Canale Code2Profit Domina il mercato con l'analisi multi-timeframe! Come massimizzare il tuo
M1 Sniper
Oleg Rodin
4.97 (30)
M1 SNIPER è un sistema di indicatori di trading facile da usare. Si tratta di un indicatore a freccia progettato per l'intervallo temporale M1. L'indicatore può essere utilizzato come sistema autonomo per lo scalping sull'intervallo temporale M1 e come parte del tuo sistema di trading esistente. Sebbene questo sistema di trading sia stato progettato specificamente per il trading sull'intervallo temporale M1, può comunque essere utilizzato anche con altri intervalli temporali. Inizialmente ho pro
Smart Trend Trading System è un indicatore per MetaTrader 4 che riunisce informazioni sul trend, segnali di entrata e uscita e livelli di prezzo in un unico grafico. Combina più di 10 strumenti di trading in un unico sistema, inclusi rilevamento del trend, zone di inversione, Smart Cloud, logica di trailing stop, supporto e resistenza, colorazione delle candele, avvisi e analisi multi-timeframe. Il sistema è progettato per aiutarti a operare in diverse condizioni di mercato: Mercati in trend: I
SIO Oscillator: oscillatore auto-ottimizzante dello squilibrio di semivarianza Acquista l’indicatore e ricevi GRATIS l’Expert Advisor (EA) basato su di esso. La maggior parte degli oscillatori tratta ogni movimento di prezzo allo stesso modo. SIO separa la pressione rialzista da quella ribassista e misura lo squilibrio tra le due, mostrando quale parte controlla davvero il mercato: compratori o venditori. Quando lo squilibrio raggiunge un estremo, SIO genera un segnale chiaro con livelli di ingr
Advanced Supply Demand
Bernhard Schweigert
4.91 (302)
Speciale Trading- SCONTO DEL 30% La soluzione migliore per qualsiasi trader principiante o esperto! Questo indicatore è uno strumento di trading unico, di alta qualità e conveniente, perché abbiamo incorporato una serie di funzionalità proprietarie e una nuova formula. Con questo aggiornamento, potrai visualizzare doppie zone di timeframe. Non solo potrai visualizzare un TF più alto, ma anche entrambi, il TF del grafico e il TF più alto: MOSTRA ZONE ANNIDATE. Tutti i trader che operano con Of
Non repaint MT4
Yan Zhen Du
5 (2)
This is a professional chart indicator designed for traders focused on stability and clear price action. It helps filter market noise and provides clear visual entry and exit zones for your trading decisions. Price Information: The current price is promotional and is subject to change as upcoming updates and new features are released. MQL5 public channel:  CLICK HERE for MT5:  Non-repainting MT5 version Core Features: Strictly Non-Repainting: The system is built with strict non-repaint logic. W
Gann Made Easy
Oleg Rodin
4.84 (174)
Gann Made Easy è un sistema di trading Forex professionale e facile da usare che si basa sui migliori principi del trading utilizzando la teoria di mr. WD Gann. L'indicatore fornisce segnali ACQUISTA e VENDI accurati, inclusi i livelli di Stop Loss e Take Profit. Puoi fare trading anche in movimento utilizzando le notifiche PUSH. CONTATTAMI DOPO L'ACQUISTO PER RICEVERE GRATUITAMENTE LE ISTRUZIONI DI TRADING E OTTIMI INDICATORI EXTRA! Probabilmente hai già sentito parlare molte volte dei metodi d
Questo indicatore è un indicatore per l'analisi automatica delle onde perfetto per il trading pratico! Caso... Nota:   non sono abituato a usare nomi occidentali per la classificazione delle onde a causa dell'influenza della convenzione di denominazione di Tang Lun (Tang Zhong Shuo Zen), ho chiamato l'onda base come   penna   e la banda dell'onda secondaria come   segmento   At allo stesso tempo, il segmento ha la direzione del trend. La denominazione   è principalmente segmento di trend   (que
Attualmente 30% di sconto! La soluzione migliore per ogni principiante o trader esperto! Questo software per cruscotti funziona su 28 coppie di valute. Si basa su 2 dei nostri indicatori principali (Advanced Currency Strength 28 e Advanced Currency Impulse). Offre un'ottima panoramica dell'intero mercato Forex. Mostra i valori di forza delle valute avanzate, la velocità di movimento delle valute e i segnali per 28 coppie Forex in tutti i (9) timeframe. Immaginate come migliorerà il vostro tra
Liquidity Scalper System: un sistema di trading basato sulla liquidità in formato indicatore. La maggior parte degli indicatori mostra solo una freccia, poi è il trader a decidere dove mettere lo stop, dove si trova il target e se fidarsi del segnale. Liquidity Scalper System copre l'intero ciclo del trade: trova i pool di liquidità, dà un segnale alla loro rottura, calcola subito Entry, Stop Loss e tre target, e mostra sul pannello le statistiche e i risultati della verifica su dati nuovi. Il
Scalper Vault
Oleg Rodin
4.9 (41)
Scalper Vault è un sistema di trading potente e completo, progettato per i trader che desiderano ottenere risultati costanti nel trading intraday. Questo indicatore ad alta precisione funge da sistema di trading autonomo, offrendo analisi di livello istituzionale sia per il mercato Forex che per le Opzioni Binarie. CONTATTAMI DOPO L'ACQUISTO PER RICEVERE I MIEI CONSIGLI DI TRADING E UN FANTASTICO BONUS! Eliminando le congetture e le complesse analisi manuali, Scalper Vault ti permette di concen
Vi presentiamo ON Trade Waves Patterns Harmonic Elliot Wolfe, un indicatore avanzato progettato per rilevare vari tipi di pattern sul mercato utilizzando metodi sia manuali che automatici. Ecco come funziona: Pattern Armonici: Questo indicatore è in grado di individuare pattern armonici che appaiono sul vostro grafico. Questi pattern sono fondamentali per i trader che praticano la teoria del trading armonico, come descritta nel libro di Scott Carney "Harmonic Trading vol 1 & 2". Che li disegniat
Zoryk Gold mt4
Reda El Koutbane
5 (4)
ZORYK — Sistema avanzato di segnali e pianificazione per XAUUSD su MetaTrader 4 Conosci sicuramente questa situazione. Analizzi l’oro, aspetti l’ingresso e finalmente apri la posizione. Il prezzo si muove immediatamente contro di te. Chiudi troppo presto, sposti lo Stop Loss oppure esiti per alcuni secondi. Poco dopo, il mercato raggiunge esattamente la direzione e l’obiettivo che avevi previsto, ma senza di te. Il problema non era sempre la direzione. Il vero problema era l’incertezza. No
RFI levels PRO
Roman Podpora
5 (2)
L'indicatore mostra accuratamente i punti di inversione e le zone di ritorno dei prezzi in cui il       Principali attori   . Vedi dove si formano le nuove tendenze e prendi decisioni con la massima precisione, mantenendo il controllo su ogni operazione. VERSION MT5     -     Rivela il suo massimo potenziale se combinato con l'indicatore   TREND LINES PRO Cosa mostra l'indicatore: Strutture di inversione e livelli di inversione con attivazione all'inizio di un nuovo trend. Visualizzazione dei l
Atomic Analyst
Issam Kassas
5 (14)
Atomic Analyst — MetaTrader 4 Per domande sul prodotto, indicazioni sulla configurazione o supporto tecnico, scrivimi direttamente qui su MQL5. L’indicatore trasforma calcoli complessi del mercato in semplici segnali visivi, candele colorate, letture del trend, livelli di stop-loss e diverse zone di take-profit che i trader possono capire rapidamente e usare in condizioni reali di mercato. Principali utilizzi di trading: Scalping e trading intraday: Progettato per decisioni rapide, frecce chiar
ShapeRadar - indicatore dei pattern grafici classici ShapeRadar individua automaticamente sul grafico i pattern classici dell’analisi tecnica: doppi e tripli massimi e minimi, Testa e Spalle e la sua versione inversa, cunei ascendenti e discendenti, rettangoli, triangoli, bandiere e pennant. Quando il prezzo chiude oltre il limite di una figura, l’indicatore disegna il pattern, il punto di ingresso, il livello di stop loss e l’obiettivo, mentre un pannello informativo riassume tutti i pattern ri
PRO Renko System
Oleg Rodin
5 (31)
PRO Renko System è un sistema di trading altamente accurato appositamente progettato per il trading di grafici RENKO. Questo è un sistema universale che può essere applicato a vari strumenti di trading. Il sistema neutralizza efficacemente il cosiddetto rumore di mercato che consente di accedere a segnali di inversione accurati. L'indicatore è molto facile da usare e ha un solo parametro responsabile della generazione del segnale. Puoi facilmente adattare lo strumento a qualsiasi strumento di
SR Liquidity
Oleg Rodin
5 (3)
SR Liquidity è un indicatore di trading progettato per individuare le zone nascoste in cui si concentra la liquidità di mercato e dove il prezzo reagisce con maggiore intensità. Queste aree di liquidità agiscono come potenti livelli di supporto e resistenza, offrendo una mappa chiara dei punti in cui è più probabile che il mercato inverta la propria direzione. Invece di tracciare le classiche linee di supporto e resistenza, SR Liquidity analizza l'effettivo comportamento dei prezzi per individua
Auto Optimized SpeedAngle è un sistema di vettorizzazione del momento di livello istituzionale che elimina l'overfitting ( curve-fitting ) attraverso l'ottimizzazione continua Walk-Forward (WFO). Invece di affidarsi a input statici che si degradano quando i regimi di mercato cambiano, l'indicatore recalibra dinamicamente i suoi parametri utilizzando la validazione Out-of-Sample (OOS), assicurando che i segnali visualizzati rappresentino reali vantaggi statistici anziché anomalie storiche. Quadro
Italo Volume Indicator
Italo Santana Gomes
4.92 (79)
BUY INDICATOR AND GET EA FOR FREE AS A BONUS + SOME OTHER GIFTS! ITALO VOLUME INDICATOR  is the best volume indicator ever created, and why is that? The Indicator works on all time-frames and assets, indicator built after 7 years of experience on forex and many other markets. You know many volume indicators around the internet are not complete, does not help, and it's difficult to trade, but the Italo Volume Indicator is different , the Italo Volume Indicator shows the wave volume, when market
Stima il movimento di prezzo più probabile nel breve termine sulla base di calcoli matematici avanzati. Caratteristiche Stima del movimento immediato del prezzo sul timeframe del grafico e su tutti quelli superiori; Calcolo del trend reale del mercato; Calcolo dei livelli di supporto e resistenza più importanti; Avvisi per zone di congestione, attraversamenti di livelli e cambi di trend; Leggero sulle risorse di sistema: linee e pannello vengono aggiornati solo quando un valore cambia; Autorego
Route Lines Prices
Vitalyi Belyh
3 (1)
Route Lines Prices - è un indicatore progettato per individuare le direzioni di prezzo. La sua interfaccia semplice contiene diversi algoritmi per il calcolo del comportamento dei prezzi e della direzione futura. Questi algoritmi includono il calcolo della volatilità e lo smussamento dei prezzi in base ai timeframe utilizzati. L'indicatore ha un singolo parametro per modificare il valore di " Calculating price values ". Il valore predefinito di 1 fornisce un calcolo automatico bilanciato, che p
All in One package includes the  Oscillator Predictor ,  MACD Predictor ,  Thrust Scanner  and  Advanced Fibonacci  indicators which are mandatory for applying  Dinapoli  trade plans.  Please visit below links for detailed explanations of indicators. Advanced Fibonacci Indicator =>  https://www.mql5.com/en/market/product/52834 Thrust Scanner Indicator => https://www.mql5.com/en/market/product/52830 Overbought /Oversold Predictor indicator => https://www.mql5.com/en/market/product/52621 Macd P
True Direction Oscillator
Muhammad Elbermawi
4.85 (364)
Oppure (TDO) che è un indice che misura il tasso di variazione del prezzo utilizzando il principio del " Pure Momentum ". Quando il prezzo di un titolo avanza da 10 a 15, il tasso di variazione del prezzo è del 150%, ma quando scende da 15 a 10, il tasso di variazione del prezzo è solo del 33,3%. Ecco perché gli indicatori di analisi tecnica come "Price Rate of Change" (ROC) o "Momentum" forniscono letture più elevate per i movimenti di prezzo ascendente rispetto a quelli dati a quelli discenden
Quantum Imbalance Profiles   è un indicatore delle fasi di equilibrio e squilibrio. Mostra a quali prezzi il mercato ha scambiato volume, quale parte ha dominato all'interno di quella zona e attraverso quali livelli il prezzo si è poi espanso con un impulso. Un profilo di volume classico risponde a una sola domanda: dove sono avvenuti gli scambi. Non mostra quale parte ha dominato a ogni prezzo, come si è conclusa la fase laterale né in quale direzione il mercato ne è uscito. Quantum Imbalance P
Indicatore per il trading manuale e l'analisi tecnica per il Forex. È costituito da un indicatore di tendenza con il livello di apertura del giorno di negoziazione e da un indicatore a freccia per determinare i punti di ingresso. L'indicatore non si ricolora; funziona quando la candela si chiude. Contiene diversi tipi di avvisi per le frecce di segnalazione. Può essere configurato per funzionare su qualsiasi grafico, strumento di trading o intervallo di tempo. La strategia di lavoro si basa su
Dark Support Resistance  is an Indicator for intraday trading. This Indicator is programmed to identify  Support and Resistance Lines , providing a high level of accuracy and reliability. Key benefits Easily visible lines Only the most important levels will be displayed Automated adjustment for each timeframe and instrument Easy to use even for beginners Never repaints, never backpaints, Not Lag 100% compatible with Expert Advisor development All types of alerts available: Pop-up, Email, Push
ATTUALMENTE SCONTATO DEL 40%! La soluzione migliore per ogni principiante o trader esperto! Questo indicatore è uno strumento di trading unico, di alta qualità e conveniente perché abbiamo incorporato una serie di caratteristiche proprietarie e una formula segreta. Con un solo grafico fornisce avvisi per tutte le 28 coppie di valute. Immaginate come migliorerà il vostro trading perché sarete in grado di individuare l'esatto punto di innesco di una nuova tendenza o opportunità di scalping! Co
M1 Arrow Scalping - shows signals on the M1 period, does not redraw entry points and can work on all major currency pairs + metals (gold/silver). The indicator analyzes the market using algorithms for determining price patterns and shows the trader the price reversal points on the chart. The red dot shows that the price will turn down and the blue dot shows that the price will turn up. The indicator also sends signals to the phone in the form of PUSH notifications. Therefore, you do not need to
Altri dall’autore
CRT H4 ARROW Strategy CRT H4 ARROW High-Probability Continuation & Reversal Trading Strategy The CRT H4 ARROW Strategy is a professional price action trading method designed to identify high-probability institutional entries using Candle Range Theory (CRT) on the 4-Hour (H4) timeframe. Rather than chasing the market, the strategy waits for price to reach a predefined CRT Entry Level , where institutional buying or selling pressure is likely to appear. This allows traders to enter with clearly
FREE
In poche parole Questo indicatore combina due esperti — l'RSI e il MACD — in un unico sistema. Invece di guardare due grafici separati e fare ipotesi, prende la decisione per te: quando entrambi gli indicatori sono d'accordo, disegna una freccia (acquisto o vendita). La cosa più importante: le frecce non vengono ridipinte . Una volta apparse, rimangono dove sono. Puoi fare backtest e operare in tempo reale con piena fiducia. Cosa significa "Combo" Normalmente, un trader guarda l'RSI (che misura
LiquiditySweepHunter
Michael Oko Oboh
5 (2)
OVERVIEW Liquidity Sweep Hunter  identifies liquidity highs and lows across three different lookback periods and keeps them active until they are mitigated. This creates a persistent view of where resting liquidity has formed instead of only showing the latest swing points. The indicator also displays a heatmap that highlights the relative strength of active liquidity levels and generates reversal signals after price sweeps multiple visible liquidity bands before reclaiming them. Optional tr
FREE
DMSL Pro Ultra
Michael Oko Oboh
DMSL Pro Ultra is a professional MetaTrader 5 (MT5) trading indicator that helps traders understand market structure and identify high-probability trading zones. It automatically detects important support and resistance levels, highlights major swing highs and lows, and displays market structure changes in real time. The indicator is designed to reduce chart clutter while providing clear, actionable trading information. Key Features Automatic Support & Resistance Detection Identifies strong supp
FREE
SignalLadderEA
Michael Oko Oboh
Stochastic Multi-Market EA (MT5) One chart. Many markets. A disciplined Stochastic crossover strategy with risk controls built in. This Expert Advisor trades Stochastic Oscillator crossovers in overbought and oversold zones. It works across a whole list of symbols from a single chart, and it runs on both netting and hedging accounts. How it trades Signals are read from the last closed candle, so there is no repainting and no entry on a half-formed bar. Sell: the Main line crosses below the Signa
FREE
Volume Arrow Scanner MT5 The Volume Arrow Scanner is a professional multi-timeframe trend and momentum indicator designed to identify high-probability buying and selling opportunities by analyzing market direction, momentum changes, and crossover events. It displays all trading signals directly on the price chart, allowing traders to quickly identify potential entries and exits without using a separate indicator window. Key Features Multi-Timeframe Trend Analysis The indicator can analyze price
FREE
VolumeMomentumIndex_SMRT — Professional MT5 Volume Profile & Momentum Indicator VolumeMomentumIndex_SMRT is a multi-functional MetaTrader 5 indicator designed to help traders analyze market volume, price momentum, key support and resistance zones, and potential trading opportunities. Combining volume profile analysis with breakout and rejection signal detection, the indicator provides a structured view of market activity to support informed trading decisions across multiple timeframes and financ
FREE
Volume Arrow Signal Product Description Volume Arrow Signal is a smart trading indicator designed to help traders identify potential buy and sell opportunities using price action, volume behavior, and directional arrow signals. The indicator places clear arrows directly on the chart, making it easy to spot possible market reversals, trend continuations, and entry opportunities without spending hours analyzing charts manually. Whether you are trading Gold (XAUUSD) , Forex pairs, Indices, or Crypt
OVERVIEW Liquidity Sweep Hunter  identifies liquidity highs and lows across three different lookback periods and keeps them active until they are mitigated. This creates a persistent view of where resting liquidity has formed instead of only showing the latest swing points. The indicator also displays a heatmap that highlights the relative strength of active liquidity levels and generates reversal signals after price sweeps multiple visible liquidity bands before reclaiming them. Optional tr
FREE
RSI SIGNAL Indicator RSI SIGNAL is a technical trading indicator designed to help traders identify high-probability Buy and Sell opportunities by combining RSI momentum analysis with price action and trend confirmation. Main Purpose The indicator analyzes the current market condition and produces clear BUY and SELL signals directly on the chart. Instead of relying on RSI alone, it can use multiple confirmations to reduce weak or misleading signals. Key Features BUY Signals — identifies b
FREE
SMC Order Block Scorer: Volume Confluence Order blocks that are ranked for you, so you can see which zones matter most. Most Smart Money Concepts indicators draw every order block the same way. You end up with a chart full of boxes and no way to tell which ones are worth your attention. This indicator draws the zones and also scores each one from 0 to 100 and gives it a grade (A+, A, B or C). The score comes from market structure and volume. The score is a rule-based confluence ranking. It is no
FREE
1. STRUCTURAL STRENGTH (0-9 Scale) The indicator analyzes each currency's position relative to its daily range across all 28 major pairs: Price position within the daily high/low range is converted to a 0-9 score using a statistical distribution model Base currency receives a score proportional to its strength Quote currency receives the inverse score (9 - base score) Final structural strength = average score across all pairs the currency participates in text STRONG currencies (score ≥ 6.0) → Po
FREE
Currency Strength Meter Dashboard Indicator Overview The Currency Strength Meter Dashboard is a professional-grade MetaTrader 4 (MT4) indicator developed by fxsignalspot.com . It provides traders with a comprehensive, real-time view of currency strength across 8 major currencies (USD, EUR, GBP, CHF, CAD, AUD, JPY, NZD) and 28 currency pairs. The indicator features an interactive on-chart dashboard with multiple display modes, customizable color-coded strength zones, trend/range meters, trade bia
FREE
A Range Detector Indicator is a technical analysis tool designed to automatically identify when the market is not trending and is instead moving inside a sideways consolidation structure (range) . In professional trading systems, it is less about drawing boxes and more about classifying market state : trend vs range. To understand it properly, you need to see it as a market regime detector , not just a support/resistance tool. 1. What a “range” actually means (core concept) A market is consid
FREE
FNCD (Fisher Normalized Cumulative Deviation) Indicator Overview The FNCD is a momentum oscillator that combines statistical normalization with the Fisher Transform to create a highly responsive yet smooth indicator. It measures how far price has deviated from its mean in terms of standard deviations, then applies the Fisher Transform to normalize the distribution. The result is a bounded oscillator with clear crossover signals, displayed as a two-color histogram against a signal line. How It Wo
FREE
SMC Institutional Visualizer with Weekly Range Box - Detect Liquidity Sweeps, BOS, Order Blocks, FVGs & Weekly Key Levels Complete Smart Money Concepts (SMC) indicator for institutional trading visualization. Detects Liquidity Sweeps, Break of Structure (BOS), Order Blocks, and Fair Value Gaps (FVG). Now includes Weekly Range Box showing last closed weekly candle's high, low, and midline. Fully customizable colors and styles. Perfect for price action and supply/demand traders. Long Description
FREE
The Breakout and Structural Shift The indicator registers a true breakout when the price aggressively pushes past a previously established level and closes outside of it. To confirm a change to a Bullish structure: The price must break above the previous high . Once a candle closes above that peak, the old resistance is broken. The structure officially shifts because the market has just created a Higher High , signaling that buyers are firmly in control. To confirm a change to a Bearish structur
FREE
The Breakout and Structural Shift The indicator registers a true breakout when the price aggressively pushes past a previously established level and closes outside of it. To confirm a change to a Bullish structure: The price must break above the previous high . Once a candle closes above that peak, the old resistance is broken. The structure officially shifts because the market has just created a Higher High , signaling that buyers are firmly in control. To confirm a change to a Bearish structur
FREE
Trend Mega Hilo
Michael Oko Oboh
Trend Mega Profit Hilo is a powerful non-repainting trend momentum indicator designed to help traders identify bullish and bearish market direction with improved clarity and stability. It combines advanced price normalization, logarithmic momentum calculation, and exponential smoothing to deliver clean trend histograms, smoothed signal lines, and early reversal indications. This indicator is built specifically for traders who want: Stable non-repainting signals Cleaner trend visualization Reduce
CloudScalper Gold
Michael Oko Oboh
CloudScalper Gold: Specialista in Breakout di Tendenza ad Alta Frequenza CloudScalper Gold è un Expert Advisor (EA) premium progettato specificamente per l'ambiente ad alta volatilità del mercato dell'Oro (XAUUSD). Ingresso di Precisione: Strategia Stop-Order Breakout che entra solo su conferma del movimento. Difesa "Cloud": Chiusura di panico automatica per prevenire grossi drawdown. Break-Even Intelligente: Sposta lo Stop Loss al prezzo di ingresso per proteggere i profitti. Sicurezza del Cont
Kısa ve öz Bu gösterge, iki uzmanı – RSI ve MACD'yi – tek bir sistemde birleştirir . İki ayrı grafiğe bakıp tahmin yürütmek yerine, kararı sizin için verir: Her iki gösterge de aynı fikirde olduğunda bir ok çizer (al veya sat). En önemlisi: Oklar yeniden çizilmez . Bir kere belirdi mi, olduğu yerde kalır. Backtest yapabilir ve canlı işlemlerinize güvenebilirsiniz. "Combo" ne anlama geliyor? Normalde bir trader, RSI'ye (hareketin gücü) ve MACD'ye (trend yönü) ayrı ayrı bakar. Burada ikisi takım
This indicator is basically a zero-line momentum oscillator with built-in buy/sell crossover signals , designed to behave like a smoothed “pressure gauge” for price direction. What the indicator does It works in two layers: 1. Main Oscillator (Subwindow line) The yellow line (buffer 0) is a custom Fisher-style normalized momentum value . It is built from: Highest close over a period Lowest close over a period Mid price (Open + Close)/2 Recursive smoothing (previous values influence current
ENTRY AND EXIT ARROWS Indicator – Description The Entry and Exit Arrows indicator is a simple yet effective momentum-based tool designed to highlight potential buy and sell opportunities directly on the chart using visual arrows. It works by comparing two internal momentum measurements with different sensitivities. When both measurements align in the same direction, the indicator confirms a stronger directional bias and plots a signal. How It Works Buy Signal (Lime Arrow Below Candle): Appea
ForceWave
Michael Oko Oboh
Product Description ForceWave is an advanced momentum and trend-strength indicator designed to help traders identify market pressure, directional strength, and potential reversals with reduced repainting behavior. It analyzes price movement using a smoothed force-wave algorithm and displays bullish and bearish momentum directly in a separate indicator window for easier market interpretation. The indicator was developed with a focus on confirmed candle calculations, helping traders reduce false s
Visible Range High Low MT4 (Non-Repainting) Overview The Visible Range High Low indicator is designed to help traders instantly identify the most critical price levels on their chart. It dynamically scans a user-defined number of bars to detect the visible range's absolute high and low, marking these pivot points directly on the chart. Key Features: Non-Repainting Logic: Once a high or low is identified and plotted, it remains fixed, allowing for reliable back-testing and historical analysis. C
Binary Signal Arrow / Scalper Arrow Indicator This is a zero-lag momentum arrow indicator that plots buy/sell signals directly on the chart when momentum reaches exhaustion points. What it shows: Lime histogram = Bullish momentum Red histogram = Bearish momentum Up arrows (Blue/Yellow) = Buy signals (momentum strengthening or weakening at thresholds) Down arrows (Pink/Yellow) = Sell signals How it triggers: The indicator plots arrows when momentum changes character after sensitivity bars (defaul
SpeedMomentum
Michael Oko Oboh
Adaptive Tick Impulse Momentum Meter PRO Institutional Non-Repainting Momentum Engine for MT4 The Adaptive Tick Impulse Momentum Meter PRO is an advanced institutional-style momentum and speed detection indicator designed for traders who want to identify explosive market moves before they fully develop. Unlike traditional indicators that rely on lagging averages or simple candle analysis, this engine combines: Tick imbalance analysis Adaptive volatility intelligence Momentum acceleration Kalman
Breakout Arrows Mt4
Michael Oko Oboh
5 (1)
Trend Breakout Arrows Indicator The Trend Breakout Arrows Indicator is a momentum-based signal tool designed to identify potential bullish and bearish breakout opportunities. It displays clear arrow signals directly on the price chart, helping traders quickly recognize possible trend changes and continuation setups. Up Arrow (Buy Signal) A magenta up arrow appears below a candle when bullish momentum begins to strengthen. This signal indicates that buying pressure may be overtaking selling press
FVG CHANGE INDICATOR Product Description A reliable trend-following indicator that DOES NOT repaint - what you see is what you get! The FVG CHANGE INDICATOR is a professional trend detection system that helps you identify market direction with confidence. Unlike many indicators that change signals after the fact (repainting), this modified version locks in signals on closed bars only, giving you trustworthy entry points you can act on. How It Works The indicator analyzes price action using a uni
Volume Arrow Signal Product Description Volume Arrow Signal is a smart trading indicator designed to help traders identify potential buy and sell opportunities using price action, volume behavior, and directional arrow signals. The indicator places clear arrows directly on the chart, making it easy to spot possible market reversals, trend continuations, and entry opportunities without spending hours analyzing charts manually. Whether you are trading Gold (XAUUSD) , Forex pairs, Indices, or Crypt
Filtro:
Stanislav Melnikov
944
Stanislav Melnikov 2026.06.19 07:47 

L'utente non ha lasciato alcun commento sulla valutazione.

Rispondi alla recensione