RangeDetector mt5
- Indicatori
- Versione: 3.20

A Range Detector Indicator is a technical analysis tool designed to automatically identify when the market is not trending and is instead moving inside a sideways consolidation structure (range). In professional trading systems, it is less about drawing boxes and more about classifying market state: trend vs range.
To understand it properly, you need to see it as a market regime detector, not just a support/resistance tool.
📊 1. What a “range” actually means (core concept)A market is considered to be in a range when:
- Price repeatedly moves between a ceiling (resistance)
- and a floor (support)
- without creating strong directional structure
Mathematically, a range exists when:
- Volatility is compressed
- Directional movement is weak
- Swing highs and lows are “balanced”
In simple terms:
🧠 2. What a Range Detector is really doingBuyers push up → sellers push down → neither side wins → price stays trapped
A proper range detector is not just drawing lines. It is running a multi-condition classification system.
It typically answers 3 questions:
1. Is volatility low enough to be “non-trending”?
2. Are swings failing to break structure?
3. Are highs and lows repeatedly respected?
Only when all conditions agree does it label a range.
⚙️ 3. Core internal components🔹 A. Volatility Filter (foundation layer)
This is the most important part.
It checks whether price movement is “compressed”.
Common tools:
- ATR (Average True Range)
- Standard deviation of price
- Candle body size average
Example logic:
- ATR decreasing → market slowing down
- Small candles clustering → consolidation forming
So:
Low ATR + tight candles = possible range
🔹 B. Swing Structure Detection
The indicator identifies:
- Swing Highs (local peaks)
- Swing Lows (local bottoms)
Then it checks:
In a range:
- Highs are roughly equal
- Lows are roughly equal
- No strong breakout beyond previous swing
This creates a “horizontal structure”.
🔹 C. Market Structure Validation
This is where professional-grade range detectors differ from basic ones.
It checks:
Trend condition (invalidates range):
- Higher highs forming consistently → uptrend
- Lower lows forming consistently → downtrend
Range condition:
- No consistent HH/HL or LL/LH pattern
- Structure alternates instead of progressing
So the indicator is basically asking:
“Is structure progressing or rotating?”
🔹 D. Cluster Formation (range building engine)
Once swings are detected, the indicator groups them into zones:
Resistance zone:
- Multiple swing highs within a small price distance
Support zone:
- Multiple swing lows within a small price distance
This clustering creates:
- A price “band” instead of a single line
🔹 E. Boundary Calculation
Most range detectors compute:
Upper boundary:
- Average or weighted high of swing cluster
- Sometimes highest high in last N swings
Lower boundary:
- Average or weighted low of swing cluster
Advanced versions:
- Use ATR buffer around boundaries
- Use dynamic widening if volatility increases
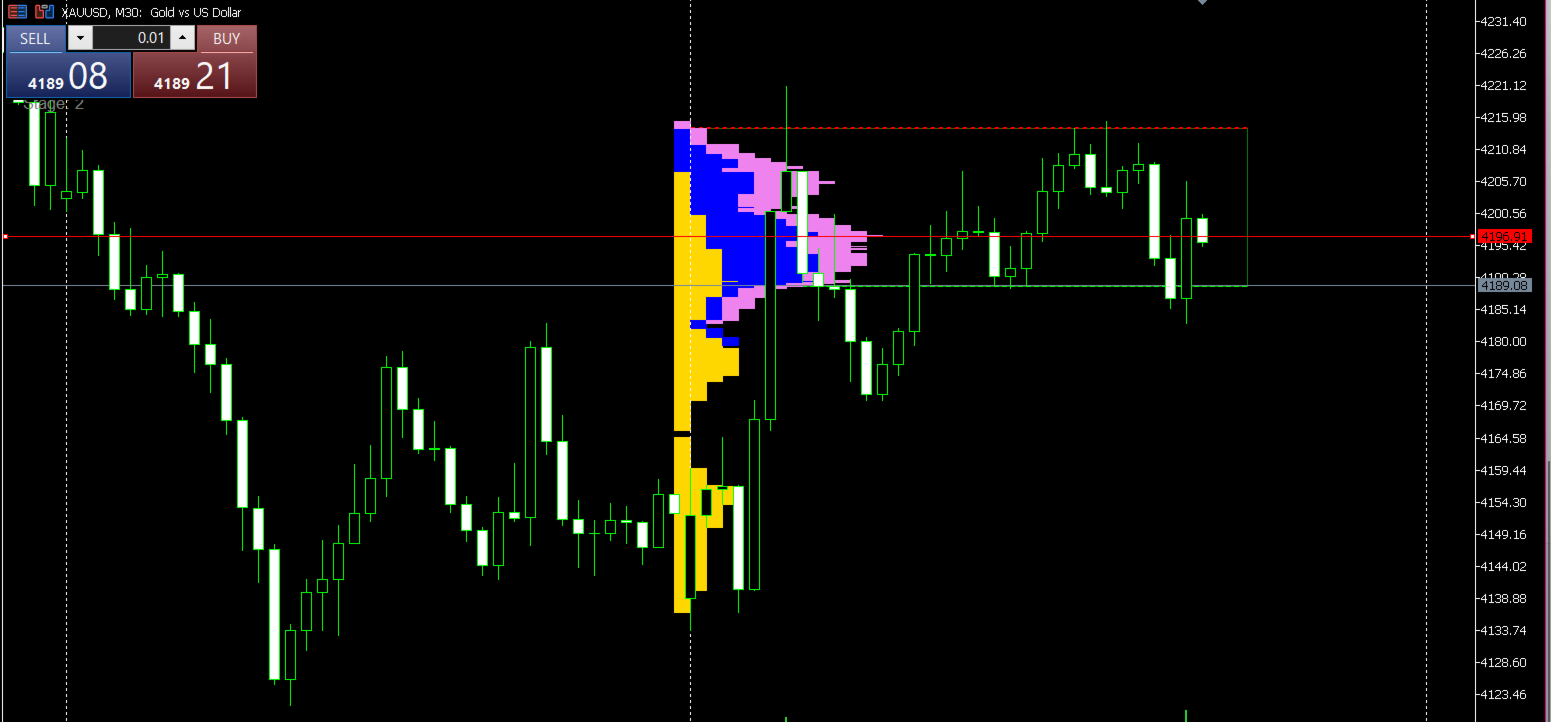
📦 4. What appears on your chart
A fully developed range detector may show:
🟩 Upper resistance zone
🟥 Lower support zone
📦 Rectangle box (range body)
➡️ Forward projection of range
⚪ Breakout trigger line
🔔 Alerts when price exits range
Some advanced systems also show:
- “fake breakout rejection”
- “range strength score”
- “probability of breakout direction”