Strategy Lab
- Utilità
-
Tras Walewein Daly Van Den Broecke
 EA developer with 5+ years on MT5. I post here on topics that come up when actually running EAs day to day, usually with working MQL5 code attached rather than just theory.
 - Versione: 1.0
- Attivazioni: 10
IMPORTANT: Strategy Lab is a web based analytics platform that runs in your browser at https://strategy-lab.co/. This product is not a chart based EA or indicator. Your purchase unlocks Pro tier access to the web platform.
How to get started
- Create a free account on strategy-lab.co. The free tier lets you upload a Strategy Tester HTML report and see the core metrics on your own data, so you can verify the platform delivers value before paying anything.
- Purchase this product on MQL5 Market.
- After purchase, send me a private message through my MQL5 profile with the email address you used on strategy-lab.co. I will manually upgrade your account to Pro tier within 24 hours.
- Once your account is upgraded, follow the setup instructions inside your Strategy Lab dashboard to install and configure the connector EA on your MT5 or MT4 terminal. The EA then syncs your trades and account data into Strategy Lab automatically and continuously, so you never need to upload reports manually again.
Why this matters for every trader and every account
Every algorithmic trader runs into the same problem. You build a strategy, the backtest looks great, you go live, and three months later you are in drawdown wondering whether the strategy is broken, whether you are in a bad patch, or whether the backtest was simply wrong from the start.
The tools most traders rely on to answer that question give wrong or incomplete answers. The Sharpe ratio in your MT5 report is computed per trade, which is mathematically incorrect and typically inflates the real number by a factor of three to five. The drawdown figure tells you what happened once, not whether it is likely to happen again. Win rate tells you nothing about whether your wins outsize your losses. Correlation between your own strategies is invisible to MT5 entirely, even though it is the single biggest source of unexpected portfolio losses.
What this means in practice:
- Running one strategy on a small account? You need to know when the edge is fading. Strategy Lab's live monitoring catches edge decay 5 to 15 days before the drawdown becomes obvious. That is the difference between pausing in time and blowing a prop firm rule.
- Running multiple EAs? You need to know whether your portfolio is actually diversified or whether four EAs are all expressing the same underlying bet. Most "four EA portfolios" turn out to be one trade with extra steps.
- Buying an EA from MQL5 Market? You need to tell a real edge from a curve fitted backtest before you commit your money. The dedicated section below shows exactly how Strategy Lab catches overfit backtests in seconds.
- Trading a funded account or running client money? You need defensible numbers. "It worked in the backtest" is not an answer when something goes wrong.
Account size does not change any of this. A 1000 USD account with a curve fitted strategy fails for the same reasons a 1 million USD account fails. The only difference is how much money you lose while finding out.
What Strategy Lab actually does
Strategy Lab takes the trade data from your MT5 account (or from a Strategy Tester report) and runs the kind of analytics that institutional desks use to evaluate strategies. Most retail traders never build these themselves because doing it correctly takes weeks and the math is unforgiving.
Upload a Strategy Tester HTML report or connect a live account. The platform handles the rest.
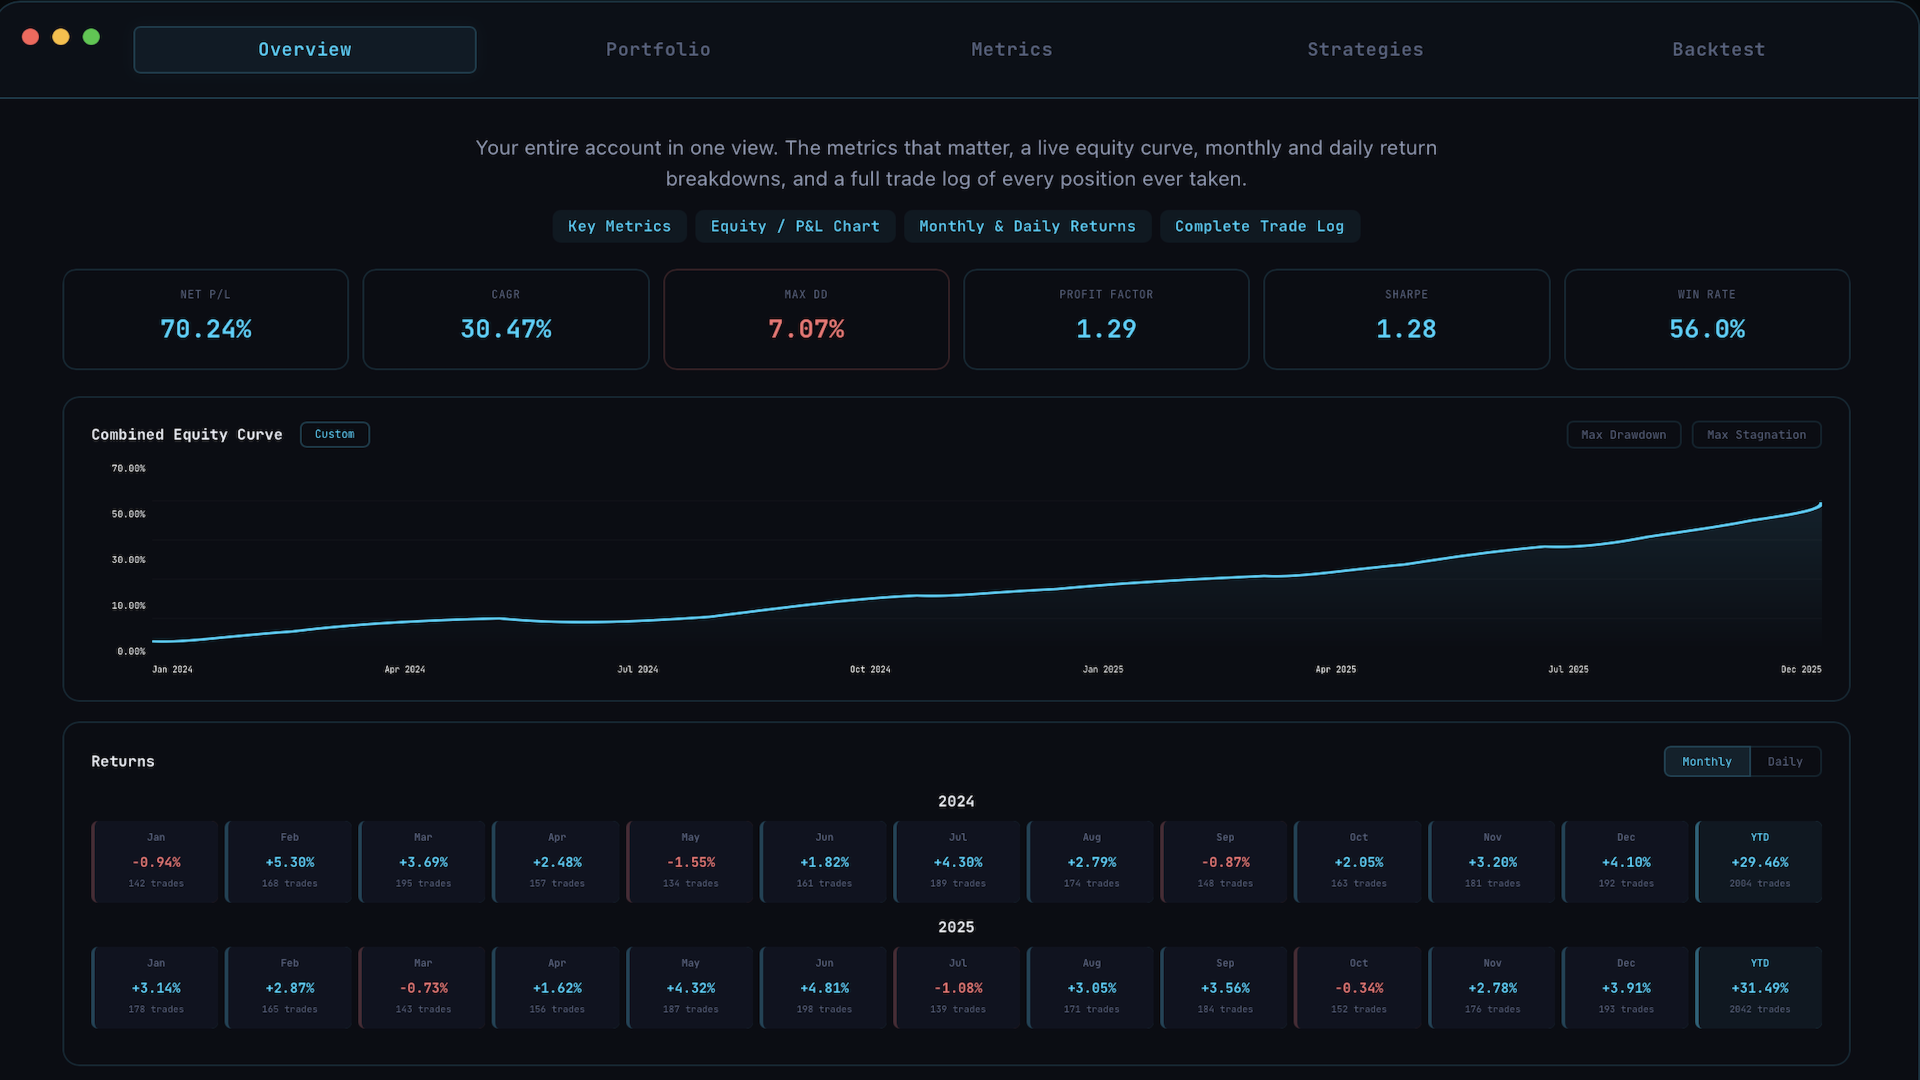
Full metrics suite
Each metric below comes with a plain language explanation of what it measures, when to trust it, and when to ignore it. No black box.
- Sharpe ratio computed the correct way. Daily equity returns, excess over the risk free rate, properly annualised. Not the per trade version most platforms default to, which inflates the real number significantly.
- Sortino ratio with proper downside deviation. Many implementations on the market are just Sharpe with the variable renamed, which makes the metric meaningless. Strategy Lab computes it correctly.
- Calmar, Burke, and Omega ratios. Different angles on the same question: how much return per unit of drawdown pain. Each has a use case and Strategy Lab tells you which one applies to your strategy profile.
- Deflated Sharpe ratio. Corrects for the fact that backtesting many parameter combinations naturally produces some that look good by chance. Critical when evaluating strategies you optimised.
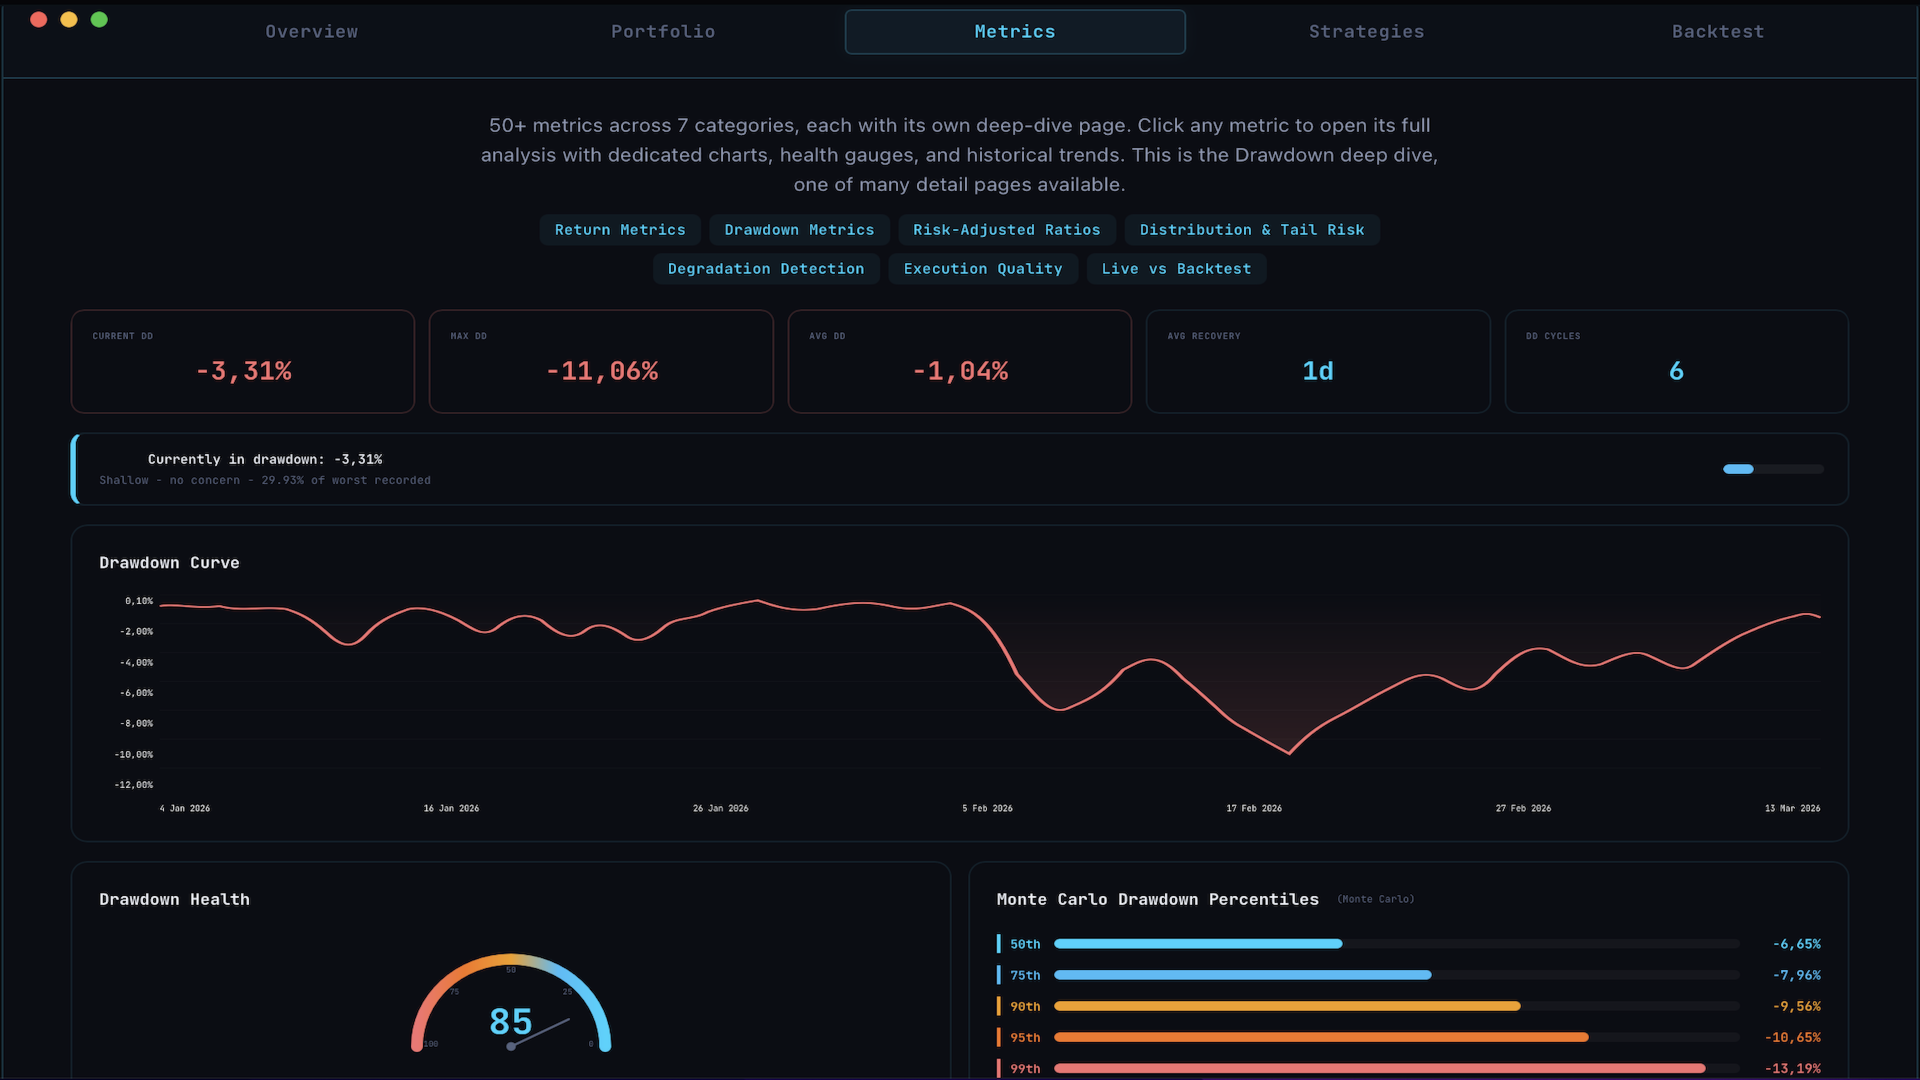
- VaR and CVaR at 95 and 99 percent confidence levels. Tells you the worst day or worst week you should statistically expect, computed both from historical data and from distributional assumptions.
- Drawdown decomposition. Beyond just max DD: average drawdown, time underwater, recovery factor, drawdown frequency. Together these tell a much fuller story than one number ever can.
- Win rate, profit factor, payoff ratio. The basics, computed correctly and shown alongside the metrics above so you see the full picture in one place.
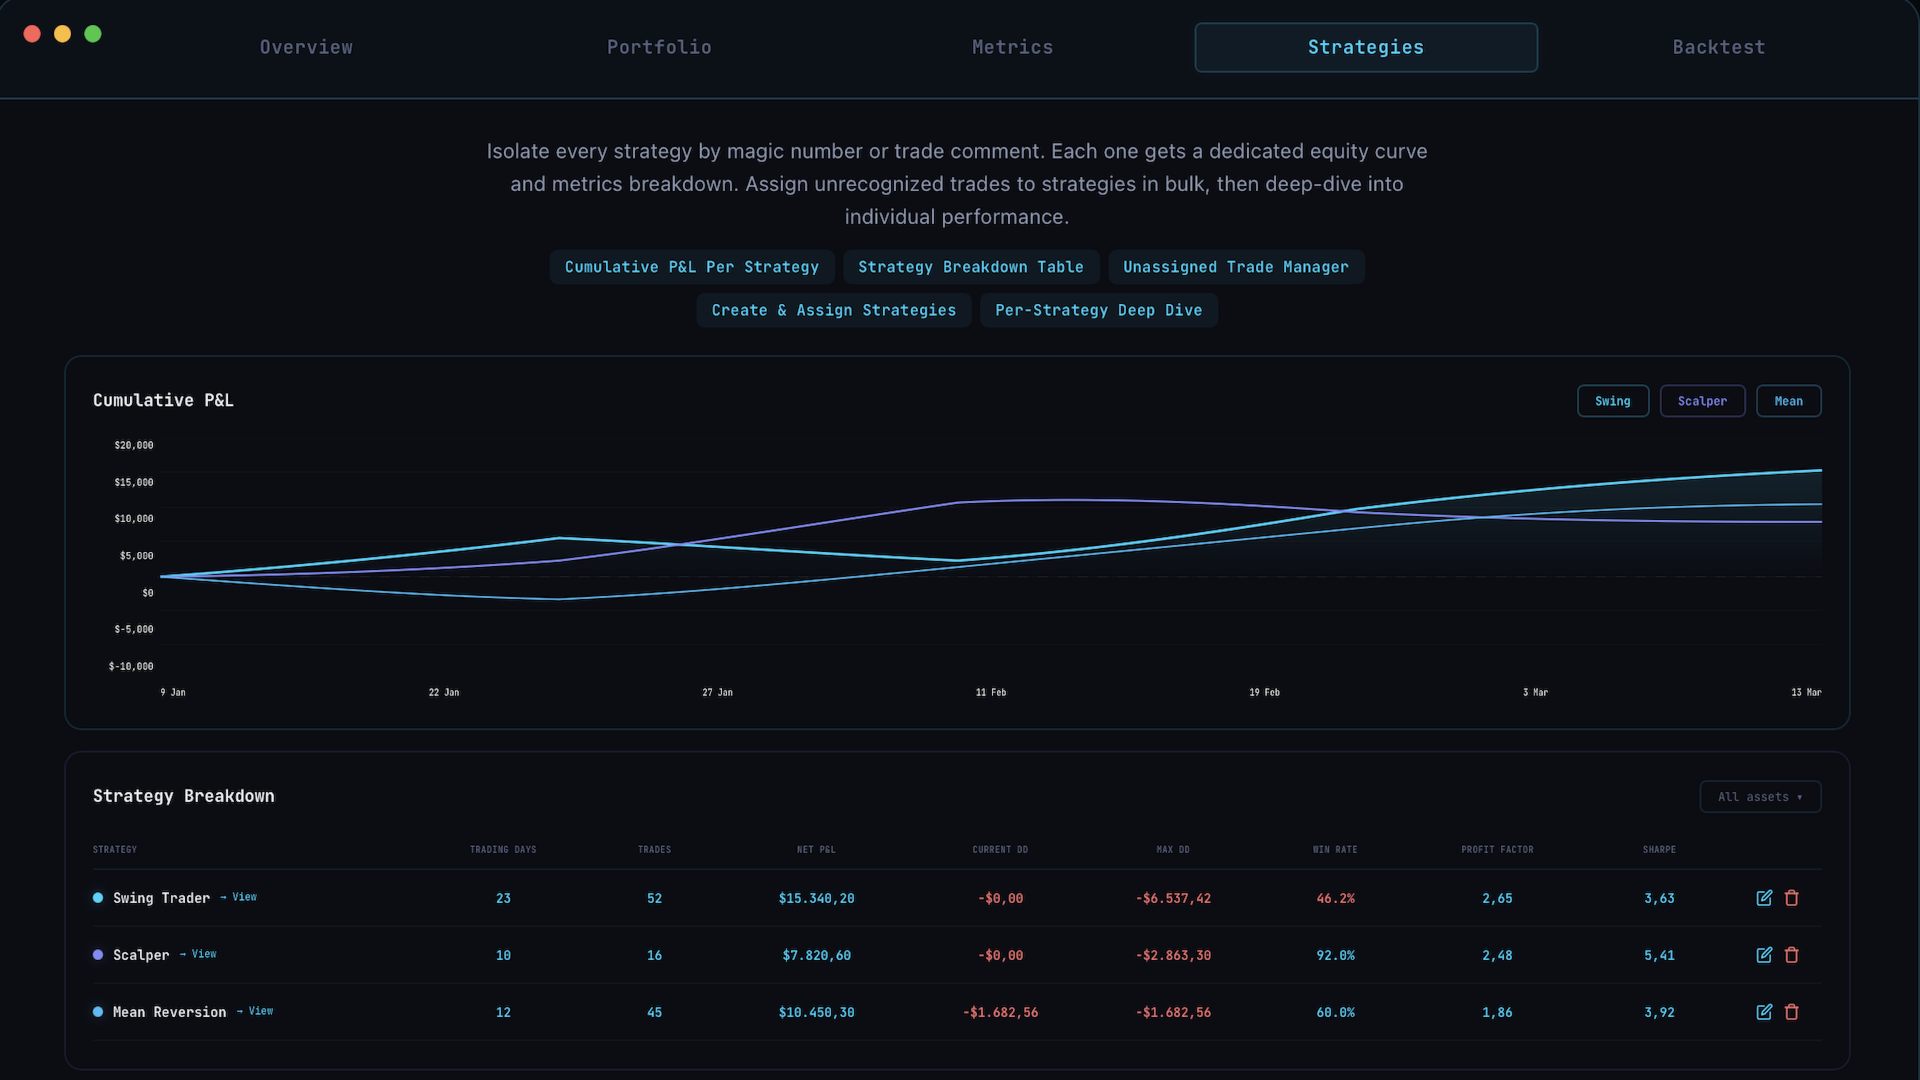
Strategy splitting
If your account runs multiple strategies, Strategy Lab splits them out and analyses each leg separately. Filter trades by magic number or comment, sort them however you want, and see exactly how each strategy performs on its own.
The blended equity curve hides which strategy is actually pulling its weight. Splitting is usually where the real insight comes from. Many users discover one leg is silently dragging down an otherwise strong portfolio, or that a leg they thought worked is being rescued every month by a different one.
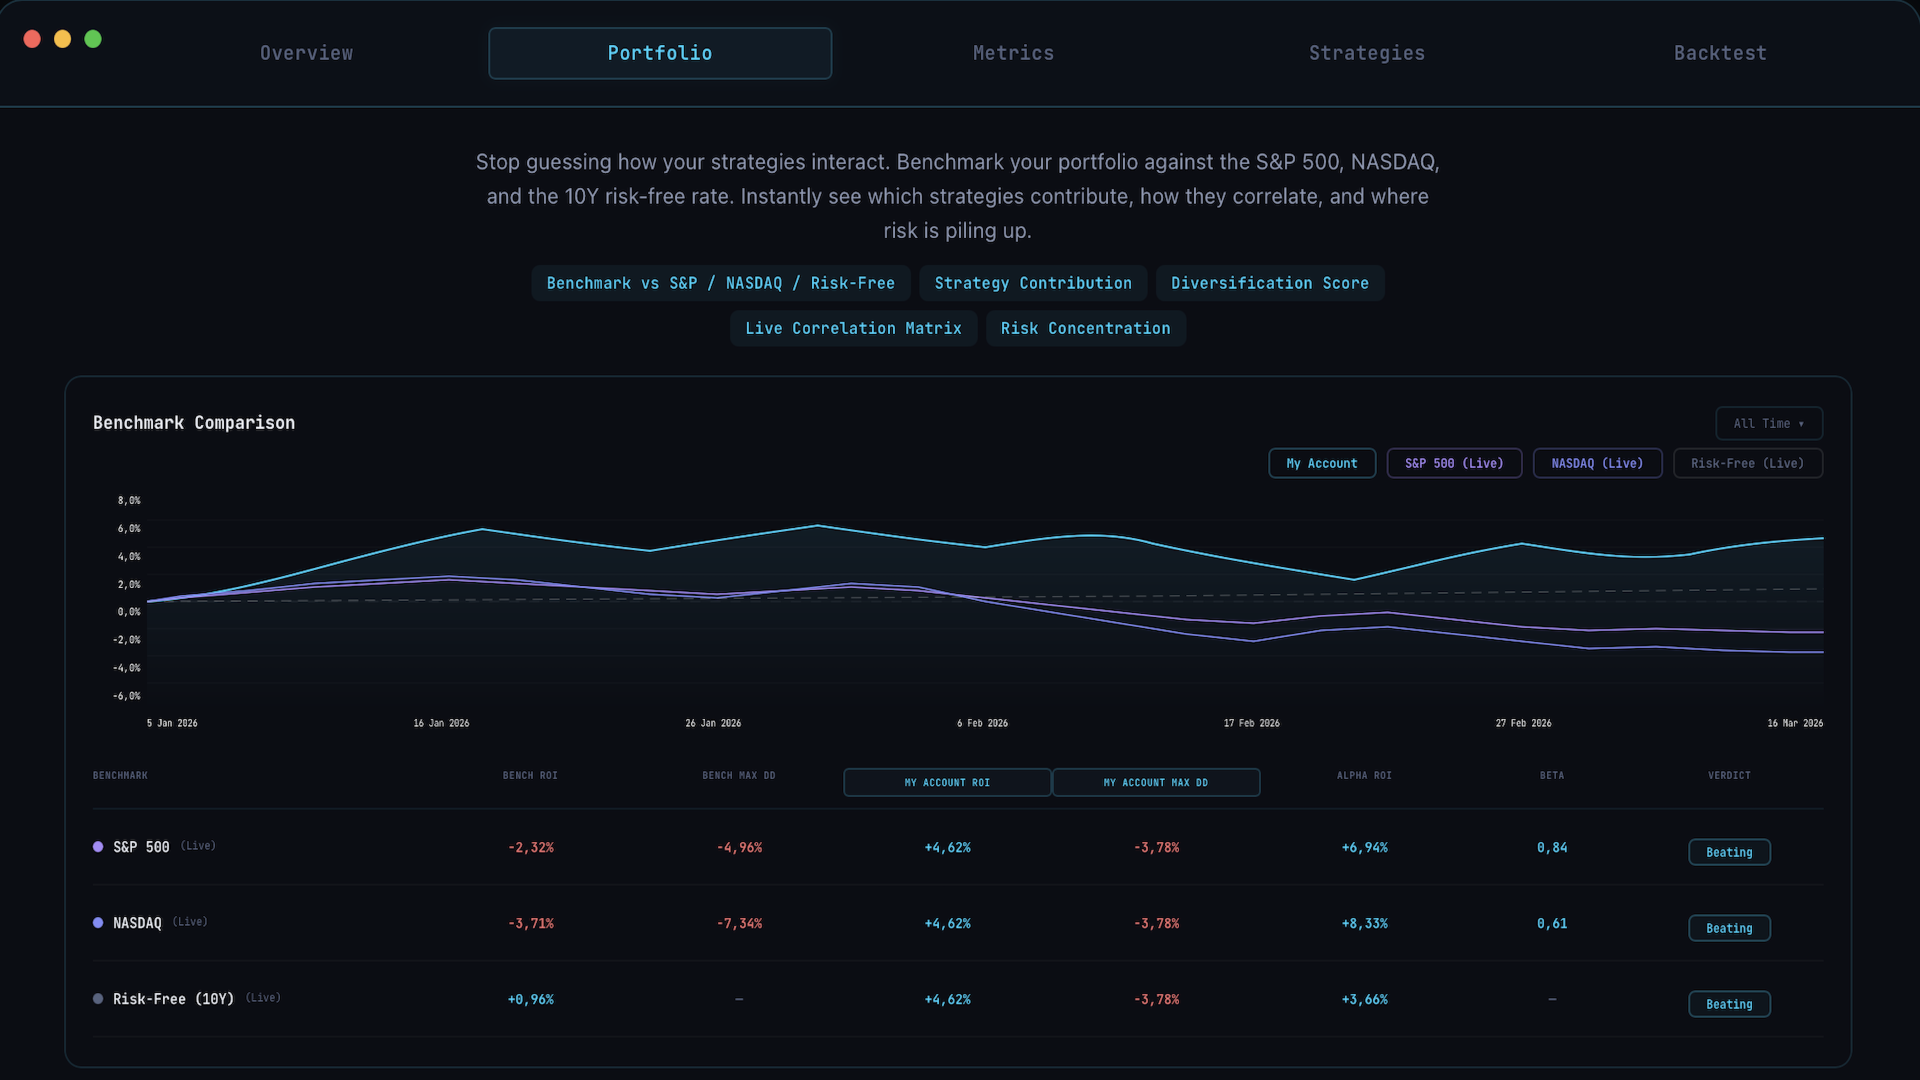
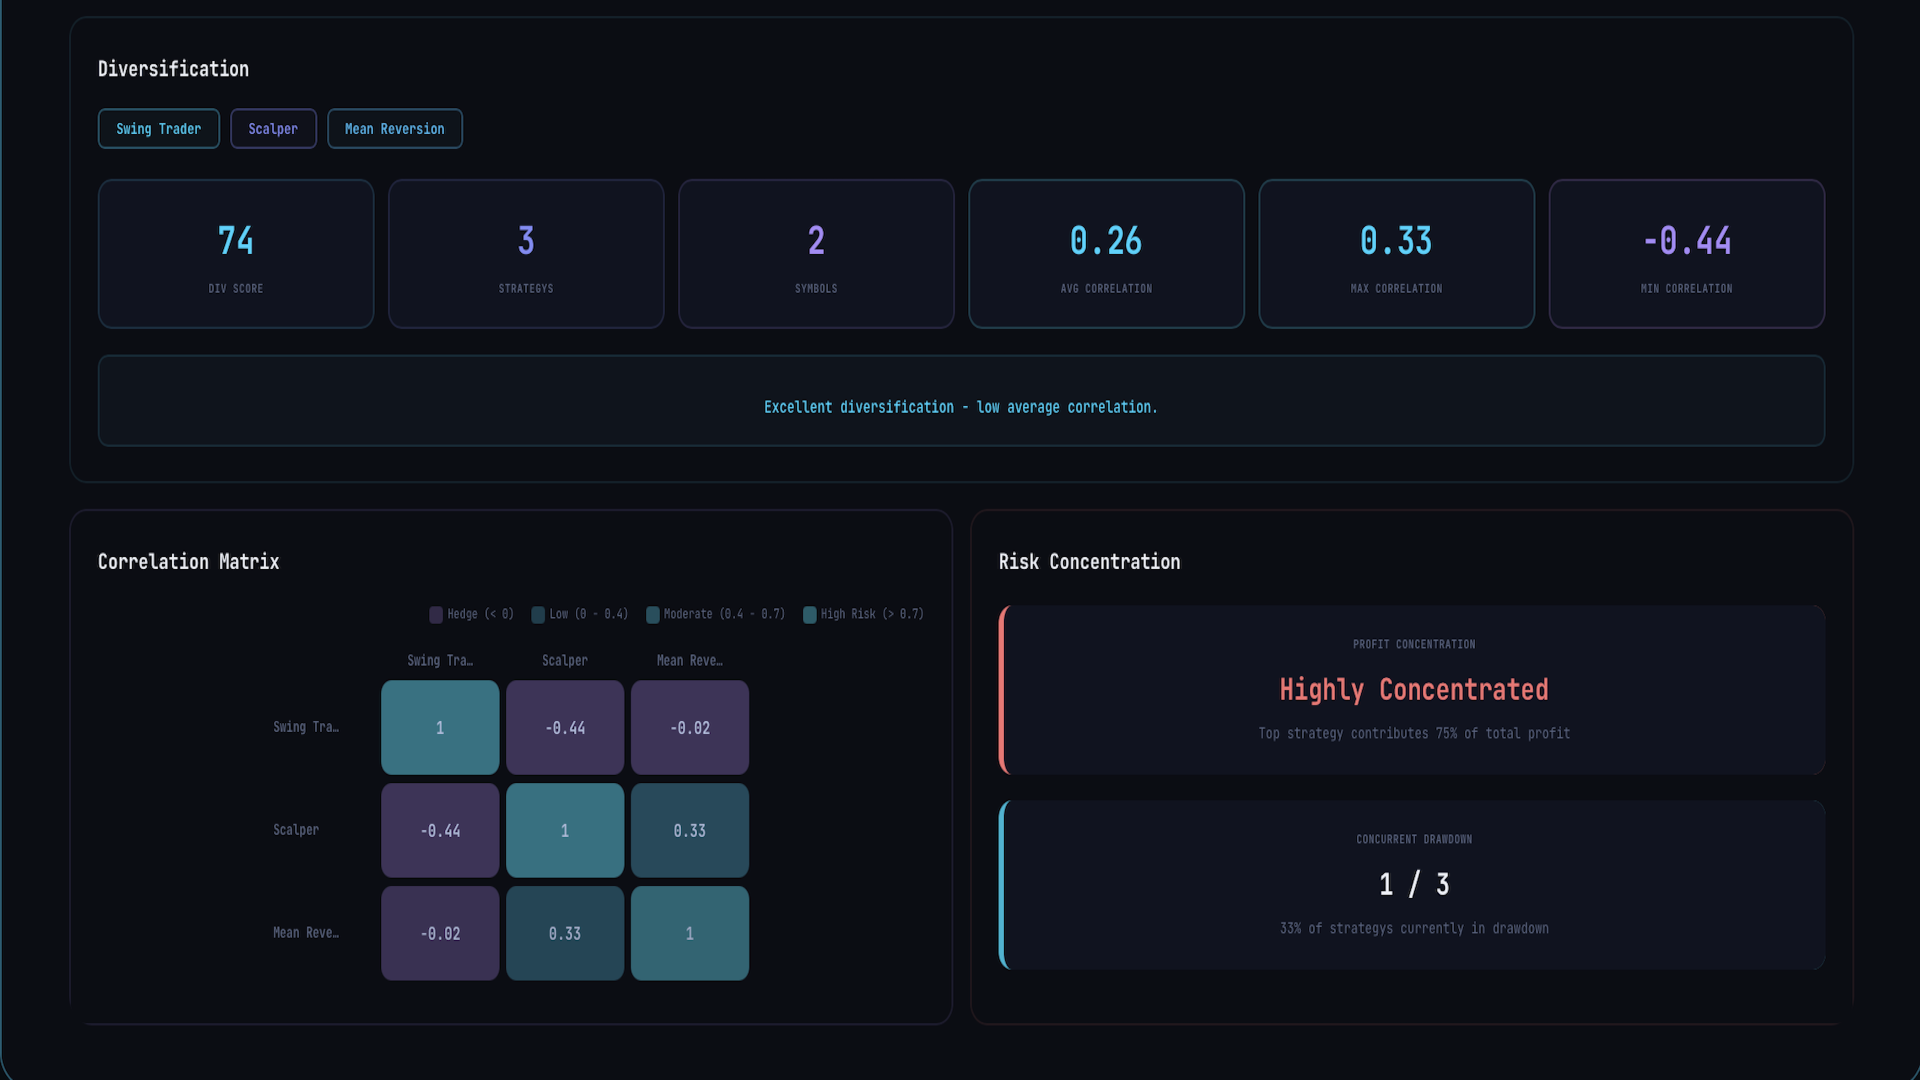
Portfolio analytics
For multi EA setups:
- Pairwise correlation matrix. Shows you whether your strategies are actually independent or whether they move together in a crisis. Computed on the intersection of trading days, which avoids the bias toward zero that most naive implementations suffer from.
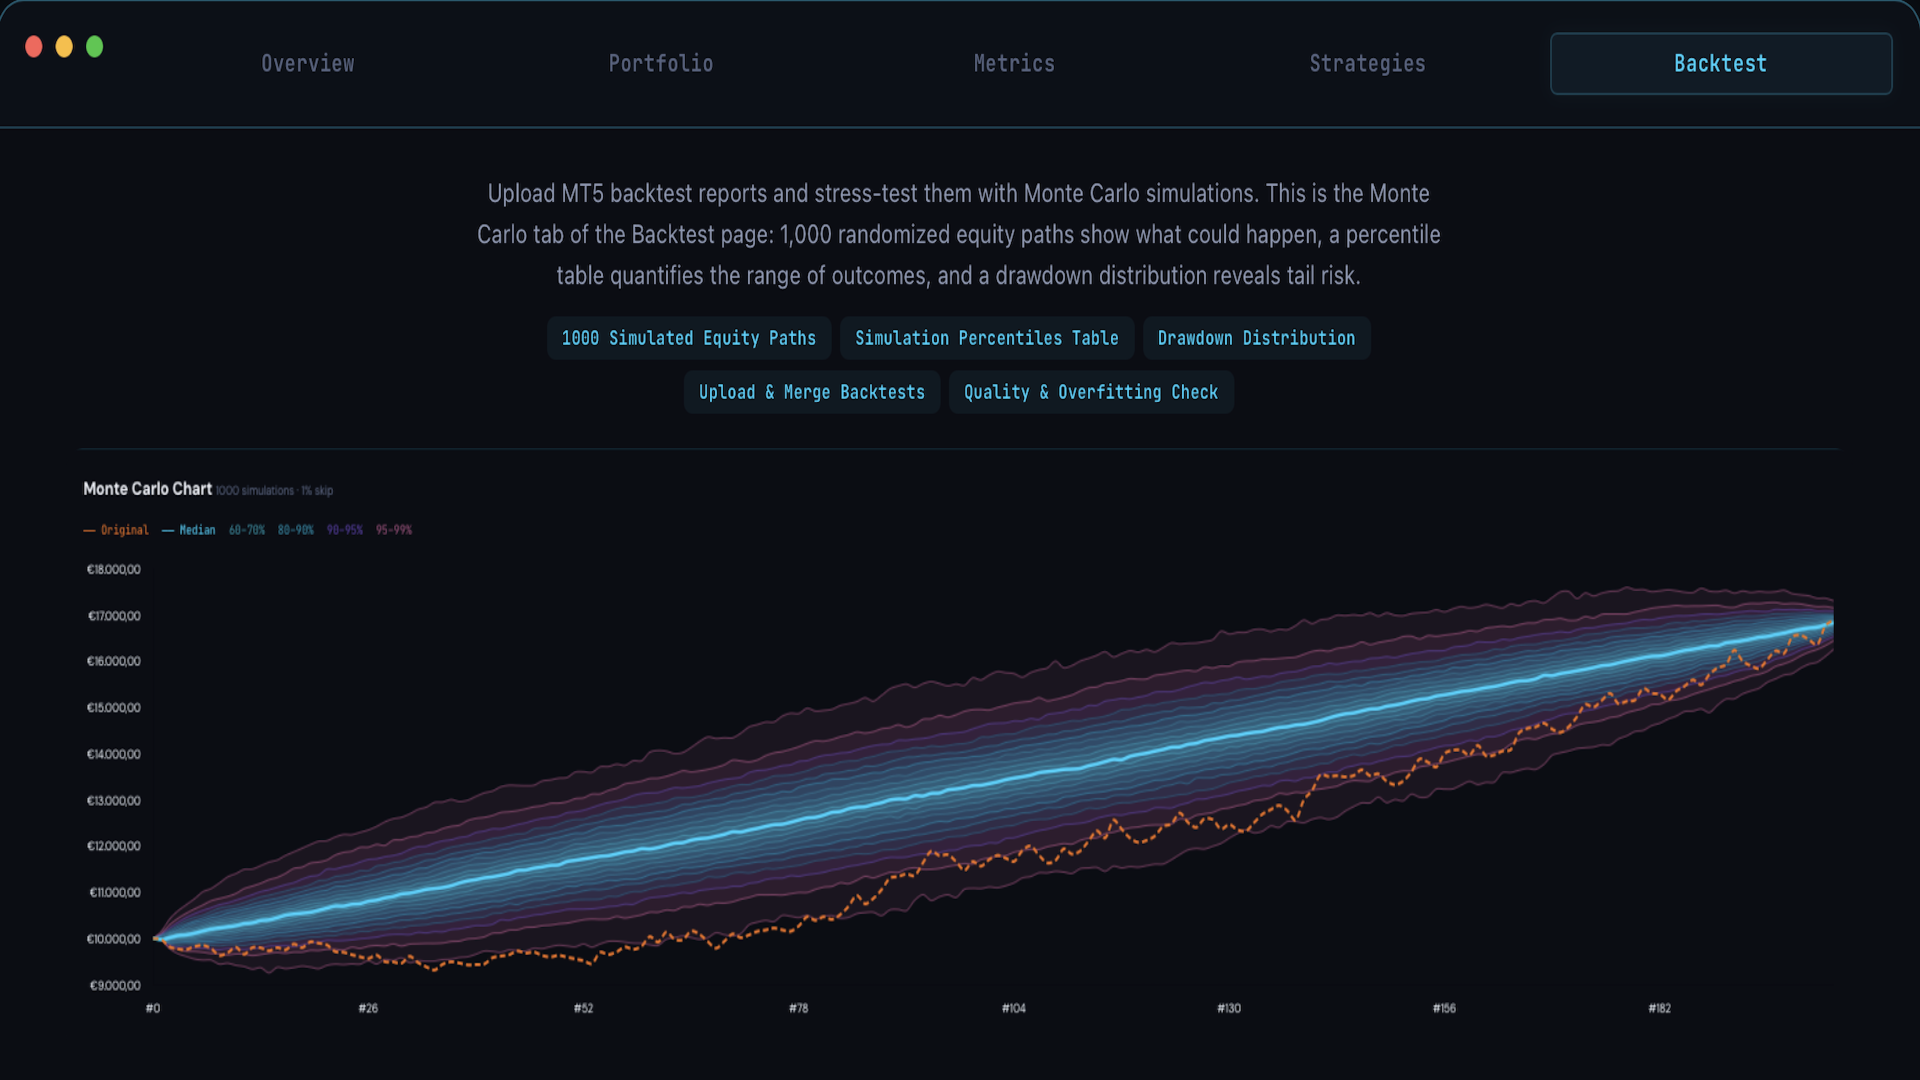
- Monte Carlo portfolio simulations. Generates thousands of possible equity paths to show the full range of plausible outcomes, not just the one that happened in your backtest.
- Stress tests against historical risk off windows (March 2020, August 2024 carry unwind, recent USD spikes). Shows what your portfolio would have done in known crisis periods, even if your backtest does not cover them.
Live monitoring
Once the connector EA is running on your terminal, every trade you take flows into Strategy Lab automatically. No manual exports, no daily uploads, no maintenance work on your part.
Vet any EA backtest before you buy it on Market
A significant share of EAs sold on MQL5 Market have backtest reports that look spectacular but collapse in live trading. The cause is almost always the same: the strategy was optimised so heavily on historical data that it stopped describing reality. The backtest fits the past so well that there is no edge left for the future. Whether the seller realised it or not, the buyer ends up holding the loss.
You can catch most of these before paying. Run the Strategy Tester backtest in mt5 and upload it to Strategy Lab. The platform runs the standard battery of overfitting tests in seconds:
- Deflated Sharpe ratio that corrects the headline Sharpe for the number of parameters that were optimised during development. Many EAs with a reported Sharpe of 4 collapse to a deflated Sharpe of 0.6 once corrected. That tells you the result is parameter mining, not a real edge.
- Trades per parameter check. A statistically meaningful backtest needs at least 30 trades per optimised input. An EA with 5 inputs and 80 backtest trades is curve fitted by definition. Strategy Lab flags this automatically.
- Equity curve shape analysis. Real edges have drawdowns. Backtests that are too smooth (no losing months, longest losing streak under 3 trades, monotonically rising equity) get flagged as suspicious.
- Bootstrap percentile rank. Resamples the trade results in random order thousands of times to test whether the equity curve was lucky in its sequence or actually produced by a stable edge.
You get a clear assessment of whether the backtest holds up, plus the specific numbers behind it so you can decide for yourself. A few minutes of analysis can save you from a 100 to 1000 USD mistake on a single EA, never mind the slippage and account damage of running a broken strategy live.
Who benefits most
- Buyers on MQL5 Market who want to vet an EA backtest before committing money.
- Prop firm runners who need to spot edge decay before tripping a kill rule.
- Portfolio managers tracking real diversification rather than perceived diversification.
- Anyone who has looked at their balance and noticed it does not actually answer the question "should I trust this in live trading".
What this product is not
- Strategy Lab does not optimise your EA. Optimisation belongs in MetaEditor or a dedicated framework.
- It does not generate signals or trade for you. It analyses what you already do.
- It does not promise better returns. It promises clearer answers about the returns you already have.
Support and Pro upgrade
For Pro tier upgrades after purchase, send a private message through my MQL5 profile with the email address registered on your strategy-lab.co account. Upgrades are processed within 24 hours.
For bug reports, feature requests, or technical questions: message me through MQL5 or via the in app support channel at https://strategy-lab.co/. Response time is typically within 24 hours.