Pivot RPS

5

Pivot Point Multi-Method with Dashboard

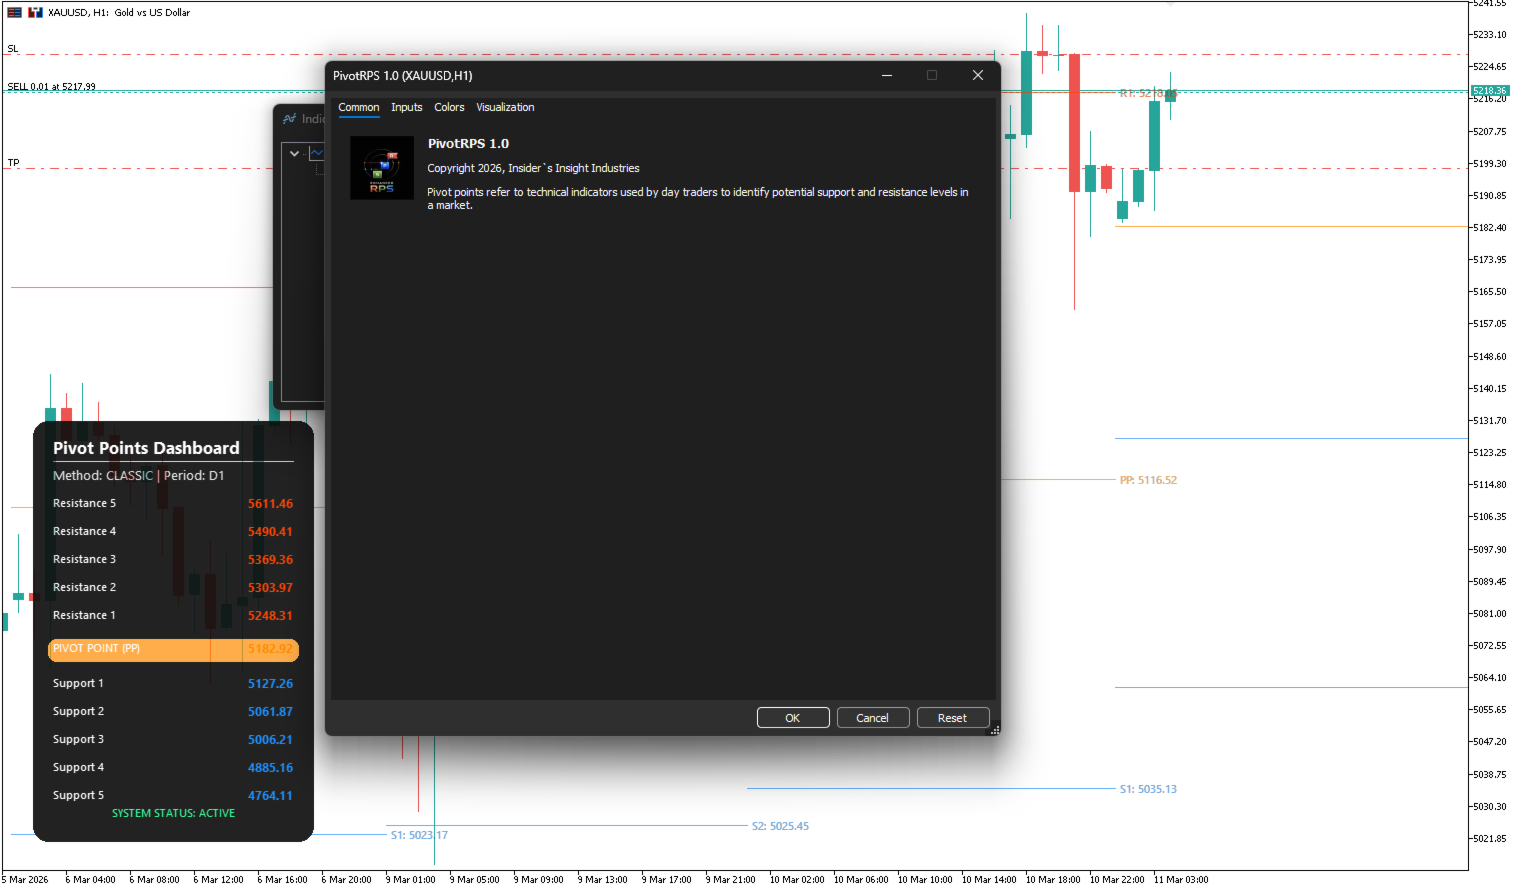
This indicator is a technical analysis tool designed to calculate and display horizontal support and resistance levels based on various Pivot Point methodologies. It is built using the MQL5 Canvas library, ensuring efficient performance and a clean visual presentation on the chart.

The tool calculates levels using the data from the previous completed candle of a user-defined reference timeframe. This ensures that the levels remain fixed for the duration of the current period, providing consistent points of reference for market analysis.

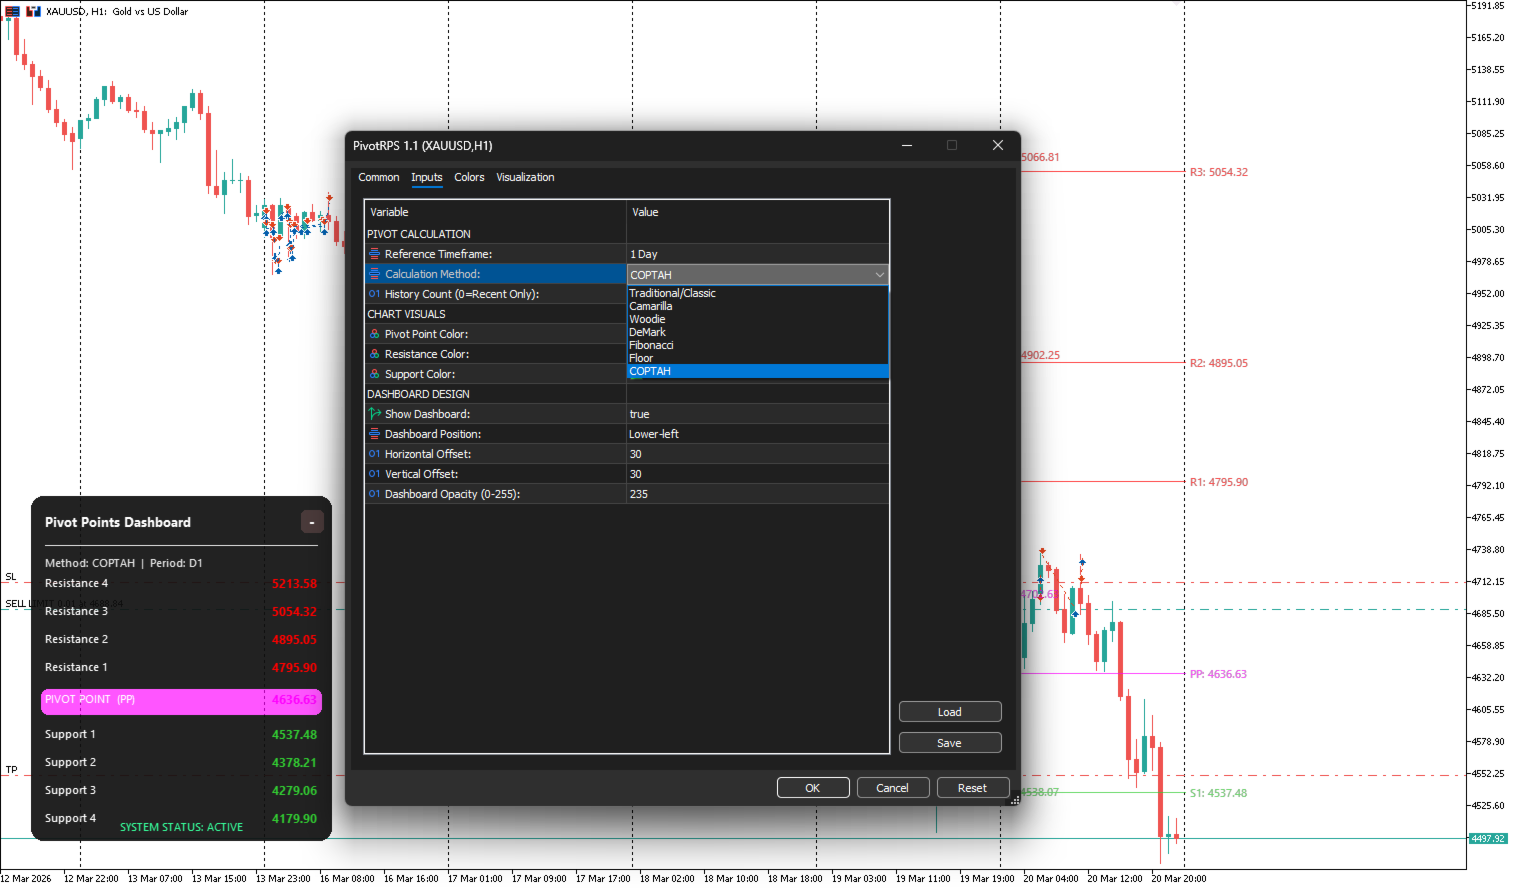
Calculation Methodologies

The indicator includes five standard mathematical models for pivot point calculation:

  • Classic/Traditional: The standard formula using High, Low, and Close.

  • Camarilla: Focuses on a range-based approach with specific coefficients for R1-R5 and S1-S5.

  • Woodie: Places additional weight on the opening price of the current period.

  • DeMark: Provides a different approach based on the relationship between the open and close prices.

  • Fibonacci: Uses the range multiplied by specific Fibonacci ratios (0.382, 0.618, etc.).

  • Floor: to identify potential support and resistance levels based on the prior period's high, low, and closing prices. They represent a "pivot" or turning point for market sentiment, helping to determine potential reversals or breakouts for the current trading day.

  • COPTAH pivot

Key Features

  • Multi-Timeframe Integration: Users can choose a reference timeframe (e.g., Daily, Weekly, Monthly) regardless of the timeframe currently applied to the chart.

  • Automated Visibility Logic: To maintain chart clarity, the indicator automatically hides its visual elements if the chart timeframe is equal to or higher than the selected reference timeframe.

  • Historical Data Display: The indicator allows the display of a user-defined number of past pivot periods. Each period is drawn within its respective timeframe boundary to avoid overlapping and visual clutter.

  • Native Canvas Rendering: Instead of using thousands of standard chart objects, the indicator renders all lines and text onto a single bitmap layer. This significantly reduces CPU and GPU load, especially when viewing extensive historical data.

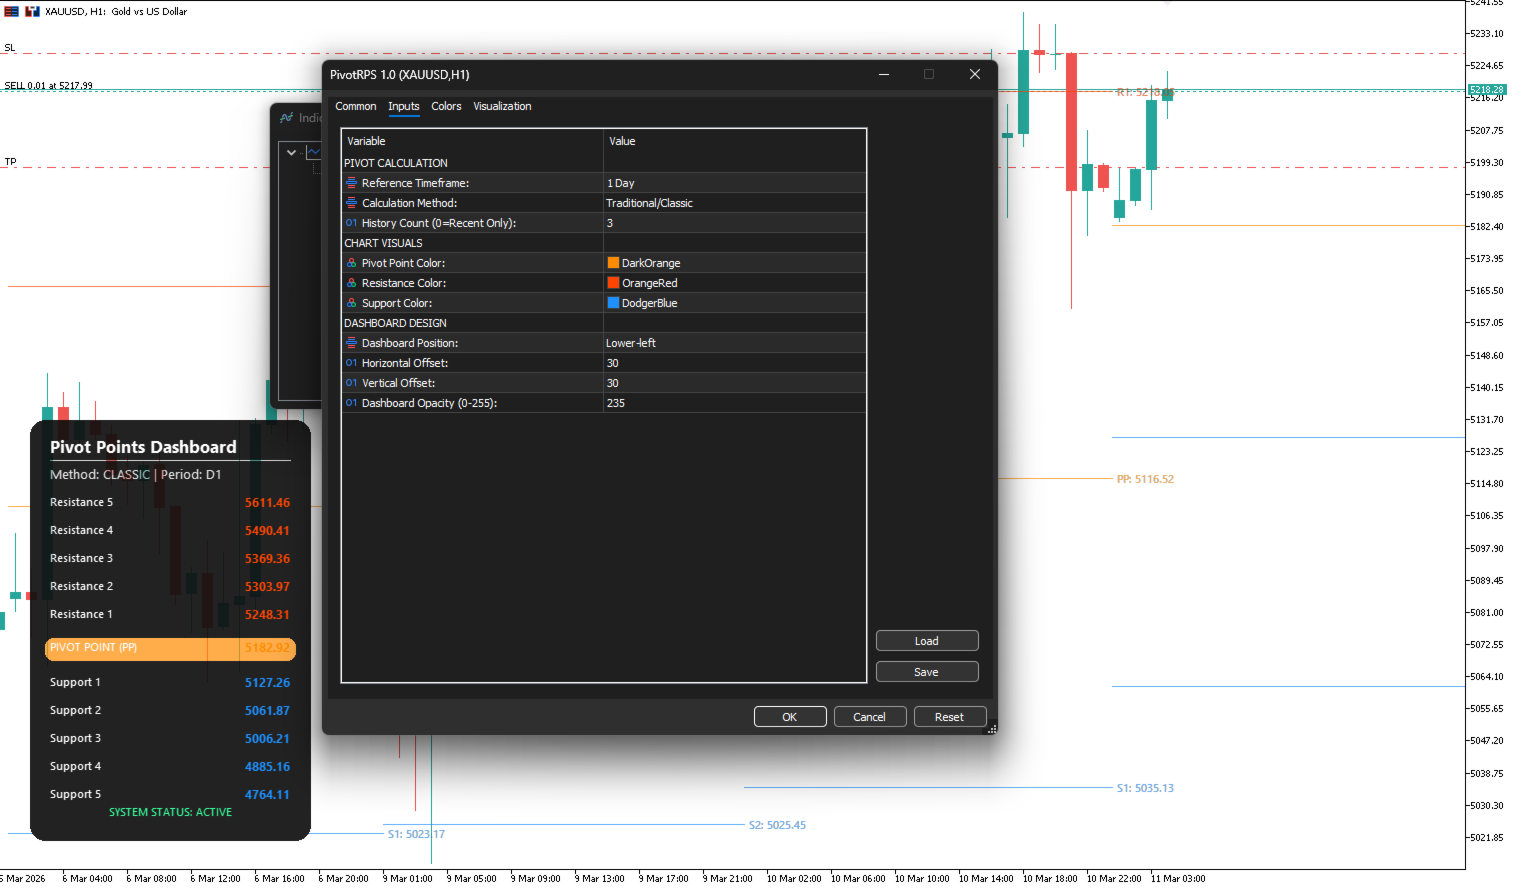
  • Interactive Dashboard: A professional graphical interface displays the current level prices in real-time. The dashboard features a modern "cardboard" design with rounded corners and semi-transparent backgrounds.

  • Dynamic Placement: The dashboard can be moved to any of the four corners of the chart window with adjustable horizontal and vertical offsets to suit individual workspace layouts.

User Settings and Customization

  • Pivot Settings: Select the calculation method and the reference timeframe.

  • History Limit: Choose how many previous periods to visualize on the chart history.

  • Color Configuration: Separate color inputs for Pivot Point (PP), Resistance levels (R1-R5), and Support levels (S1-S5).

  • Interface Customization: Adjust the dashboard's corner position, X/Y offsets, and opacity levels.

  • Label Precision: All prices are displayed according to the instrument's digit precision.

Performance Optimization

The use of the CCanvas class ensures that the terminal remains responsive even during high market volatility or when multiple instances of the indicator are applied. By utilizing bitmap rendering, the indicator manages complex drawings while maintaining a low resource footprint.

Parameters

  • Reference Timeframe: Timeframe used as the basis for calculation (e.g., PERIOD_D1).

  • Calculation Method: Choice between Classic, Camarilla, Woodie, DeMark, or Fibonacci.

  • History Count: Number of historical periods to show (0 = current only).

  • Dashboard Position: Corner placement (Upper Left, Upper Right, Lower Left, Lower Right).

  • Opacity: Transparency level for the graphical dashboard background.


Recensioni 5
Findolin
2420
Findolin 2026.03.13 19:34 
 

Excellent! Thank you so much! Small suggestion: It would be good if you could also turn off the dashboard.

wilkyang2781
60
wilkyang2781 2026.03.12 02:16 
 

One of the best indicator from one of the best creator

Prodotti consigliati
This indicator is a **Pivot-Confluence Zone Identifier** that focuses exclusively on identifying key support and resistance levels where price clusters align with classic pivot points. Here's what it does: ## Core Functionality **Pivot Confluence Detection**:  - Only displays price zones that align with classic pivot point levels (R1, R2, R3, S1, S2, S3) - **Excludes the main pivot point** - focuses only on support and resistance levels - Uses a configurable pip range to detect confluence nea
FREE
The CPR (Central Pivot Range) Indicator is a powerful technical analysis tool designed to identify key support and resistance levels on your MetaTrader 5 charts. It calculates the Central Pivot (CP) as the average of the previous day's high, low, and close prices, providing a central reference point. Calculates and plots 11 pivot levels (CP, BC, TC, S1-S4, R1-R4) Adjustable lookback period (default: 5 days) Option to show or hide price labels with customizable size and offset Fully customizable
FREE
Camarilla Swing Trade Indicator is an Indicator. Support and resistance points are calculated from the High Low Close of the previous TF Week's price. What are Camarilla Pivot Points? 1.Camarilla Pivot Points is a modified version of the classic Pivot Point. 2.Camarilla Pivot Points was launched in 1989 by Nick Scott, a successful bond trader. 3.The basic idea behind Camarilla Pivot Points is that price tends to revert to its mean until it doesn't. 4.Camarilla Pivot Points is a mathematical pr
FREE
Raymond Cloudy Day
The Hung Ngo
5 (3)
Raymond Cloudy Day Indicator for MT5 – Pivot-Based Reversal and Trend Levels Raymond Cloudy Day Indicator is a pivot-based level indicator for MetaTrader 5 (MT5). It was developed by Ngo The Hung based on Raymond’s original idea and is designed to give a structured view of potential reversal zones, trend extensions and support/resistance levels directly on the chart. The default settings are optimised for XAUUSD on the H1 timeframe, but the indicator can be tested and adjusted for other symbols
FREE
Pivots Lines
Abakou Nazaire Ayelenou
5 (1)
Disegna i punti pivot Traditionnal, Fibonacci, Woodie, Classic, Demark, Camarilla per qualsiasi timeframe Supporta tutti i tipi di pivot Traditionnal, Fibonacci, Woodie, Classic, Demark, Camarilla Supporta qualsiasi timeframe (M1...H1...D1...MN1...Annuale) Supporto server ora legale Supporta la sezione giornaliera del forex dall'apertura di Sydney alla chiusura degli Stati Uniti Supporta il trading di criptovalute Riempi il divario tra il pivot e la tendenza, molto utile I punti pivot mostran
FREE
Drawing Parabolic Channels
BeeXXI Corporation
5 (6)
Convenient drawing of parabolic channels by four points (two lower and two upper extremums). Additional control keys: N (New) - Start drawing a new channel. C (Clear) - Deletes the current channel. By default, the current channel is the last channel. But you can click on the line of any channel to make it current. Click on the gear in the upper right corner to set some parameters for all channels or the current channel. All work is visible from the animated Gif. Do not forget to express your w
FREE
This indicator is stand alone version from  MP Pivot Levels  (All in one) containing Woodie Pivots. Woodie’s pivot points are made up of multiple key levels, calculated from past price points, in order to frame trades in a simplistic manner. The key levels include the ‘pivot’ itself, and multiple support and resistance levels (usually up to three each). Traders use these levels as a guide for future price movements when setting up trades. The pivot : (Previous high + previous low + 2 x previous
FREE
Golden Delta Library — Free MT5 Tools Market Description Short Description Golden Delta Library is a free MT5 toolkit for traders who want cleaner chart structure, Renko-based context, risk planning, and practical execution panels. The collection includes Renko indicators, SuperTrend / ADX Renko variants, XAUUSD helper panels, and RiskLab TradeDesk tools. Each product is designed to be lightweight, visual, and useful on live charts without promising automated profits or replacing trader judgme
FREE
The utility draws pivot levels for the selected timefram in classic method. Pivot = (high + close + low) / 3 R1 = ( 2 * Pivot) - low S1 = ( 2 * Pivot) - high R2 = Pivot + ( high - low ) R3 = high + ( 2 * (Pivot - low)) S2 = Pivot - (high - low) S3 = low - ( 2 * (high - Pivot)) you can change the timeframe, colors and fontsize. also you can change the text for the levels. Have fun and give feedback...
FREE
Time Box Indicator MT5
Young Ho Seo
4.67 (3)
Introduction To Time Box Indicator Time Box Indicator is a must have indicator for any trader. It will display daily, weekly and Monthly box according to your preferences. Yet, you can extend any important price levels in your chart automatically. You can use them as the significant support and resistance levels. It is very simple but effective tool for your trading. Graphic Setting Use White Chart Line Style for Current Open price Daily Setting Update Timeframe for daily box Number of days to
FREE
The   Pivot Point indicator   automatically calculates and displays the pivot point line and support and resistance levels. Pivot can be calculated according to the Classic, Floor, Fibonacci, Woodie, Camarilla or DeMark formula. It is also possible to select the period for calculating the indicator. A trader can choose from daily, weekly, monthly, or user-defined periods. Types of pivots Classic Floor Fibonacci Woodie Camarilla DeMark Main features The indicator shows the current and historic
FREE
Pivot Points Buy Zones
Nils R M Peleman
4.86 (7)
Detailed Description: The   Pivot Points Indicator   is designed for traders who rely on pivot points, midpoints and support/resistance levels for their trading strategies. By automatically calculating and plotting these levels (based on   the   previous period's high, low, and close prices) , the indicator provides a clear, visual representation of critical price areas where the market may reverse or break out.The tool is particularly useful for day traders and swing traders looking to base th
FREE
Auto Fibonacci Retracement Indicator — Flexible and Reliable This isn’t just another Auto Fibonacci Retracement indicator. It’s one of the most flexible and dependable tools available . If you find it useful, please consider leaving a review or comment — your feedback means a lot! Check out my other helpful tools below: Smart Alert Manager   - Set up advanced alerts and send them to Mobile, Telegram, Discord, Webhook... Timeframes Trend Scanner    - Scan the trend of assets in difference timefr
FREE
React Fibonacci Chart
Kim Yonghwa
4.75 (12)
Funzionalità Indicatore per il Trading di Ritrazione di Fibonacci Viene disegnato un grafico di Fibonacci basato sulla barra precedente selezionata tra 1H, 4H, 1D e 1W. Quando il prezzo di mercato tocca il livello di Fibonacci, il colore cambia e viene visualizzato l'orario del tocco. Il grafico di Fibonacci è disegnato ai livelli -23.6, 0, 23.6, 38.2, 50, 61.8, 76.4, 100 e 123.6, e il grafico si aggiorna quando la barra viene aggiornata. Variabili Intervallo di tempo: Un grafico di Fibonacc
FREE
VWAP Anchor Tool
Jackson Mukurani Wanguthi
Anchored VWAP is a lightweight, interactive volume-weighted average price indicator designed for traders who need precision without clutter. Unlike standard VWAP that resets every session, this tool lets you drop up to five custom anchors directly on any candle. Each anchor calculates VWAP from that exact point forward, complete with standard deviation bands to highlight where price may find support or resistance relative to volume. Key Features: • Up to 5 simultaneous anchors — compare multi
FREE
Macro-R Pro Signal — Advanced Trading Signal Indicator Macro-R Pro Signal is a professional trading indicator designed to deliver high-quality BUY and SELL signals with enhanced precision and reduced market noise. By combining Bollinger Bands, RSI, and adaptive volatility filtering , this indicator helps traders identify high-probability reversal points while avoiding unfavorable market conditions. How the Strategy Works This indicator is built on a mean reversion + momentum confirmation concep
FREE
AliPivot Points is a Meta Trader 5 Indicator that draws you the latest pivot points. You can choose from timeframes ranging from 1 Minute to 1 Month. Calculation methods for pivot points includes: Classic Pivot Points Camarilla Pivot Points Fibonacci Pivot Points Woodie Pivot Points You can personalize the line colors, style, and width to suit your preference. The indicator displays values on the right side of the chart. AliPivot Points values can also be utilized by developers for creating Expe
FREE
This indicator is stand alone version from  MP Pivot Levels  (All in one) containing Demark's Pivots. Calculations:     PP = X / 4     R1 = X / 2 - LOWprev     S1 = X / 2 - HIGHprev Uses: When the pair currency price may change the direction of movement. Possible constraints of support and resistance that creates plateaus for the currency pair prices. Tendency identification by comparing the present prices according to current day's pivot point and also the prior day's pivot points. ____________
FREE
SnR Engine
Muhammad Tamimul Huda
SnR Engine Basically, this is a Support and Resistance indicator like most others that use fractals to determine support and resistance levels. The difference is that this indicator determines whether a support or resistance level has been broken based on ATR. Levels that have been broken will become “dead levels” and will be shown with dashed lines. Levels that have many rejections and fail to be broken will have increasingly thicker lines. For effective use, you need to understand the charac
FREE
Pivot Points are a classic technical analysis indicator that calculates the central pivot point (PP) as well as support (S1–S3) and resistance (R1–R3) levels based on the previous day’s High, Low, and Close. The indicator allows you to: • identify key zones where the price may bounce or break through • determine the direction of the trend • find good entry points, as well as set stop loss and take profit levels Indicator settings: • enable/disable PP, R1/S1, R2/S2, R3/S3 • enable/disable price l
FREE
Smc Session Killzone and Breakout The Smc Session Killzone and Breakout indicator automates the institutional session trading model for MetaTrader 5. It draws the Asian, London, and New York session ranges as labelled boxes on the chart, detects when price sweeps beyond the Asian session high or low, and fires a non-repainting entry signal after a Market Structure Shift is confirmed. All signals are based on closed bars and do not repaint. The underlying model follows the sequence that institut
FREE
PIVOT eXtreme
Syamsurizal Dimjati
Pivot eXtreme Pivot adalah level referensi penting yang digunakan trader untuk memetakan potensi support & resistance intraday maupun jangka lebih panjang. Dalam sistem ini, level pivot dikembangkan menjadi P (Pivot Point utama) , R1–R13 (Resistance) , serta S1–S13 (Support) . Pivot Point (P) Titik pusat utama, dihitung dari rata-rata harga (High + Low + Close) / 3 . Berfungsi sebagai acuan keseimbangan harga : Jika harga di atas P → tren cenderung bullish. Jika harga di bawah P → tren cenderung
FREE
Free automatic Fibonacci is an indicator that automatically plots a Fibonacci retracement based on the number of bars you select on the BarsToScan setting in the indicator. The Fibonacci is automatically updated in real time as new highest and lowest values appears amongst the selected bars. You can select which level values to be displayed in the indicator settings. You can also select the color of the levels thus enabling the trader to be able to attach the indicator several times with differe
FREE
TradingView Style Chart Watermark Transform your MetaTrader 5 charts to look as elegant and professional as TradingView. Are you tired of the default, plain look of MetaTrader? WaterMark MT5 is a lightweight, fully customizable indicator designed to enhance your charting experience by adding sleek, modern watermarks directly to your trading terminal. This indicator bridges the visual gap between standard MetaTrader charts and premium web based charting platforms. It allows you to display the cur
FREE
-- Semplice ma efficace. Indicatore di inversione - Che cos'è? Un indicatore di sovrapposizione che segue il trend e combina la logica SuperTrend con la tecnologia della curva esponenziale. Rileva la direzione del trend, traccia un canale dinamico sul grafico e invia avvisi in tempo reale quando il trend si inverte. Come funziona? L'indicatore calcola una linea di base esponenziale utilizzando l'ATR e un fattore SuperTrend. Quando il prezzo chiude al di sopra o al di sotto di questa linea di
FREE
Dynamic Key Levels
Rodrigo Ivan Ahumada Pena
Key Levels S/R — Dynamic Support & Resistance Structure Key Levels S/R is a precise and reliable indicator that identifies true Support and Resistance levels based on confirmed swing structure. Instead of guessing or repainting, it waits for market validation before marking any level — giving traders clean, trustworthy zones to work with. This tool is ideal for breakout traders, pullback traders, and anyone who uses pending orders at structurally meaningful price levels. How the Logic Works The
FREE
MultiFrame Pivot MT5
Quang Huy Quach
5 (1)
MultiFrame Pivot: A Multi-Timeframe Analysis Tool MultiFrame Pivot is an analysis indicator designed to provide an overview of the market based on Pivot Points across multiple timeframes. The indicator synthesizes information from different timeframes to give you a more comprehensive view of important price levels. KEY FEATURES: Multi-Timeframe Analysis: MultiFrame Pivot allows you to simultaneously monitor the price's status relative to Pivot Points (PP), Support 1 (S1), and Resistance 1 (R1)
FREE
Levels of Pivots
Nikolay Mitrofanov
The utility draws reversal levels using the formulas for each of the selected number of candles: Pivot = (high + close + low) / 3 R1 = ( 2 * Pivot) - low S1 = ( 2 * Pivot) - high R2 = Pivot + (R1 -S1) R3 = high + ( 2 * (Pivot - low)) S2 = Pivot - (R1 - S1) S3 = low - ( 2 * (high - Pivot)) H = high L = low U = if the candle is bullish, then close. Otherwise - open D = if the candle is bullish, then open. Otherwise - close On any timeframe. After a new candle closes on the calculated timeframe
FREE
Pivot Classic, Woodie, Camarilla, Fibonacci and Demark Floor/Classic I punti pivot, o semplicemente pivot, sono utili per identificare potenziali livelli di supporto/resistenza, range di trading, inversioni di tendenza e sentiment di mercato esaminando i valori massimi, minimi e di chiusura di un asset. I Pivot Point Floor/Classic possono essere calcolati come segue. Pivot Point (P) = (High + Low + Close)/3 S1 = P * 2 - High S2 = P - (High - Low) S3 = Low – 2*(High - P) R1 = P * 2 - Low R2 = P +
FREE
Pivot MT5
Dmitrij Isaenko
The indicator draws daily support and resistance lines on the chart, as well as the Pivot level (reversal level). Adapted to work in MT5 The standard timeframe for calculating support and resistance levels is D1. You can choose other timeframes according to your strategy (for example, for M1-M15, the optimal timeframe for calculations is H1) The function for calculating support and resistance levels has been updated; in this calculation option, fibonacci levels are taken into account, respec
FREE
Gli utenti di questo prodotto hanno anche acquistato
Neuro Poseidon MT5
Daria Rezueva
4.97 (33)
Neuro Poseidon is a new indicator by Daria Rezueva. It combines precise trading signals with adaptive TP/SL levels - creating best possible trades as a result! Message me and get  Neuro Poseidon Assistant  as a gift to automize your trading process! What makes it stand out? 1. Proven profitability on all assets and timeframes 2. Only confirmed BUY and SELL signals present on the chart 3. Adaptive TP & SL levels generated by the software for each trade 4. Easy to understand - suitable for al
SuperScalp Pro
Van Minh Nguyen
4.65 (26)
SuperScalp Pro – Sistema avanzato di indicatore scalping multi-filtro SuperScalp Pro è un indicatore di scalping avanzato che combina il classico Supertrend con molteplici filtri intelligenti di conferma per aiutare a identificare opportunità di trading. Funziona in modo efficiente su diversi timeframe da M1 a H4, con prestazioni ottimizzate su XAUUSD, BTCUSD e principali coppie Forex. L’indicatore fornisce chiari segnali Buy e Sell, insieme a livelli di ingresso, stop loss e take profit calcola
Gold Entry Sniper
Tahir Mehmood
5 (12)
Gold Entry Sniper – Dashboard ATR Multi-Timeframe per Scalping e Swing Trading sull’Oro Gold Entry Sniper è un indicatore avanzato per MetaTrader 5 che offre segnali di acquisto/vendita precisi per XAUUSD e altri strumenti, basato sulla logica ATR Trailing Stop e l' analisi multi-timeframe . Caratteristiche e Vantaggi Analisi Multi-Timeframe – Visualizza trend su M1, M5, M15 in un'unica dashboard. Trailing Stop Basato su ATR – Stop dinamici che si adattano alla volatilità. Dashboard Professional
Cominciamo con la verità. Nessun indicatore da solo ti renderà profittevole. Se qualcuno ti dice il contrario, ti sta vendendo un sogno. Qualsiasi indicatore che mostra frecce perfette di acquisto/vendita può essere reso impeccabile — basta ingrandire la giusta sezione della storia e catturare solo i trade vincenti. Noi non lo facciamo.  SMC Intraday Formula è uno strumento. Legge la struttura del mercato per te, identifica le zone a più alta probabilità e ti mostra esattamente come appare la t
Entry In The Zone and SMC Multi Timeframe is a real-time 2-in-1 market analysis tool that combines market structure analysis and a No Repaint BUY / SELL signal system into a single indicator, built on Smart Money Concepts (SMC) — a widely adopted framework used by professional traders to understand market structure. This indicator helps you see the market more clearly, make decisions based on structure rather than guesswork, and focus on high-probability zones where price is more likely to react
Divergence Bomber
Ihor Otkydach
4.9 (90)
Ogni acquirente dell’indicatore riceverà inoltre gratuitamente: L’utilità esclusiva “Bomber Utility”, che gestisce automaticamente ogni operazione, imposta i livelli di Stop Loss e Take Profit e chiude le posizioni secondo le regole della strategia I file di configurazione (set file) per adattare l’indicatore a diversi asset I set file per configurare il Bomber Utility in tre modalità: “Rischio Minimo”, “Rischio Bilanciato” e “Strategia di Attesa” Una guida video passo-passo per installare, conf
Quantum TrendPulse
Bogdan Ion Puscasu
5 (25)
Ecco   Quantum TrendPulse   , lo strumento di trading definitivo che combina la potenza di   SuperTrend   ,   RSI   e   Stocastico   in un unico indicatore completo per massimizzare il tuo potenziale di trading. Progettato per i trader che cercano precisione ed efficienza, questo indicatore ti aiuta a identificare con sicurezza le tendenze di mercato, i cambiamenti di momentum e i punti di entrata e uscita ottimali. Caratteristiche principali: Integrazione SuperTrend:   segui facilmente l'andame
Questo prodotto è stato aggiornato per il mercato 2026 e ottimizzato per le ultime build di MT5. AVVISO DI AGGIORNAMENTO PREZZO: Smart Trend Trading System è attualmente disponibile a $99 . Il prezzo aumenterà a $199 dopo i prossimi 30 acquisti . OFFERTA SPECIALE: Dopo aver acquistato Smart Trend Trading System, inviami un messaggio privato per ricevere Smart Universal EA GRATIS e trasformare i tuoi segnali Smart Trend in operazioni automatiche. Smart Trend Trading System è un sistema di tradin
SignalTech is an unique fully rule based trading system delivers an Institutional approach for both Independent Traders and Prop Firm Challengers. Never Repaint. Push Notification available. No over-optimization. All the winning trades with chart setups are published on the comments page. 2026-05 4107 Pips (Until 05-29 NY Closed) 2026-04 2243 Pips 2026-03 2165 Pips 2026-02 2937 Pips 2026-01 2624 Pips 2025-12 1174 Pips It can generate signals with Buy/Sell Arrows, Push Notification (To Mobile) an
Power Candles MT5
Daniel Stein
5 (8)
Power Candles V3 - Indicatore di forza ad ottimizzazione automatica Power Candles V3 trasforma la forza delle valute e degli strumenti in un piano di trading attuabile su ogni grafico a cui è collegato. Invece di limitarsi a colorare le candele, esegue un'auto-ottimizzazione in tempo reale in background e ti fornisce i migliori valori di Stop Loss, Take Profit e soglia di segnale per il simbolo che hai davanti. Basta un clic per adottarlo nel trading live: i raggi di ingresso, Stop Loss e Take P
PrimeScalping
Temirlan Kdyrkhan
PrimeScalping is a powerful trading companion designed to generate high-probability entry signals with dynamic TP/SL/DP levels based on volatility. Built-in performance tracking shows win/loss stats, PP1/PP2 hits, and success rates — all updated live. Key Features: Buy/Sell signals with adaptive volatility bands Real-time TP/SL/DP levels based on ATR Built-in MA Filter with optional ATR/StdDev volatility Performance stats panel (Success, Profit/Loss, PP1/PP2) Alerts via popup, sound, push, or e
M1 Quantum MT5
Hamed Dehgani
5 (1)
M1 Quantum è un sistema di trading professionale per M1 che fornisce segnali di trading rapidi e precisi con Stop Loss, Take Profit e gestione intelligente del capitale integrati. M1 Quantum include un sistema professionale di gestione del capitale progettato per far crescere rapidamente il conto concentrandosi su vittorie consecutive . Caratteristiche principali dell' Indicatore M1 Quantum Progettato per il time frame M1 e tutte le principali coppie di valute Tutti i trade hanno Stop Loss e Tak
Trend Catcher ind mt5
Ramil Minniakhmetov
5 (5)
INDICATORE TREND CATCHER L'indicatore Trend Catcher analizza i movimenti dei prezzi di mercato, utilizzando una combinazione di indicatori di analisi del trend proprietari dell'autore e personalizzati. Identifica la vera direzione del mercato filtrando il rumore a breve termine e concentrandosi sulla forza del momentum sottostante, sull'espansione della volatilità e sul comportamento della struttura dei prezzi. Utilizza inoltre una combinazione di indicatori personalizzati di smoothing e filtr
FX Trend MT5 NG
Daniel Stein
5 (6)
FX Trend NG: La Nuova Generazione di Intelligenza di Trend Multi-Mercato Panoramica FX Trend NG è uno strumento professionale di analisi del trend multi-timeframe e monitoraggio dei mercati. Ti consente di comprendere la struttura completa del mercato in pochi secondi. Invece di passare tra numerosi grafici, puoi identificare immediatamente quali strumenti sono in trend, dove il momentum sta diminuendo e dove esiste un forte allineamento tra i timeframe. Offerta di Lancio – Ottieni FX Trend NG
GoldenX Entry MT5
Kareem Abbas
5 (10)
GoldenX Entry è un indicatore per MT5 con un algoritmo adattivo Smart Entry Trend, un sistema di scoring dei segnali, un rilevatore del regime di mercato e un filtro di volatilità. Ogni segnale include un livello di ingresso calcolato, tre livelli di Take-Profit (TP1, TP2, TP3) e un livello di Stop-Loss. È costruito su più livelli analitici progettati per adattarsi a diverse condizioni di mercato, combinando un sistema analitico multilivello con un ottimizzatore integrato e un sistema di traccia
Gann Made Easy è un sistema di trading Forex professionale e facile da usare che si basa sui migliori principi del trading utilizzando la teoria di mr. WD Gann. L'indicatore fornisce segnali ACQUISTA e VENDI accurati, inclusi i livelli di Stop Loss e Take Profit. Puoi fare trading anche in movimento utilizzando le notifiche PUSH. CONTATTAMI DOPO L'ACQUISTO PER RICEVERE GRATUITAMENTE LE ISTRUZIONI DI TRADING E OTTIMI INDICATORI EXTRA! Probabilmente hai già sentito parlare molte volte dei metodi d
Meridian Pro
Ottaviano De Cicco
5 (2)
Meridian Pro 2.00: Professional Multi-Timeframe Trend Matrix for MT5 Meridian Pro 2.00 is a professional adaptive trend matrix for MetaTrader 5. It combines the original Meridian trend engine, a clean chart ribbon, closed-bar signal arrows, an 8-timeframe dashboard, Fuel momentum, weighted consensus, synthetic HTF processing and chart-native higher-timeframe context lines. The goal is simple: read current trend, multi-timeframe structure, strength, momentum and EA-ready state from one discipline
L'indicatore UZFX {SSS} Scalping Smart Signals MT5 è un indicatore di trading ad alte prestazioni che non si aggiorna (non repaint) progettato per scalper, day trader e swing trader che necessitano di segnali accurati e in tempo reale in mercati in rapida evoluzione. Sviluppato da (UZFX-LABS), questo indicatore combina l'analisi dell'andamento dei prezzi, la conferma del trend e un filtraggio intelligente per generare segnali di acquisto e vendita ad alta probabilità su tutte le coppie di valute
SmartScalping
Temirlan Kdyrkhan
SmartScalping is a powerful trading companion designed to generate high-probability entry signals with dynamic TP/SL/DP levels based on volatility. Built-in performance tracking shows win/loss stats, PP1/PP2 hits, and success rates — all updated live. Key Features: Buy/Sell signals with adaptive volatility bands Real-time TP/SL/DP levels based on ATR Built-in MA Filter with optional ATR/StdDev volatility Performance stats panel (Success, Profit/Loss, PP1/PP2) Alerts via popup, sound, push, or e
ARIPoint
Temirlan Kdyrkhan
1 (1)
ARIPoint is a powerful trading companion designed to generate high-probability entry signals with dynamic TP/SL/DP levels based on volatility. Built-in performance tracking shows win/loss stats, PP1/PP2 hits, and success rates all updated live. Key Features: Buy/Sell signals with adaptive volatility bands Real-time TP/SL/DP levels based on ATR Built-in MA Filter with optional ATR/StdDev volatility Performance stats panel (Success, Profit/Loss, PP1/PP2) Alerts via popup, sound, push, or email Cu
TrendProMaster
Temirlan Kdyrkhan
MasterTrend Indicator for MT5 A powerful trend-following and signal-evaluation tool MasterTrend   is a custom MT5 indicator that combines Moving Averages and ATR-based risk/reward logic to generate clear buy/sell signals. It visualizes dynamic SL/TP levels, evaluates past trade outcomes, and displays win/loss statistics in a clean on-chart panel. Key features include: Buy/Sell signals based on MA crossovers ATR-based SL/TP1/TP2/TP3 levels with visual lines and labels Signal outcome tracking wit
Reversion King Indicator
Eugen-alexandru Zibileanu
5 (4)
Un nuovo Re in città - Indicatore + Gestione ordini (TP1 + TP2 + TP3) + Invio opzionale di segnali Telegram INCLUSO (GRATIS) (SISTEMA COMPLETO DI TRADING e SEGNALI) Il nostro miglior EA per l’Oro: Gold Slayer Questo indicatore include una strategia avanzata, un sistema di trading con gestione ordini personalizzabile e un sistema mean reversion che combina estensioni di envelope, supportato da molteplici filtri intelligenti di conferma come RSI per individuare ingressi di inversione ad alta proba
Atomic Analyst MT5
Issam Kassas
4.26 (35)
Questo prodotto è stato aggiornato per il mercato 2026 e ottimizzato per le ultime build di MT5. AVVISO DI AGGIORNAMENTO PREZZO: Atomic Analyst è attualmente disponibile a $99 . Il prezzo aumenterà a $199 dopo i prossimi 30 acquisti . OFFERTA SPECIALE: Dopo aver acquistato Atomic Analyst, inviami un messaggio privato per ricevere Smart Universal EA GRATIS e trasformare i tuoi segnali Atomic Analyst in operazioni automatiche. Atomic Analyst è un indicatore di trading Price Action non-repainting
Azimuth Pro
Ottaviano De Cicco
5 (7)
Azimuth Pro V2: Synthetic Fractal Structure and Confirmed Entries for MT5 Overview Azimuth Pro is a multi-level swing structure indicator by Merkava Labs . Four nested swing layers, swing-anchored VWAP, ABC pattern detection, three-timeframe structural filtering, and closed-bar confirmed entries — one chart, one workflow from micro-swings to macro-cycles. This is not a blind signal product. It is a structure-first workflow for traders who care about location, context, and timing. V2 Launch Offe
ScalpPoint
Temirlan Kdyrkhan
ScalpPoint is a powerful trading companion designed to generate high-probability entry signals with dynamic TP/SL/DP levels based on volatility. Built-in performance tracking shows win/loss stats, PP1/PP2 hits, and success rates — all updated live. Key Features: Buy/Sell signals with adaptive volatility bands Real-time TP/SL/DP levels based on ATR Built-in MA Filter with optional ATR/StdDev volatility Performance stats panel (Success, Profit/Loss, PP1/PP2) Alerts via popup, sound, push, or emai
Market Structure Order Block Dashboard MT5 è un indicatore MT5 progettato per i trader che vogliono leggere la struttura di mercato e le principali zone di reazione del prezzo direttamente sul grafico. Combina BOS, ChoCH, Order Blocks, Fair Value Gaps (FVG), Liquidità, Kill Zones, Volume Profile e un pannello compatto per un'analisi rapida. Questo indicatore è rivolto ai trader che utilizzano la struttura di mercato, i concetti ICT e Smart Money come quadro decisionale. Può aiutare a individuare
FX Power MT5 NG
Daniel Stein
5 (32)
FX Power: Analizza la Forza delle Valute per Decisioni di Trading Più Intelligenti Panoramica FX Power è lo strumento essenziale per comprendere la reale forza delle principali valute e dell'oro in qualsiasi condizione di mercato. Identificando le valute forti da comprare e quelle deboli da vendere, FX Power semplifica le decisioni di trading e rivela opportunità ad alta probabilità. Che tu segua le tendenze o anticipi inversioni utilizzando valori estremi di Delta, questo strumento si adatta
Crystal Heikin Ashi Signals
Muhammad Jawad Shabir
5 (2)
Crystal Heikin Ashi Signals - Professional Trend & Signal Detection Indicator Advanced Heikin Ashi Visualization with Intelligent Signal System for Manual & Automated Trading Final Price: $149 ---------> Price goes up $10 after every 10 sales . Limited slots available — act fast . Overview Crystal Heikin Ashi Signals is a professional-grade MetaTrader 5 indicator that combines pure Heikin Ashi candle visualization with an advanced momentum-shift detection system. Designed for both manual traders
Presentazione       Quantum Breakout PRO   , l'innovativo indicatore MQL5 che sta trasformando il modo in cui scambi le zone di breakout! Sviluppato da un team di trader esperti con un'esperienza di trading di oltre 13 anni,       Quantum Breakout PRO       è progettato per spingere il tuo viaggio di trading a nuovi livelli con la sua strategia innovativa e dinamica della zona di breakout. Quantum Breakout Indicator ti fornirà frecce di segnalazione sulle zone di breakout con 5 zone target di
Quant Direction MT5
Georgios Kalomoiropoulos
Quant Direction è uno strumento di analisi di mercato 3D. Offre un'analisi di mercato perfettamente oggettiva, basata su algoritmi, calcolando con precisione le deviazioni percentuali su diversi parametri. Sviluppato utilizzando strumenti di modellazione avanzati basati sull'intelligenza artificiale e rigorosamente testato, questo algoritmo analizza il mercato con una precisione senza pari. È possibile analizzare qualsiasi coppia di valute o strumento finanziario sulla piattaforma. Che si pratic
Altri dall’autore
Global Market Risk Sentiment Meter 1. Overview The Global Market Risk Sentiment Meter is an analytical indicator designed for the MetaTrader 5 (MQL5) platform. It employs an Inter-Market Analysis approach to assess the aggregate data of specific global financial markets. By evaluating real-time price changes across US Indices, Global Equities, Cryptocurrencies, and historical Safe Haven assets (Gold and the US Dollar Index), the indicator calculates a composite sentiment score. This data is vis
FREE
Enhanced Volume Profile: The Ultimate Order Flow & Liquidity Analysis Tool Overview Enhanced Volume Profile is an indicator for MetaTrader 5 that displays the traded volume at specific price levels over a defined period. It separates the total volume into buy and sell components, presenting them as a side-by-side histogram on the chart. This allows users to observe the volume distribution and the proportion of buy and sell volumes at each price level. Graphics Rendering The indicator uses the
FREE
Enhanced Volume Profile: The Ultimate Order Flow & Liquidity Analysis Tool Overview Enhanced Volume Profile   is an indicator for MetaTrader 5 that displays the traded volume at specific price levels over a defined period. It separates the total volume into buy and sell components, presenting them as a side-by-side histogram on the chart. This allows users to observe the volume distribution and the proportion of buy and sell volumes at each price level. Graphics Rendering The indicator uses t
FREE
Advanced SMC & Volumetric Order Block Indicator Overview This enhanced-grade for MetaTrader 5 indicator is designed to decode market behavior using     Smart Money Concepts (SMC)   method . It goes beyond standard price action analysis by integrating     Volumetric Data   directly into market structure, helping traders identify high-probability reversal and continuation zones with precision. Key Features Volumetric Order Blocks:   A unique, split-gauge visualization within Order Block zones tha
FREE
AstroCycles: Advanced Financial Astronomy Indicator Overview AstroCycles   is a sophisticated technical analysis tool developed for the MetaTrader 5 (MQL5) platform. It bridges the gap between orbital mechanics and financial market analysis by calculating precise astronomical cycles and visualizing them directly on your trading chart. Unlike standard indicators that rely on past price data, AstroMaster utilizes high-precision astronomical algorithms (Keplerian Elements and Brown’s Lunar Theory)
FREE
Stochastic RSI-RVI Fusion Dashboard (MTF) Unlock the full "Matrix" view of the market. The   Stochastic RSI-RVI Fusion Dashboard   is the advanced companion to the   Stochastic RSI-RVI Fusion   oscillator. While the standard indicator analyzes the current chart, this Dashboard monitors the entire spectrum of timeframes simultaneously—from the 1-minute scalping noise to the monthly macro trends. Trading with a single timeframe often leads to "tunnel vision." You might buy on the H1 timeframe beca
FREE
Stochastic RSI-RVI Fusion   is a next-generation oscillator that goes beyond the standard Stochastic RSI. By combining the momentum precision of the   Relative Strength Index (RSI)   with the energy and volatility analysis of the   Relative Vigor Index (RVI) , this indicator provides a smoother, more reliable oscillating signal for traders looking to filter out market noise. Standard oscillators often give false signals during choppy markets. This "Fusion" edition solves that by averaging market
FREE
Enhanced FVG Enhanced FVG is a technical indicator for MetaTrader 5 that identifies Fair Value Gaps on the chart and measures the buyer-to-seller volume ratio within each detected gap. Volume classification is performed using M1 timeframe tick volume data, applying the same methodology used in standard Volume Profile analysis. How It Works The indicator scans three consecutive candlesticks to detect Fair Value Gaps. A Bullish FVG is identified when the high of the first candle does not overlap w
FREE
PropFirm Copilot Trade Risk Management EA: The Ultimate Prop Firm Copilot The Trade Risk Management Copilot EA is an automated trading utility designed to assist manual traders and proprietary firm traders in managing their open positions and risk parameters. The tool automates the process of stop-loss and take-profit calculations, position trailing, and account drawdown monitoring. Managing multiple positions across various symbols requires continuous calculation of stops, break-even points, a
FREE
Are you ready to elevate your trading game and experience unparalleled accuracy in market predictions? The Scalping Range Grid Indicator is not just a tool—it’s your main weapon for pinpointing the next move in the financial markets. Designed for traders who demand the best, this cutting-edge indicator harnesses the power of grid-based analysis to scan future price transit zones with unmatched precision. Imagine having the foresight to know where the price is most likely to pause, consolidate,
Stochastic RSI-RVI Fusion Dashboard (MTF) Unlock the full "Matrix" view of the market. The     Stochastic RSI-RVI Fusion Dashboard   is the advanced companion to the     Stochastic RSI-RVI Fusion   oscillator. While the standard indicator analyzes the current chart, this Dashboard monitors the entire spectrum of timeframes simultaneously—from the 1-minute scalping noise to the monthly macro trends. Trading with a single timeframe often leads to "tunnel vision." You might buy on the H1 timeframe
FREE
AstroCycles: Advanced Financial Astronomy Indicator Overview AstroCycles   is a sophisticated technical analysis tool developed for the MetaTrader 4 (MQL4) platform. It bridges the gap between orbital mechanics and financial market analysis by calculating precise astronomical cycles and visualizing them directly on your trading chart. Unlike standard indicators that rely on past price data, AstroMaster utilizes high-precision astronomical algorithms (Keplerian Elements and Brown’s Lunar Theory)
FREE
Stochastic RSI-RVI Fusion   is a next-generation oscillator that goes beyond the standard Stochastic RSI. By combining the momentum precision of the     Relative Strength Index (RSI)   with the energy and volatility analysis of the     Relative Vigor Index (RVI) , this indicator provides a smoother, more reliable oscillating signal for traders looking to filter out market noise. Standard oscillators often give false signals during choppy markets. This "Fusion" edition solves that by averaging ma
FREE
Advanced SMC & Volumetric Order Block Indicator Overview This enhanced-grade for MetaTrader 5 indicator is designed to decode market behavior using   Smart Money Concepts (SMC) method . It goes beyond standard price action analysis by integrating   Volumetric Data   directly into market structure, helping traders identify high-probability reversal and continuation zones with precision. Key Features Volumetric Order Blocks:   A unique, split-gauge visualization within Order Block zones that disp
PropFirm AI Management is an Expert Advisor for MetaTrader 5 designed to assist traders operating under prop firm evaluation conditionsas well as independent personal trading. It integrates a generative AI pipeline with a structured multi-timeframe analysis engine, automated risk controls, and real-time position management — working within the specific constraints of funded account rules. How It Works PropFirm AI Management operates on a continuous timer cycle. On each tick, it evaluates a seque
Filtro:
mikecalina
36
mikecalina 2026.05.05 08:42 
 

L'utente non ha lasciato alcun commento sulla valutazione.

Lifegoodqwe
211
Lifegoodqwe 2026.04.06 09:36 
 

L'utente non ha lasciato alcun commento sulla valutazione.

Findolin
2420
Findolin 2026.03.13 19:34 
 

Excellent! Thank you so much! Small suggestion: It would be good if you could also turn off the dashboard.

Raka
5318
Risposta dello sviluppatore Raka 2026.03.21 22:26
I will update the dashboard to turn it ON/OFF. *Update*
Hi, the option to show/hide the dashboard panel is available now. Thank you.
wilkyang2781
60
wilkyang2781 2026.03.12 02:16 
 

One of the best indicator from one of the best creator

jgooi777
363
jgooi777 2026.03.11 05:44 
 

L'utente non ha lasciato alcun commento sulla valutazione.

Rispondi alla recensione