TimeCycle Vr1
- Indicatori
- Versione: 1.4
- Aggiornato: 8 gennaio 2026
- Attivazioni: 5
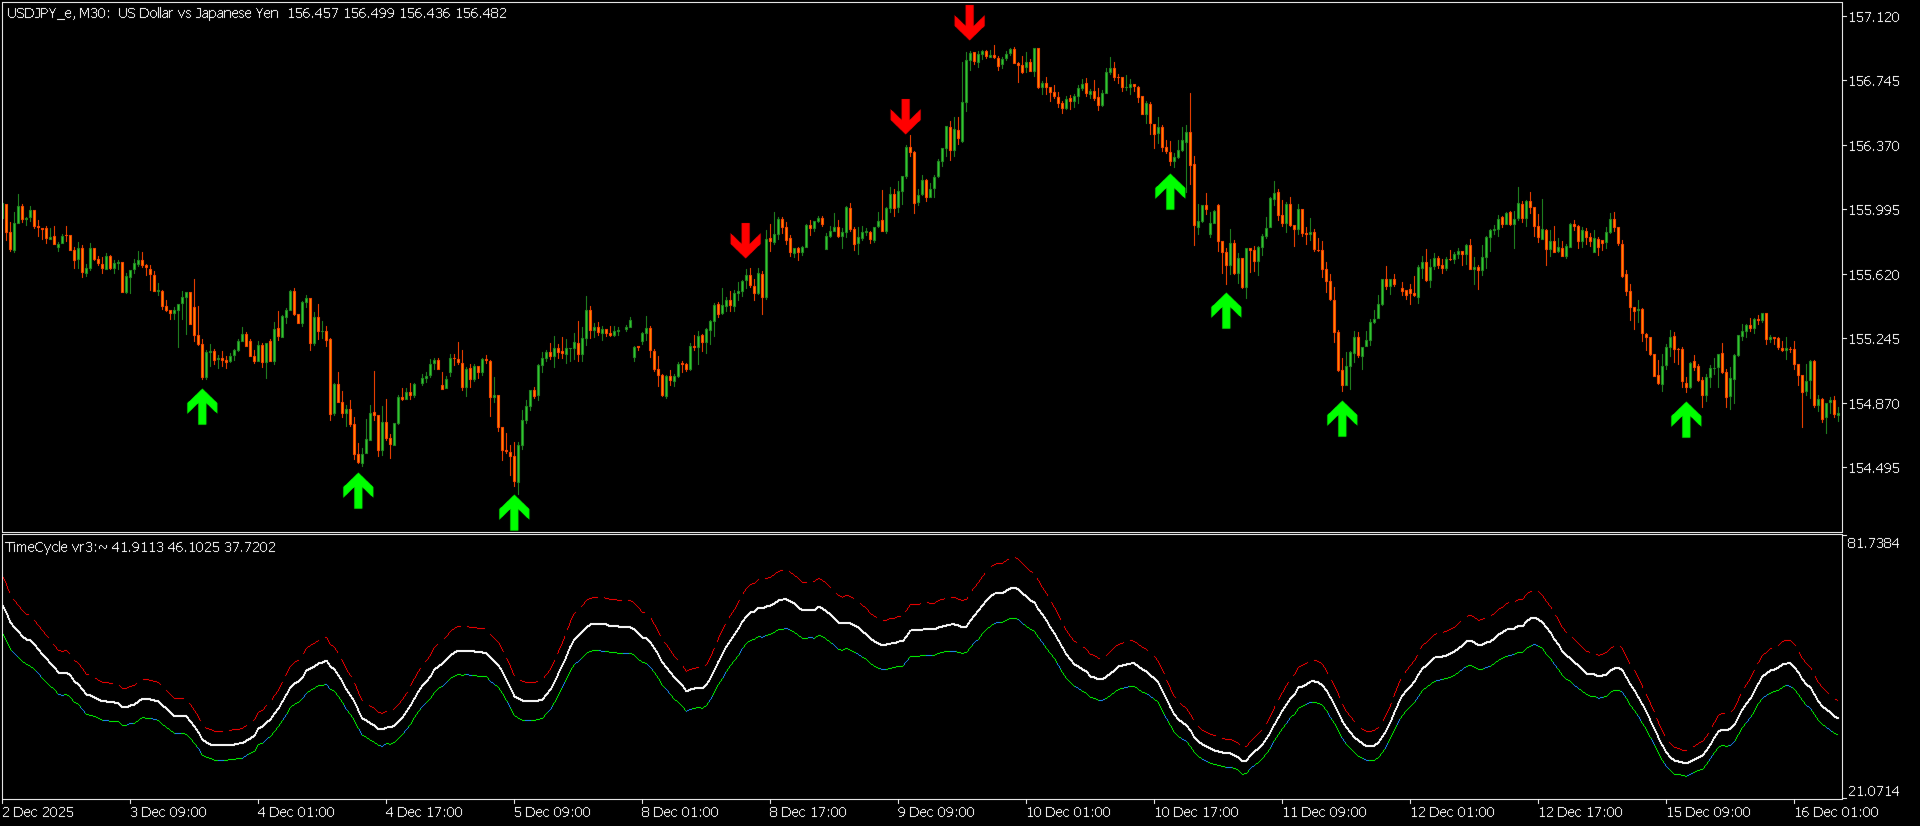
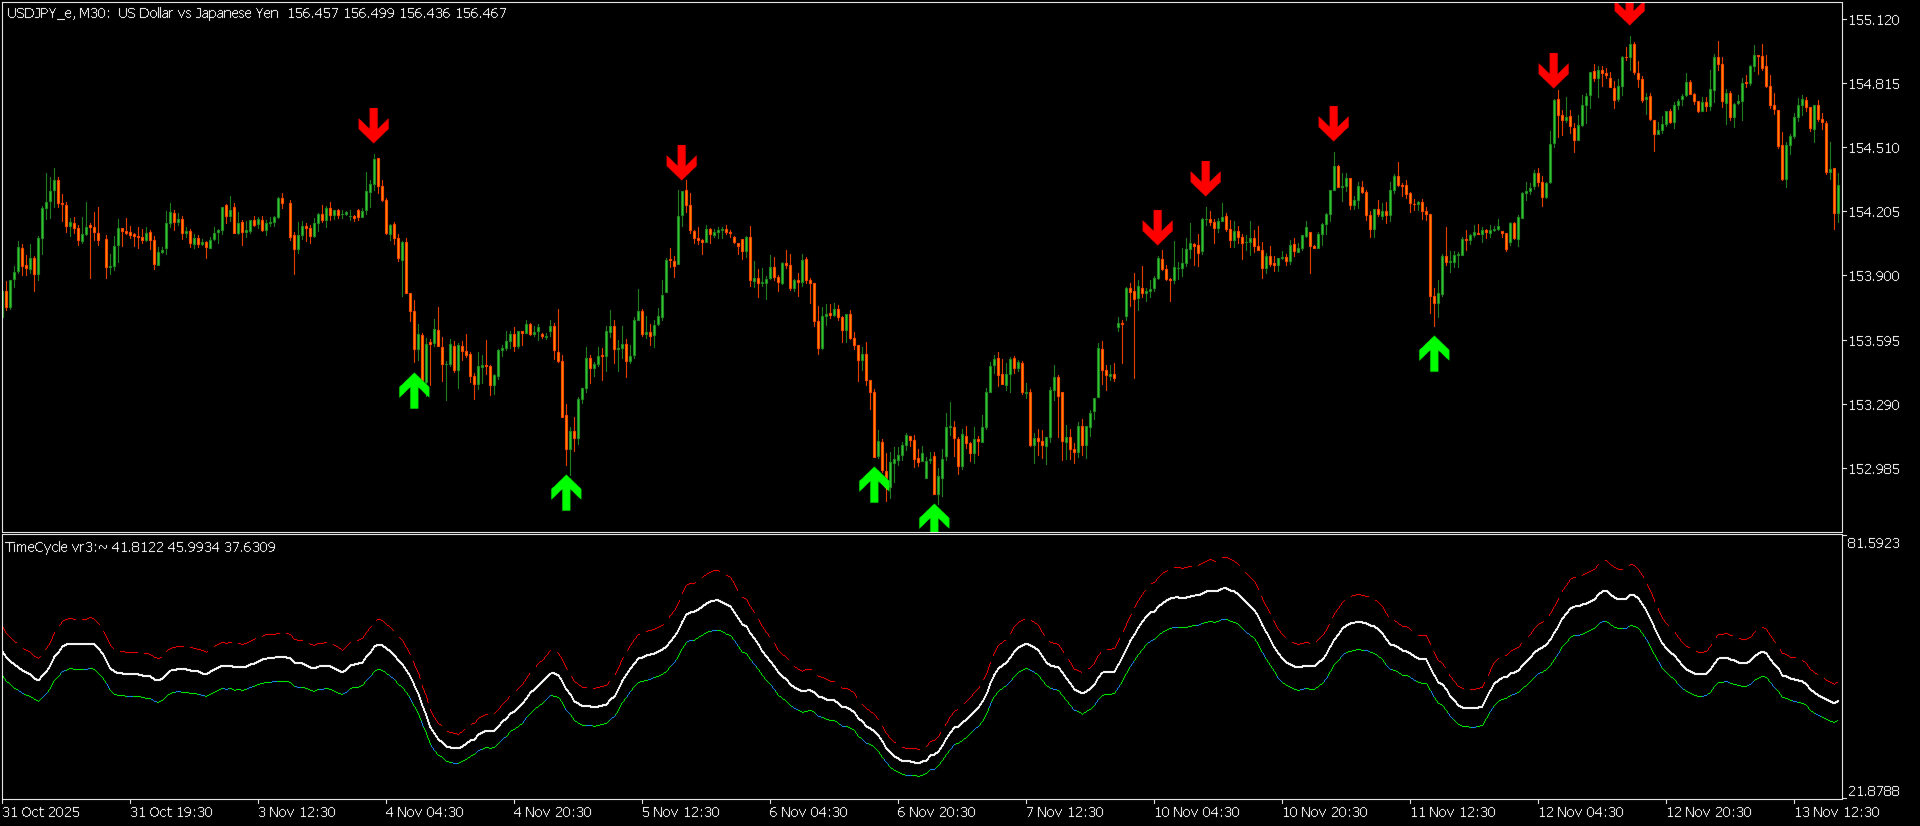
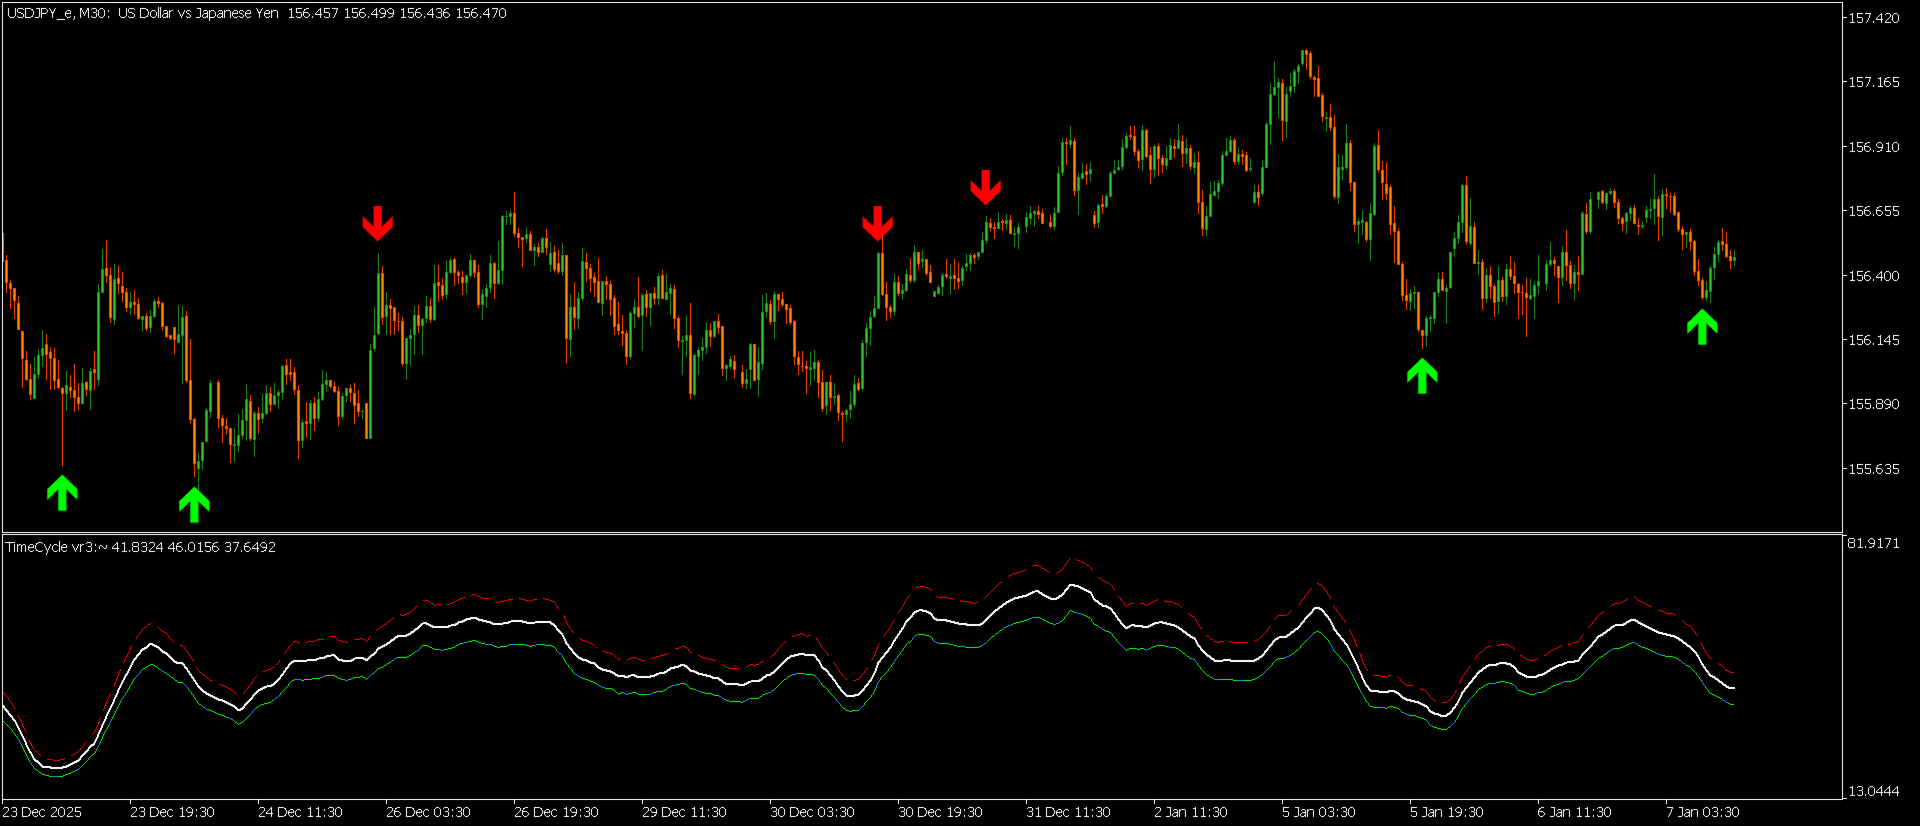
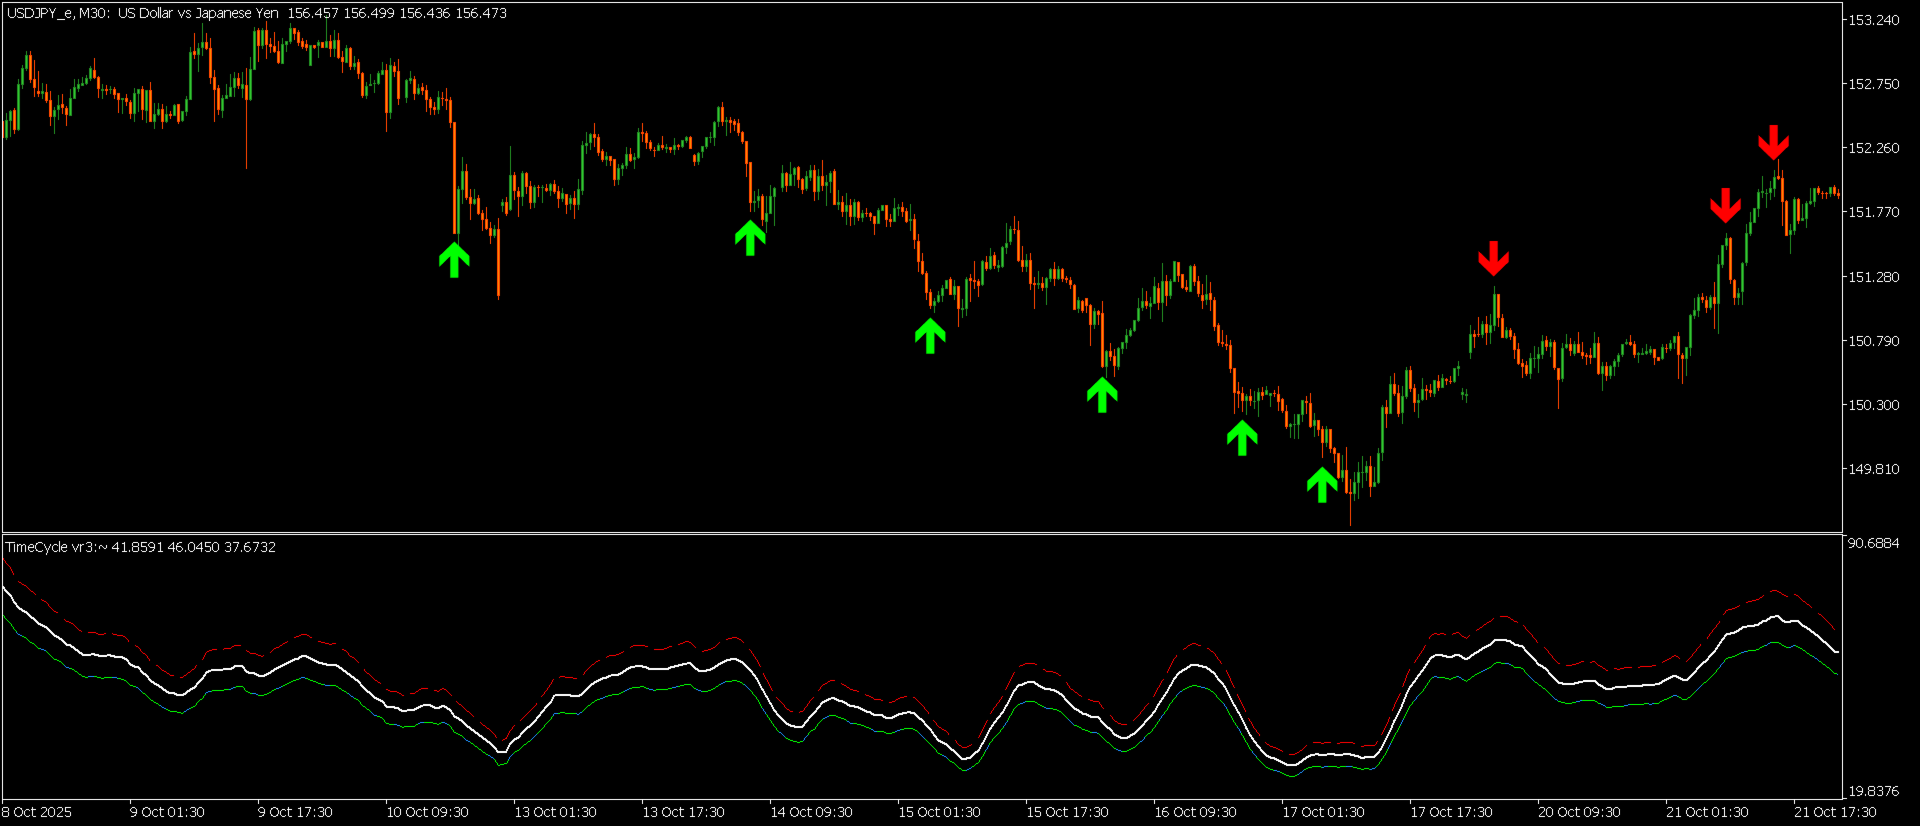
Timecycle indicator in trading analyses recurring patterns in market price movements based on fixed time intervals (e.g., bars, days, weeks) rather than solely on price action. It assumes markets exhibit cyclical behaviour—like seasons or waves—where highs, lows, and turning points repeat at predictable time durations (e.g., every 20, 40, or 90 bars, inspired by Hurst cycles, Gann theory, or Ehlers' dominant cycle measurements).
Core Functionality:
- Detects the dominant cycle length by measuring distances between past highs/lows or using detrending/math techniques (e.g., sine waves, FFT).
- Projects vertical lines, sine waves, or phase markers into the future to highlight potential reversal zones.
- Signals when price approaches a cycle trough (potential buy/bottom) or peak (potential sell/top).
- Often combines with oscillators for confirmation—e.g., buy at cycle low if oversold.