Entry Helper
- Indicatori
- Gayathiri Gopalakrishnan
- Versione: 3.20
- Attivazioni: 5
Overview
Entry Helper is a professional-grade MetaTrader 5 indicator that combines 15 advanced analysis layers for comprehensive market analysis
Designed for serious traders requiring institutional-level analysis capabilities
## Core Features
1 - 15 simultaneous analysis layers
2 - Machine learning price prediction
3 - Smart Money Concepts detection
4 - Institutional order flow analysis
5 - Multi-timeframe confluence system
6 - AI pattern recognition
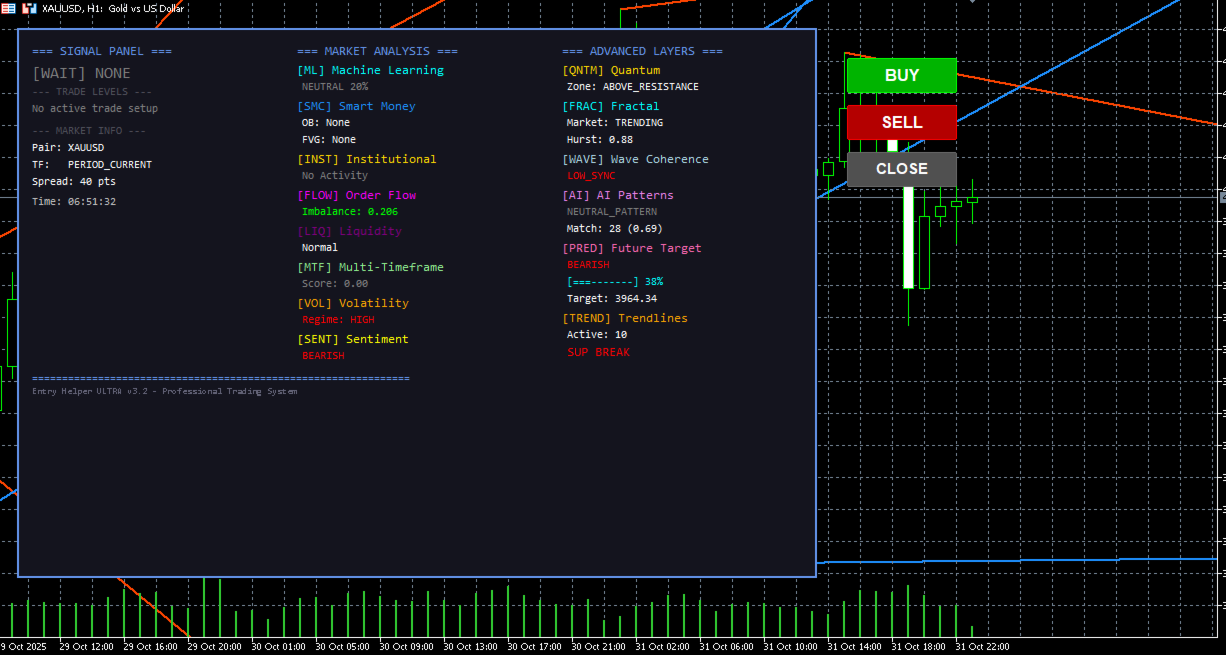
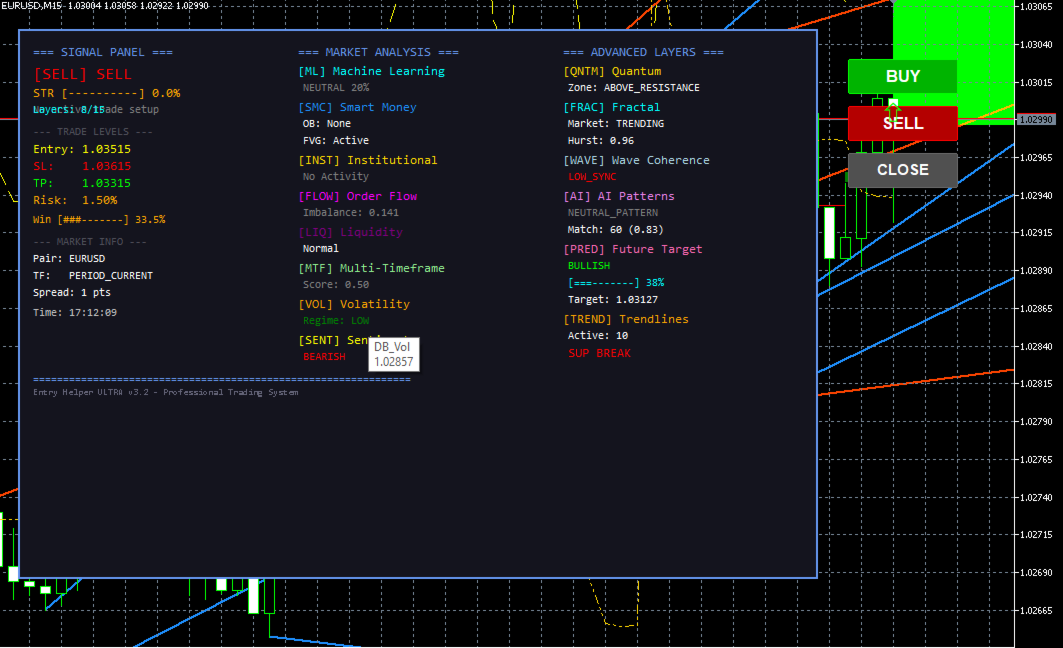
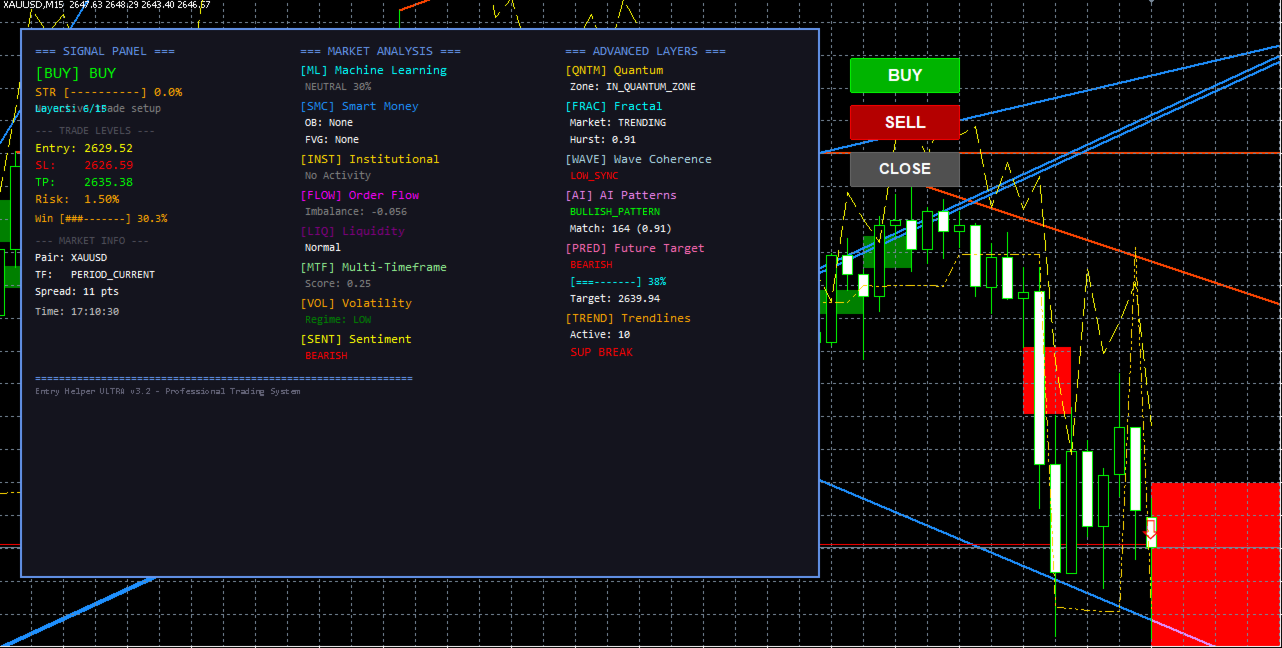
7 - Professional 3-column dashboard
8 - Dynamic risk management
## What This Indicator Analyzes
1 - Price action patterns
2 - Volume dynamics
3 - Order flow imbalances
4 - Institutional footprints
5 - Market microstructure
6 - Liquidity zones
7 - Market sentiment
8 - Statistical physics models
---
## The 15 Analysis Layers
### Layer 1: Machine Learning Prediction
1 - Uses 20-neuron neural network
2 - Predicts future price direction
3 - Provides confidence levels
4 - Trains on last 1000 bars (configurable)
5 - Output: Bullish/Bearish bias with probability
### Layer 2: Smart Money Concepts (SMC)
Detects institutional patterns:
1 - Order Blocks: Institutional order placement areas
2 - Fair Value Gaps (FVG): Price inefficiencies
3 - Breaker Blocks: Failed order blocks that reverse
4 - Liquidity Voids: Low liquidity areas
### Layer 3: Market Microstructure
1 - Order flow analysis for aggressive buying/selling
2 - Volume delta (buy vs sell volume)
3 - Volume profile distribution
4 - Iceberg order detection
### Layer 4: Liquidity Analysis
1 - Liquidity heatmap showing stop loss clusters
2 - Stop hunt detection
3 - Liquidity cluster identification
### Layer 5: Institutional Detection
1 - Large order detection (5x average volume)
2 - Dark pool activity identification
3 - Whale movement tracking
### Layer 6: Multi-Timeframe Confluence
Analyzes 4 timeframes simultaneously:
1 - M15 (15-minute)
2 - H1 (1-hour)
3 - H4 (4-hour)
4 - D1 (Daily)
Signals confirmed when multiple timeframes align
### Layer 7: Quantum Price Levels
1 - Fibonacci ratios (Golden Ratio 1618)
2 - Key magnetic price levels
3 - Statistical physics principles
### Layer 8: Volatility Regime Detection
1 - GARCH-like volatility prediction
2 - Adaptive parameters based on market conditions
3 - Automatic risk scaling
### Layer 9: Fractal Analysis
1 - Fractal dimension measurement
2 - Hurst Exponent calculation
3 - Values above 055 indicate trending markets
### Layer 10: Wave Coherence
1 - Market rhythm and cycle analysis
2 - Wave alignment detection
3 - High-probability entry zone identification
### Layer 11: AI Pattern Recognition
1 - Stores 500 historical patterns
2 - Real-time pattern matching
3 - Complex multi-bar formation detection
4 - 50% similarity threshold required
### Layer 12: Market Sentiment Analysis
Detects extreme conditions:
1 - Panic Buying: Excessive bullish momentum
2 - Panic Selling: Excessive bearish momentum
3 - Euphoria: Overextended bullish sentiment
4 - Capitulation: Oversold desperation
### Layer 13: Murrey Math Levels
1 - Octave-based price levels
2 - Geometric price analysis
3 - 13 key levels from -2/8 to +2/8
### Layer 14: Elliott Wave Analysis
1 - Impulse phases (waves 1, 3, 5)
2 - Corrective phases (waves 2, 4)
3 - Current wave position identification
### Layer 15: Harmonic Patterns
1 - Gartley, Butterfly, Bat patterns
2 - Fibonacci-based formations
3 - 5% tolerance for recognition
---
## Signal Types and Interpretation
### Strong BUY Signal
Characteristics:
1 - Signal Strength: 70% or higher
2 - ML Prediction: Bullish above 60%
3 - Timeframe Bias: 3/4 or 4/4 bullish
4 - Win Probability: Above 65%
5 - Institutional: Buy activity detected
Action: High confidence entry
Risk: 2-3% risk allowed (within limits)
### Moderate BUY Signal
Characteristics:
1 - Signal Strength: 50-70%
2 - ML Prediction: Bullish 40-60%
3 - Timeframe Bias: 2/4 or 3/4 bullish
4 - Win Probability: 50-65%
Action: Standard entry with normal risk
Risk: 1-2% risk
### Weak BUY Signal
Characteristics:
1 - Signal Strength: 30-50%
2 - ML Prediction: Bullish 30-40%
3 - Timeframe Bias: 1/4 or 2/4 bullish
4 - Win Probability: 45-50%
Action: Consider skipping or minimal risk
Risk: 05-1% risk maximum
---
## Signal Confirmation Process
Follow this verification sequence:
1 - Dashboard shows signal
2 - Check signal strength (above 60% preferred)
3 - Verify ML prediction (above 50% confidence)
4 - Check timeframe confluence (3/4 or better)
5 - Review win probability (above 60% ideal)
6 - Place trade
### Optimal Entry Timing
Best scenarios for entry:
1 - Signal appears at new bar (if AlertOnNewBar enabled)
2 - Price near Order Block or FVG
3 - Institutional activity confirms direction
4 - Multiple timeframes aligned
5 - During liquid trading hours
### When to Avoid Entry
Do not trade when:
1 - Signal strength below 40%
2 - Conflicting timeframe bias
3 - Major news event approaching
4 - Weekend approaching (if AvoidWeekends enabled)
5 - Outside trading hours (if TimeFilter active)
---
## Trading Strategies
### Strategy 1: High Confluence Trading
Setup Requirements:
1 - Signal Strength: Above 70%
2 - MTF Confluence: 4/4
3 - ML Confidence: Above 65%
4 - Win Probability: Above 70%
Entry Rules:
1 - Wait for signal on dashboard
2 - Verify all 4 timeframes align
3 - Check ML prediction matches signal
4 - Enter immediately or on pullback to Order Block
Risk Management:
1 - Use 2-3% risk per trade
2 - Stop loss per indicator suggestion
3 - Take profit at minimum 2:1 reward-to-risk
4 - Best for swing trading and higher timeframes
### Strategy 2: Smart Money Follow
Setup Requirements:
1 - Institutional activity detected
2 - Order Block present
3 - Signal Strength: Above 60%
4 - Price at or near Order Block
Entry Rules:
1 - Wait for institutional BUY/SELL indication
2 - Identify relevant Order Block
3 - Enter when price reaches Order Block and signal confirms
4 - Place stop beyond Order Block (5-10 pips)
Risk Management:
1 - Use 15-2% risk
2 - Take profit at next Order Block or FVG
3 - Move to breakeven at 1:1
4 - Best for day trading on all timeframes
### Strategy 3: ML Prediction Scalping
Setup Requirements:
1 - ML Confidence: Above 60%
2 - Signal Strength: Above 50%
3 - Current timeframe: M5-M15
4 - Tight stop losses
Entry Rules:
1 - Trade only during liquid hours
2 - Enter on signal with high ML confidence
3 - Quick entries and exits
4 - Multiple small profits
Risk Management:
1 - Use 1% risk per trade
2 - Take profit at 1:1 or 15:1
3 - Breakeven at 05:1
4 - Best for scalping on M5-M15 timeframes
### Strategy 4: Volatility Breakout
Setup Requirements:
1 - Volatility: Medium to High
2 - Signal Strength: Above 65%
3 - Price near major support/resistance level
4 - Volume increasing
Entry Rules:
1 - Wait for consolidation
2 - Signal appears during breakout
3 - Institutional activity confirms
4 - Enter on breakout bar
Risk Management:
1 - Use 2% risk
2 - Wider stops (volatility-adjusted)
3 - Take profit at 2:1 or use trailing stop
4 - Best for breakout traders on H1-H4
### Strategy 5: Reversal Catching
Setup Requirements:
1 - Sentiment: Panic Selling/Buying or Capitulation
2 - Pattern: Reversal pattern detected
3 - Signal: Opposite direction of panic
4 - Win Probability: Above 65%
Entry Rules:
1 - Wait for extreme sentiment reading
2 - Confirm reversal pattern
3 - Signal appears in opposite direction
4 - Enter on confirmation
Risk Management:
1 - Use 15% risk
2 - Tight initial stop
3 - Scale out at key levels
4 - Best for counter-trend trading on all timeframes
---
## Risk Management Rules
### Never Risk More Than 2-3% Per Trade
1 - Even with 90% signal strength
2 - Capital protection is priority
3 - Use dynamic position sizing
### Position Sizing Guidelines
1 - Higher signal strength = slightly higher risk
2 - Lower signal strength = lower risk
3 - Never exceed MaxRiskPercent setting
### Always Use Stop Losses
1 - Never trade without stop loss
2 - Use indicator's suggested stop loss
3 - Adjust for ATR when needed
### Breakeven Management
1 - Move to breakeven at 1:1 profit
2 - Protects capital in volatile markets
3 - Reduces emotional stress
### Trailing Stops
1 - Activate at 15:1 profit
2 - Locks in profits
3 - Allows winners to run
---
## Troubleshooting Guide
### Problem: No Signals Appearing
Indicator loaded but no BUY/SELL signals showing
Possible causes and solutions:
A) Thresholds Too High
1 - Lower MinProbabilityThreshold to 040
2 - Lower MLConfidenceThreshold to 025
3 - Reduce MinimumActiveLayersRequired to 2-3
B) Insufficient Historical Data
1 - Increase AnalysisBars to 1000 or more
2 - Wait for more bars to form
3 - Switch to higher timeframe temporarily
C) Conflicting Timeframes
1 - Adjust MTF timeframes to closer intervals
2 - Lower MTFConfluenceThreshold to 025
D) Market Consolidation
1 - Indicator may not signal during tight ranges
2 - This is correct behavior (avoiding bad trades)
3 - Wait for breakout or increased volatility
### Problem: Too Many Signals
Signal appearing on every bar
Solutions:
1 - Increase MinProbabilityThreshold to 055-060
2 - Increase MinimumActiveLayersRequired to 4-5
3 - Increase MLConfidenceThreshold to 040-050
4 - Enable RequireMultipleConfirmations = true
### Problem: Alerts Not Working
No pop-up alerts when signal appears
Solutions:
1 - Check EnableAlerts = true in settings
2 - Verify MT5 Options > Notifications > Enable alerts
3 - Check AlertOnNewBar = true (prevents spam)
4 - Sound may be disabled in Windows/MT5
### Problem: Dashboard Overlapping Chart
Dashboard covers important price areas
Solutions:
1 - Adjust DashboardX and DashboardY position
2 - Recommended positions:
a - Top-left: X=20, Y=30
b - Top-right: X=1200, Y=30 (for HD screens)
c - Bottom-left: X=20, Y=600
3 - Reduce DashboardFontSize to make smaller
### Problem: Slow Performance
Chart lagging or freezing
Solutions:
1 - Reduce AnalysisBars to 300-500
2 - Reduce MLTrainingBars to 500-800
3 - Disable some analysis layers:
a - UseQuantumLevels = false
b - UseFractalDimension = false
c - UseStatisticalPhysics = false
4 - Close other charts/indicators
5 - Upgrade computer/MT5 version
### Problem: Wrong Timeframe Signals
Signals do not match current timeframe
Cause: MTF analysis may show signals from higher timeframes
Solutions:
1 - Check dashboard "Timeframe Bias"
2 - Adjust MTF timeframes to closer intervals:
a - For M5 chart: Use M5, M15, M30, H1
b - For H1 chart: Use H1, H4, D1, W1
3 - Ensure current chart timeframe matches your strategy
### Problem: Order Blocks Not Drawing
No order blocks visible on chart
Solutions:
1 - Check DetectOrderBlocks = true
2 - Verify OrderBlockStrength not too high (try 2-3)
3 - Ensure UseSMC = true
4 - Order blocks may be outside visible chart area
5 - Wait for price action to form new blocks
### Problem: ML Predictions Always Wrong
ML predictions consistently fail
Causes and solutions:
A) Insufficient Training Data
1 - Increase MLTrainingBars to 2000 or more
2 - Switch to higher timeframe (more data per bar)
B) Wrong Market Conditions
1 - ML performs poorly in choppy/ranging markets
2 - Wait for clearer trends
3 - Use only during trending conditions
C) Overfitting
1 - Reduce MLNeurons to 15
2 - Increase MLPredictionHorizon to 7-10
3 - Retrain on different data
D) Need Retraining
1 - Remove and re-add indicator (retrains ML)
2 - Change pair (different market characteristics)
3 - Wait for more bars to accumulate
---
## Parameter Configuration Guide
### Conservative Settings
For risk-averse traders seeking higher quality signals:
1 - MinimumActiveLayersRequired: 4-5
2 - MinProbabilityThreshold: 055
3 - MLConfidenceThreshold: 040
4 - MTFConfluenceThreshold: 040
5 - StopLossATRMultiplier: 20
6 - RewardRiskRatio: 25
7 - OrderBlockStrength: 4
### Default Settings
Balanced approach for most traders:
1 - MinimumActiveLayersRequired: 3
2 - MinProbabilityThreshold: 045
3 - MLConfidenceThreshold: 030
4 - MTFConfluenceThreshold: 030
5 - StopLossATRMultiplier: 15
6 - RewardRiskRatio: 20
7 - OrderBlockStrength: 3
### Aggressive Settings
For experienced traders seeking more opportunities:
1 - MinimumActiveLayersRequired: 2-3
2 - MinProbabilityThreshold: 035
3 - MLConfidenceThreshold: 025
4 - MTFConfluenceThreshold: 025
5 - StopLossATRMultiplier: 12
6 - RewardRiskRatio: 15
7 - OrderBlockStrength: 2
---
## Best Practices
1 - Start with conservative settings
2 - Backtest on demo account first
3 - Never risk more than 2% per trade
4 - Use proper position sizing
5 - Follow signal confirmation process
6 - Keep trading journal
7 - Review performance weekly
8 - Adjust parameters based on results
9 - Trade only during liquid hours
10 - Combine with proper money management
---
## System Requirements
1 - MetaTrader 5 platform
2 - Minimum 4GB RAM (8GB recommended)
3 - Stable internet connection
4 - Valid broker account
5 - Sufficient historical data (1000+ bars recommended)
---
## Support and Updates
For technical support, parameter optimization assistance, or questions about signal interpretation, contact your indicator provider
Regular updates may include:
1 - Additional analysis layers
2 - Performance improvements
3 - Bug fixes
4 - New trading strategies
5 - Enhanced ML algorithms