Fractal Volatility Map
- Indicatori
- Versione: 1.81

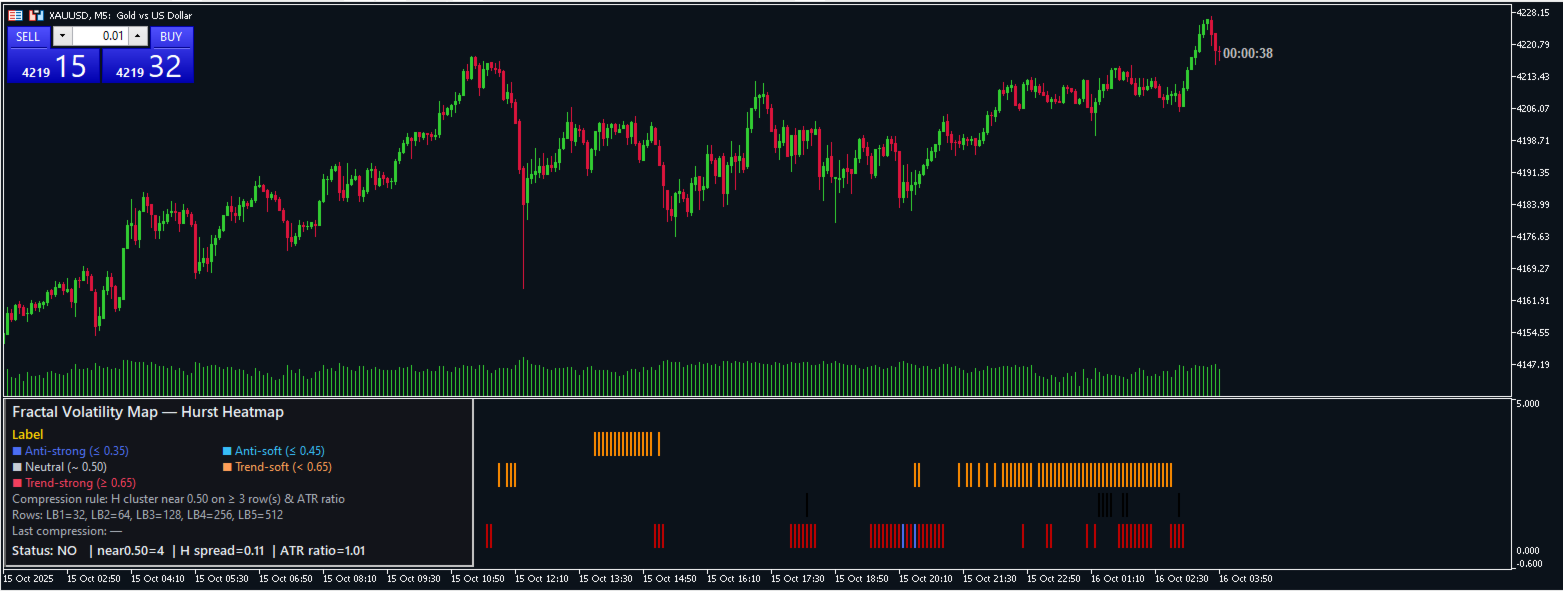
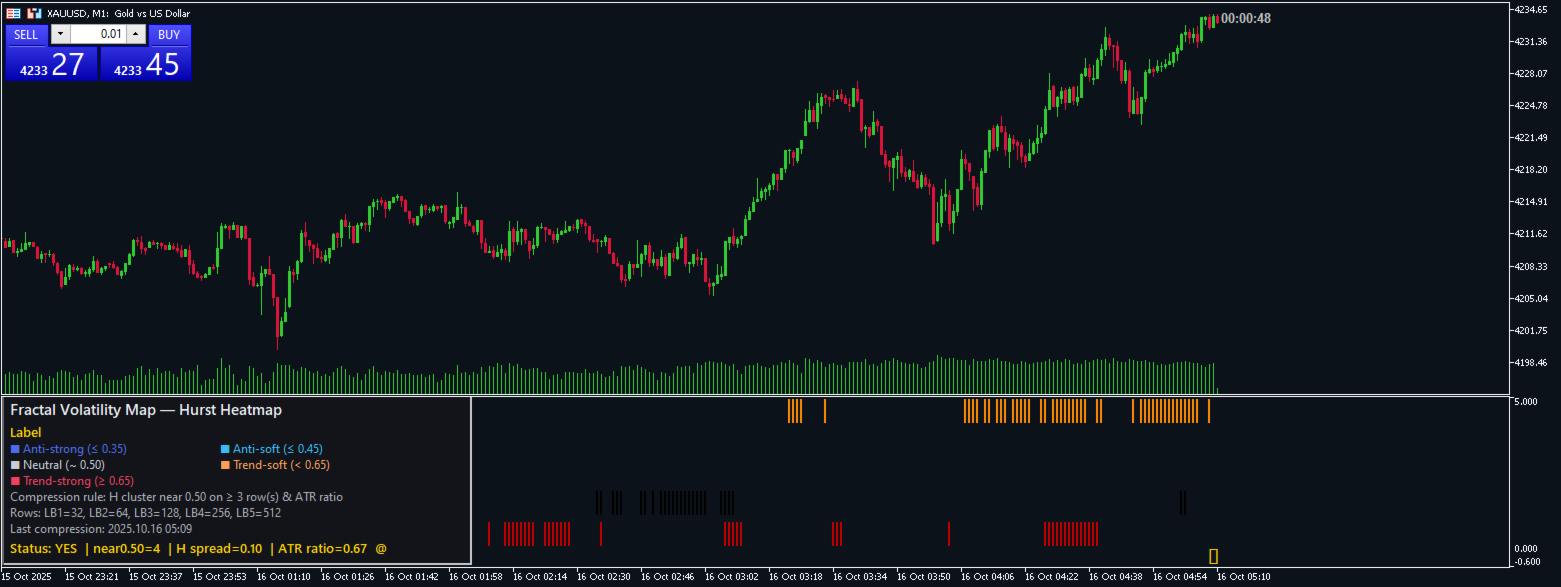
Fractal Volatility Map highlights volatility compression before expansion. It paints a five-row heatmap of the Hurst metric over multiple lookback windows and confirms compression with an ATR-based quiet-volatility check. When several rows cluster near neutral and volatility is suppressed, a Compression signal is shown on the last closed bar. This is an analysis/visualization indicator; it does not provide trading signals and does not guarantee any profit.
Main functions
- Five-row heatmap showing market character across multiple lookbacks.
- Compression signal on the last closed bar when clustering and low volatility align.
- Compact on-chart panel with legend and key stats (counts near neutral, spread, volatility ratio, last change time).
- Optional alerts on compression (popup, sound, push).
How it works (overview)
The heatmap summarizes persistence vs. mean-reversion across several windows. A simple volatility filter compares current ATR to a smoothed baseline. When rows cluster near neutral and volatility is quieter than usual, the indicator marks a potential compression zone that often precedes range breaks or directional expansions.
How to use
- Attach the indicator to any MT5 chart.
- Watch for a Compression signal on the last closed bar.
- Plan entries around a confirmed break of your chosen structure (for example, recent range or session high/low) and manage risk with your own rules.
- If the market is very noisy, increase smoothing or require stronger clustering; if signals are too rare, relax those settings.
Customization (Inputs)
- Lookback windows: choose up to five row lengths.
- Clustering: tolerance near neutral, minimum rows required, maximum spread across rows.
- Volatility filter: ATR period, smoothing length, required quiet-volatility ratio.
- Display: panel visibility and layout, text sizes, paddings, color palette or custom colors.
- Alerts: enable/disable popup, sound, and push notifications.
Notes
- No DLLs required; no external libraries.
- Indicator only; it does not open, manage, or close trades.
- Results may vary by broker feed and available history; more history improves stability.
Limitations
- Compression does not imply direction by itself; use your own confirmation and risk management.
- Very unusual conditions may reduce clustering quality; adjust sensitivity if needed.
Support
If you find this tool helpful, your honest review or rating is appreciated. It motivates further development and helps prioritize useful features for future updates.
Updates
Updates may be published to maintain the stated functionality. Users can install updates at their discretion.