Multi TF Mini Chart
- Indicatori
- Versione: 1.0
- Attivazioni: 5

Mini Chart (Canvas) is a lightweight, interactive sub-chart that overlays directly onto your main MetaTrader 5 chart. Designed for traders who want a compact, customizable view of another symbol or timeframe, this tool delivers real-time price action in a clean, resizable canvas — perfect for multi-symbol monitoring, scalping setups, or visual strategy overlays.
Key Features:
• Multi-Symbol & Multi-Timeframe Support: Display any symbol and timeframe independently from the main chart.
• Resizable & Draggable: Move and resize the mini chart freely using intuitive mouse controls.
• Custom Styles: Choose between candlesticks, OHLC bars, or line charts for visual clarity.
• Grid & Price Labels: Optional horizontal grid lines and dynamic price labels for quick reference.
• Fixed or Auto-Scaling Price Range: Lock in a price range or let the chart auto-scale based on recent data.
• Zoom Control: Adjust the zoom level to fit more or fewer candles within the mini chart.
• Canvas-Based Rendering: Uses the high-performance engine for smooth visuals and minimal resource usage.
Ideal For:
• Traders who want a secondary chart view without switching tabs
• Strategy developers testing multi-symbol overlays
• Scalpers and intraday traders needing compact visual references
• Dashboard-style layouts with embedded mini charts
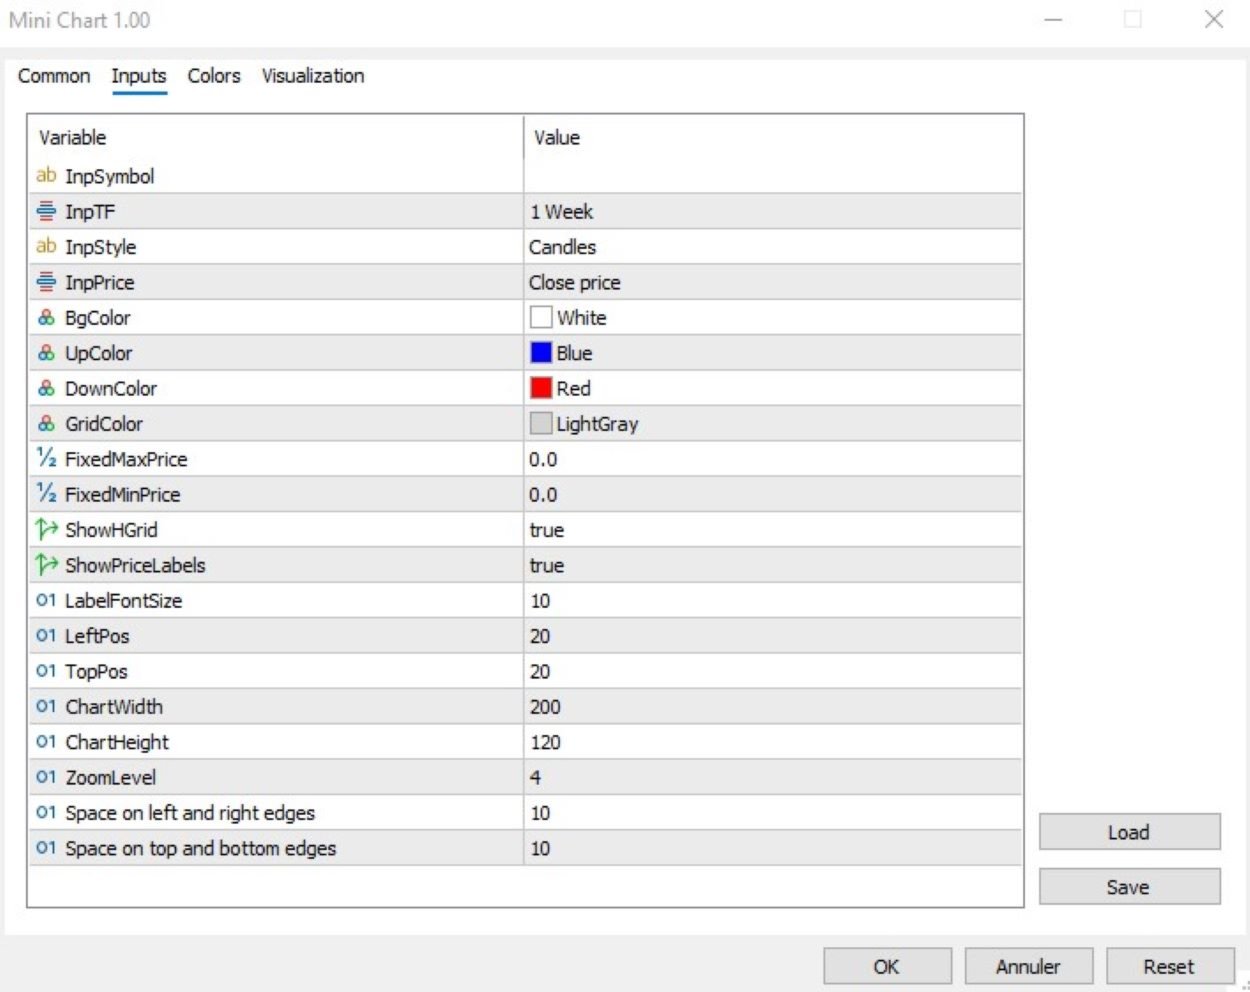
Inputs Overview:
• Symbol to display (leave blank to use current)
• Timeframe of the mini chart
• Chart style ("Candles", "Bars", or "Line")
• Optional price range lock
• Toggle grid and labels
• Initial position and size
• Controls candle spacing