Initial Balance Session
- Indicatori
- Versione: 3.1
- Aggiornato: 22 maggio 2026
- Attivazioni: 5

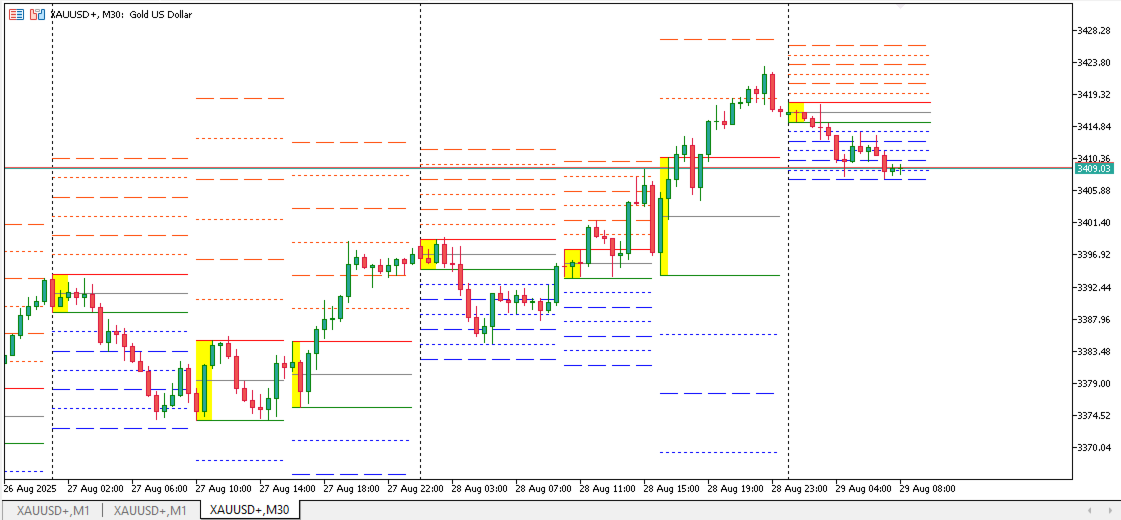
The Initial Balance Indicator is a professional-grade tool for MetaTrader 5 traders, designed to enhance your trading by visualizing key price levels during the Australia, Tokyo, London, and US market sessions. This indicator plots the Initial Balance (IB) range—the high, low, and midpoint prices—formed during the first hour of each session, with a customizable box to highlight the range and optional extension levels for advanced analysis. Optimized for smooth, flicker-free performance, it’s ideal for day traders, scalpers, and swing traders looking to identify critical support, resistance, and breakout zones with precision.
How It Works
The Initial Balance Indicator tracks the price range established during the first hour or first 15/30 minutes of four major trading sessions each day:
-
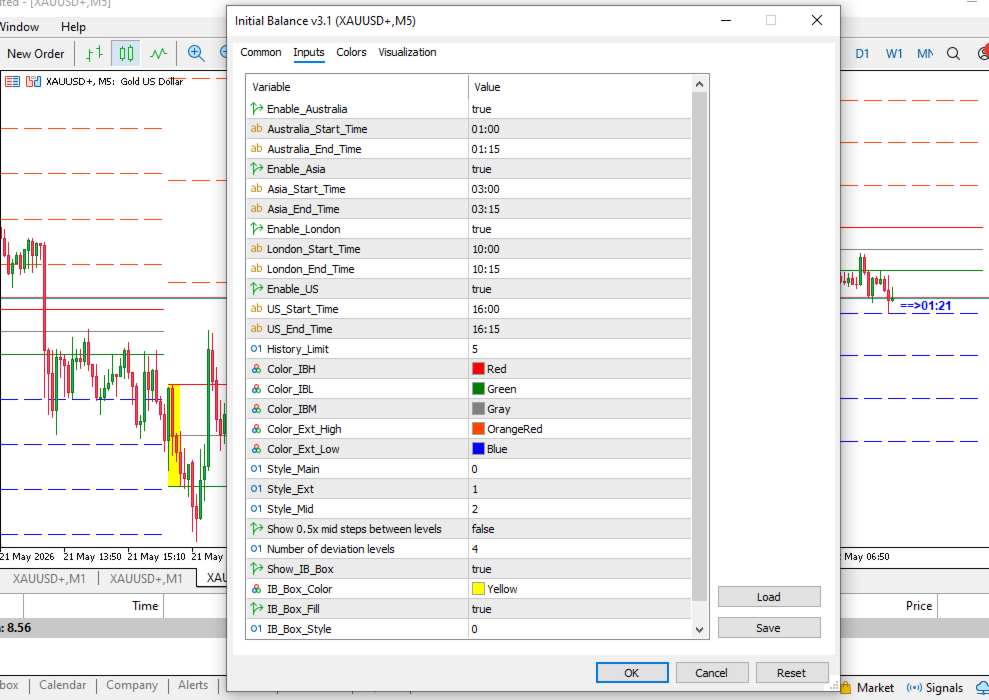
Australia Session: 01:00–01:15
-
Tokyo Session: 03:00–03:15
-
London Session: 09:00–09:15
-
US Session: 16:00–16:15
Here’s how it functions:
-
Plots the Initial Balance Range:
-
IB High (IBH): The highest price during the session’s first hour or first 15/30 minutes.
-
IB Low (IBL): The lowest price during the session’s first hour or first 15/30 minutes.
-
IB Mid (IBM): The midpoint between IBH and IBL, a key reference for market balance.
-
Draws Horizontal Lines:
-
Lines for IBH, IBL, IBM, and extended levels (2x, 3x, 4x the IB range above and below) extend from the session’s start to the next session’s start (e.g., Tokyo to 09:59, London to 15:59, US to the next day’s Asia start).
-
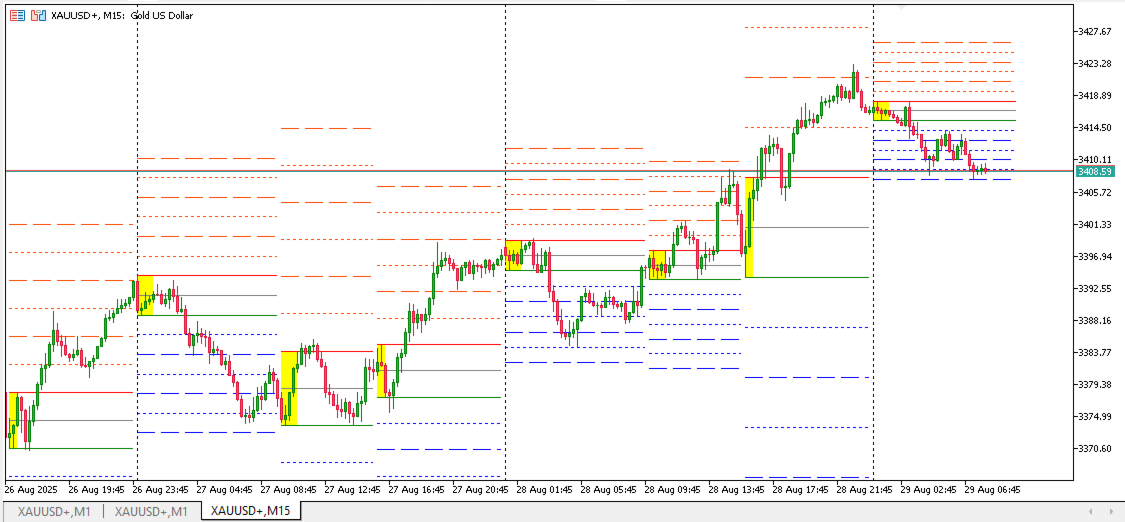
Optional midline deviations (1.5x, 2.5x, 3.5x) provide additional price targets.
-
Highlights the IB Range with a Box:
-
A customizable rectangle marks the IB range from the session’s start to end, making it easy to spot the price zone where the market established its initial range.
-
Real-Time Updates:
-
During an active session, the indicator updates IBH, IBL, and derived levels only when new highs or lows occur, ensuring smooth performance without constant flickering.
-
Historical Analysis:
-
Displays IB ranges for up to a user-defined number of past days, perfect for studying historical price behavior.
-
Optimized Performance:
-
Version 3.1 OPTIMIZED & CLEAN
Flicker-free IB with per-object updates & minimal redraws
Performance: Only updates when data actually changes
Benefits for Traders
-
Smooth Visuals: Enjoy flicker-free charts with optimized updates, keeping your focus on trading decisions.
-
Clear Price Levels: Identify key support, resistance, and breakout zones for each session with easy-to-read lines and boxes.
-
Customizable: Adjust session times, colors, line styles, and visibility options to match your trading strategy.
-
Multi-Session Support: Covers Asia, London, and US sessions, making it versatile for global markets.
-
Enhanced Analysis: Use extension levels (2x, 3x, 4x, etc.) and midlines (1.5x, 2.5x, 3.5x, etc) to anticipate price targets and reversals.
-
Efficient and Reliable: Optimized to minimize CPU usage, ensuring fast performance even on lower timeframes.
How to Use
-
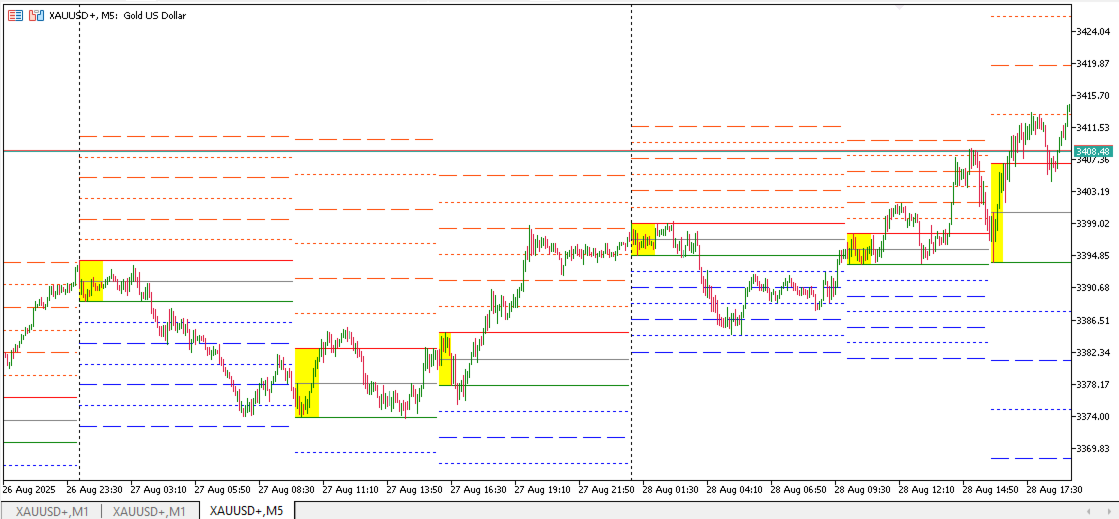
Apply to Chart: Add the indicator to your MetaTrader 5 chart for any symbol and timeframe (recommended: M1, M5, or M15 for precise session tracking).
-
Customize Settings: Adjust session times to match your broker’s server time zone, and modify colors, styles, and history limits to fit your preferences.
-
Analyze Key Levels: Use IB High, Low, and Mid lines, along with extension and midline levels, to identify entry, exit, or stop-loss points.
-
Monitor IB Boxes: The highlighted IB range helps you visualize volatility and potential breakout zones during each session.