ReversalIn
- Indicatori
-
Paulus Femi Leunufna
 I’m not here to chase perfection.
I’m here to build systems that survive storms, not just sunny skies.
As a trader and system creator, I focus on clarity, adaptability, and long-term resilience.
Trading isn’t just numbers — it’s psychology, patience, and purpose. - Versione: 1.0
- Attivazioni: 20
## Signal Types
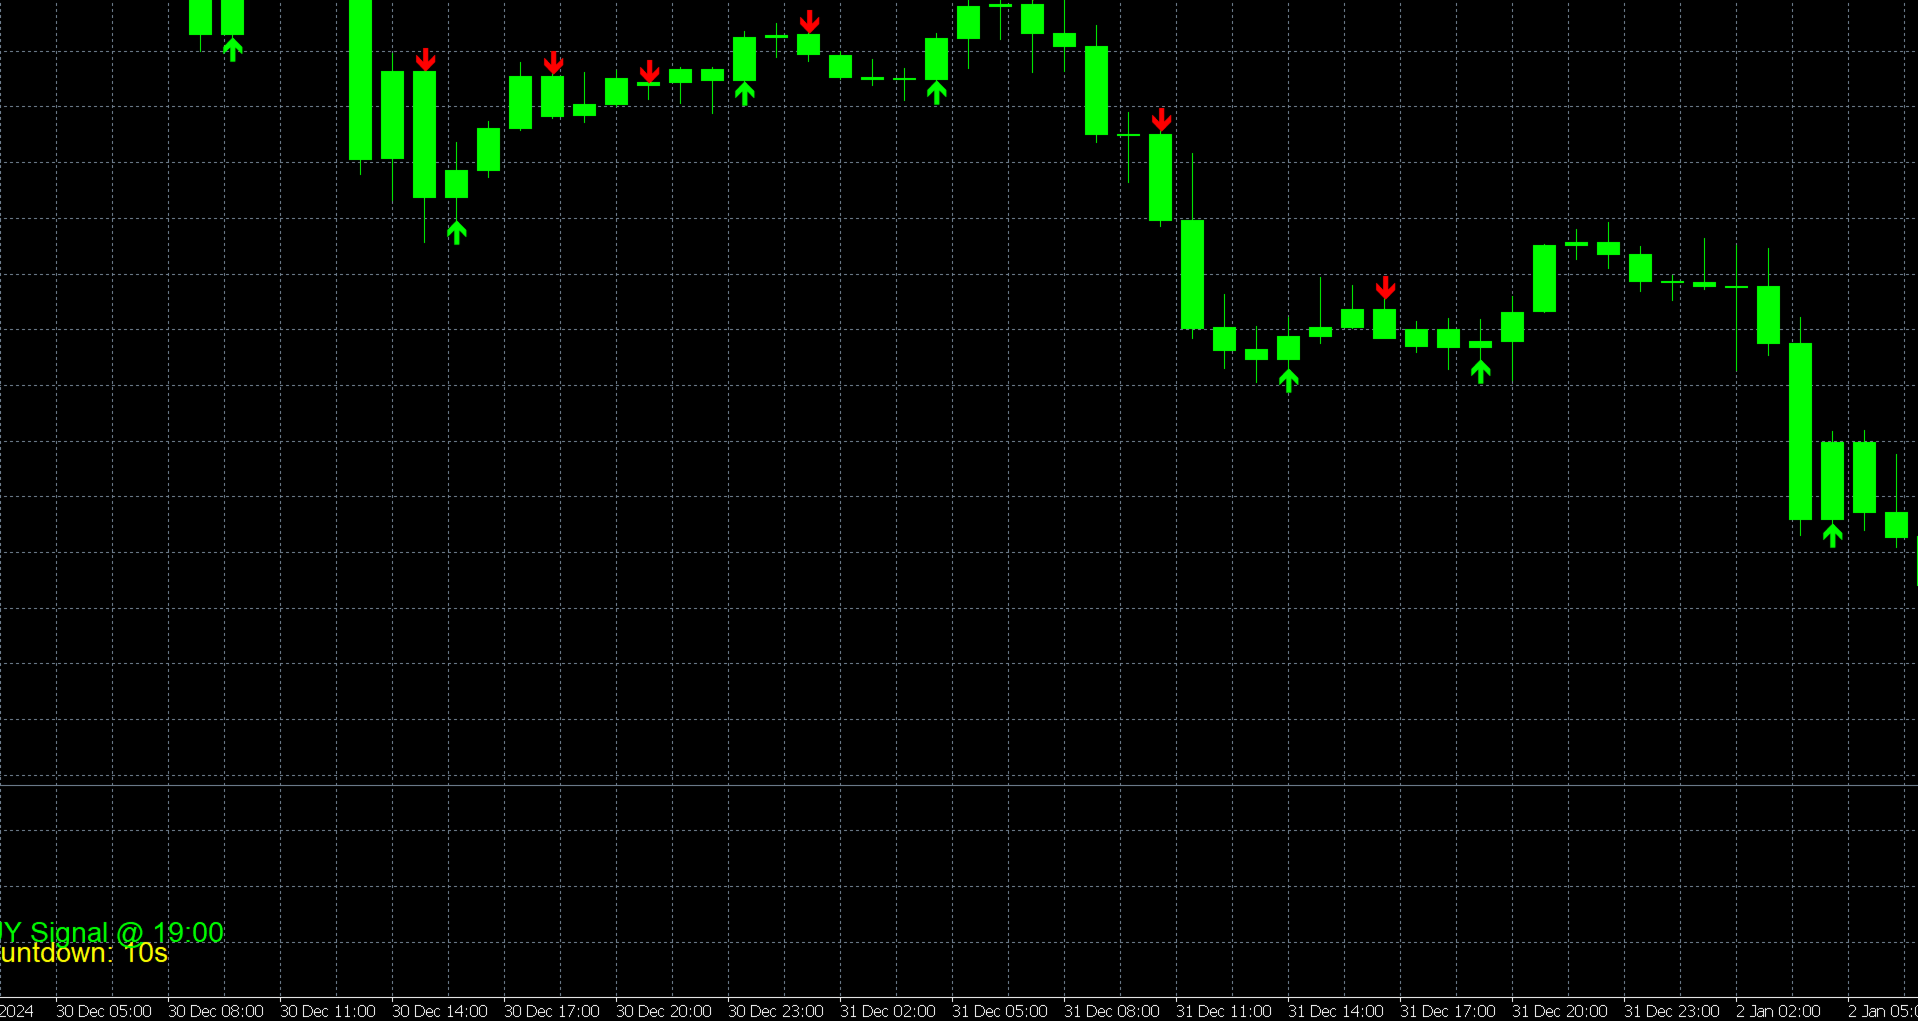
### Buy Signal
- Appears when a bullish reversal pattern is detected
- Green arrow appears below the candle
- Candles turn green during signal duration
- "BUY Signal" label appears with timestamp
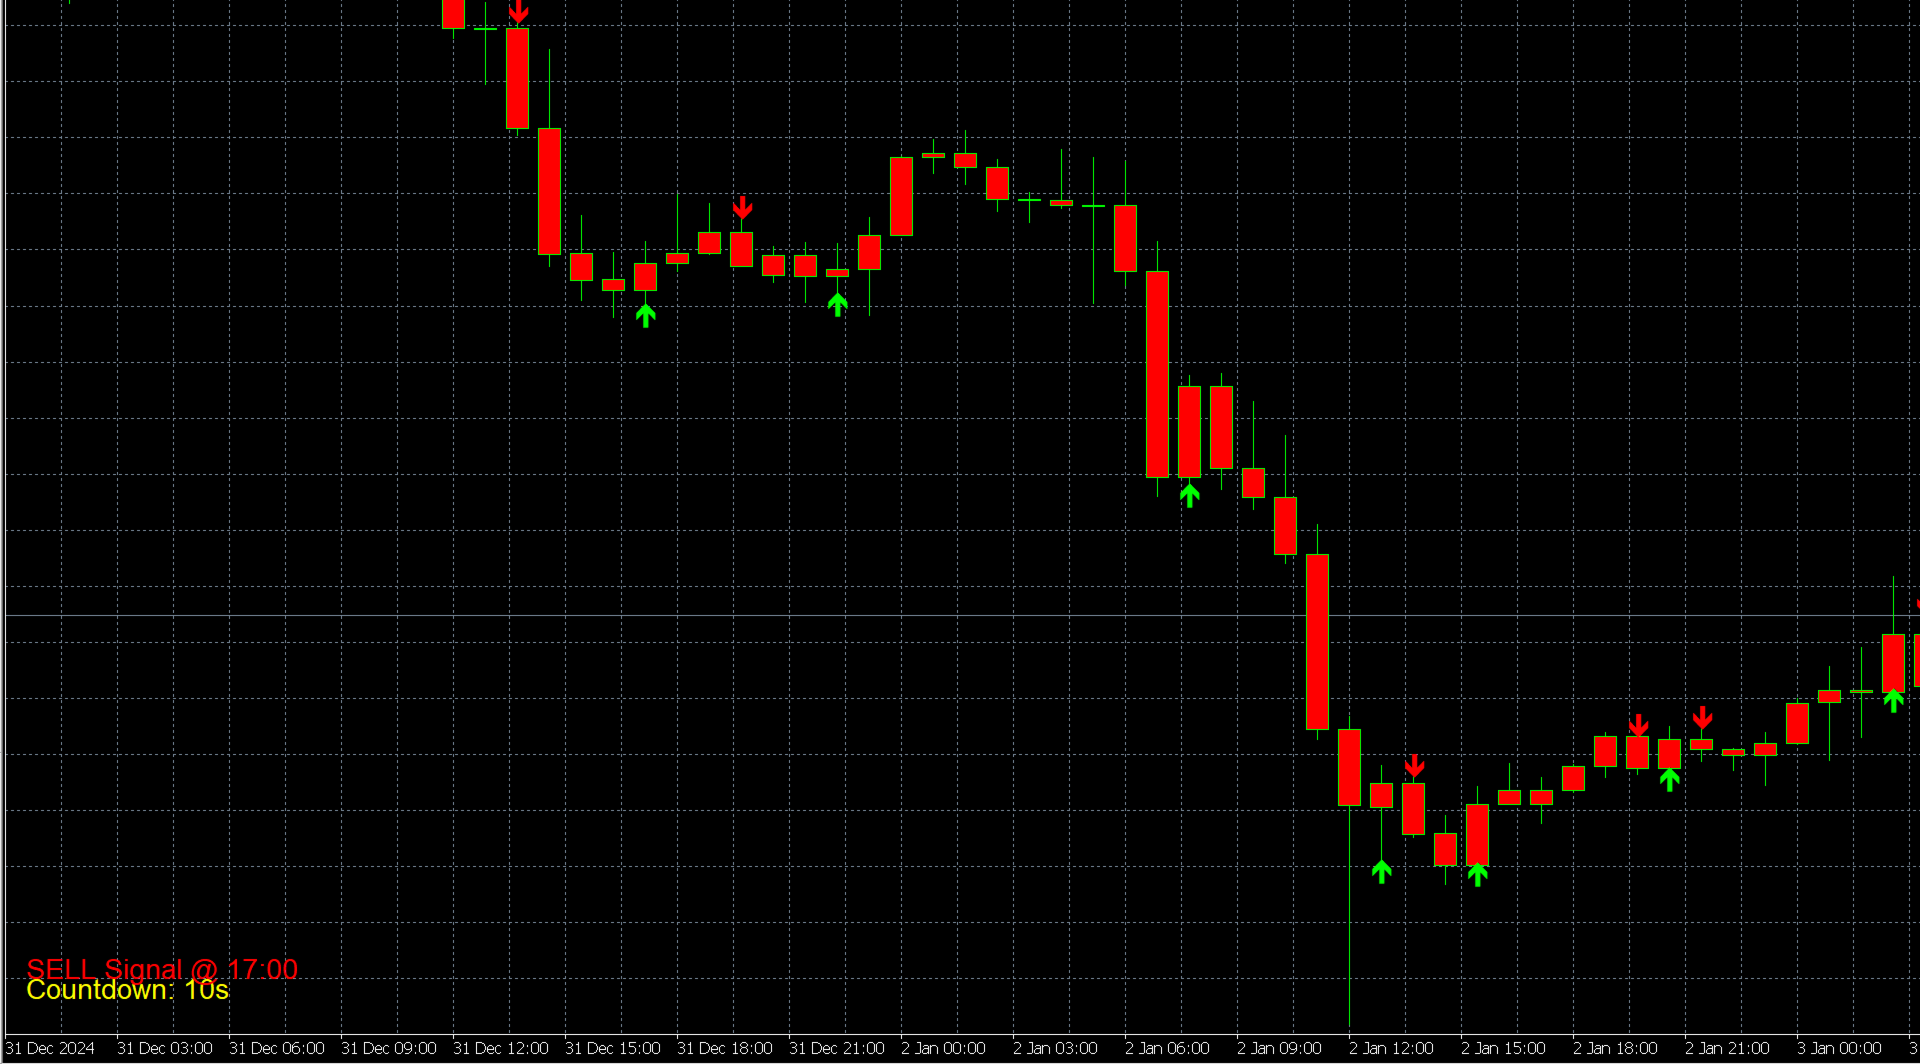
### Sell Signal
- Appears when a bearish reversal pattern is detected
- Red arrow appears above the candle
- Candles turn red during signal duration
- "SELL Signal" label appears with timestamp
## Best Practices
1. **Timeframe Selection**
- Works on all timeframes
- Recommended for M15 and above for better signal quality
2. **Signal Confirmation**
- Wait for the countdown timer
- Check for additional technical confirmations
- Consider market context and trend
3. **Risk Management**
- Don't rely solely on indicator signals
- Use appropriate stop-loss levels
- Follow your trading plan and risk parameters