Volume and Tick Profile
- Indicatori
-
Martin Slacka
 Hi im just young boy from Slovakia who everyday trade and try cooking some trading robots
 - Versione: 1.0
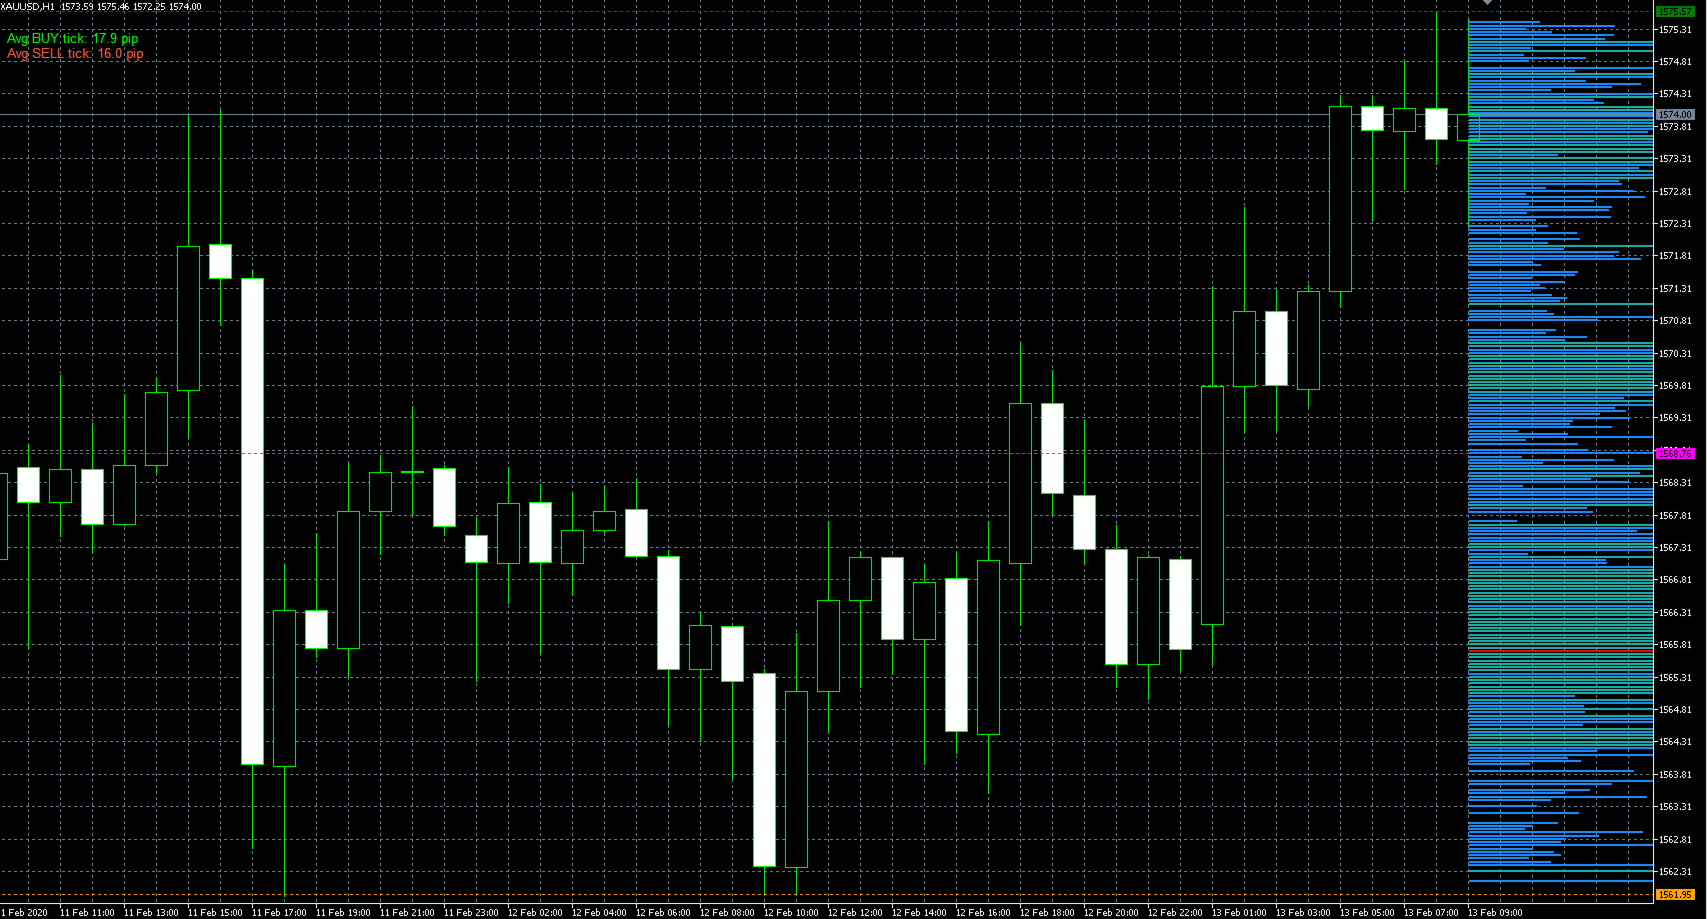
The Volume Profile Indicator is a powerful tool designed for MetaTrader 5. It visualizes market activity using volume distribution across price levels, showing:
-
Histogram of volume at each price bin
-
POC (Point of Control) – the price with the highest traded volume
-
Value Area – the range covering a configurable percentage of volume (e.g. 70%)
-
Support levels: Min, Max, and Pivot
-
Average tick size for BUY and SELL movements
| Parameter | Description |
|---|---|
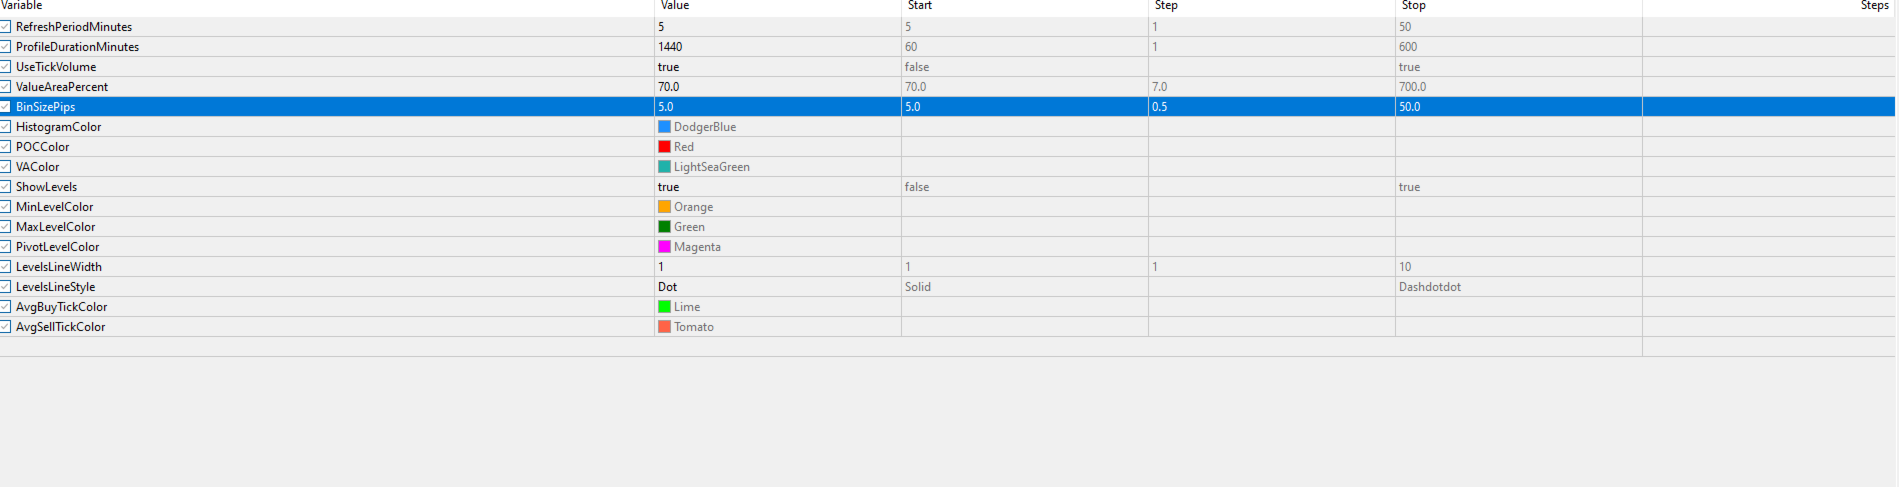
| RefreshPeriodMinutes | Time interval for indicator refresh (in minutes) |
| ProfileDurationMinutes | How far back to calculate volume profile (in minutes) |
| UseTickVolume | If true , uses tick volume; if false , uses real volume (if available) |
| ValueAreaPercent | Percentage of total volume to include in Value Area |
| BinSizePips | Size of each price bin in pips |
| HistogramColor | Color for normal volume bars |
| POCColor | Color for the Point of Control line/bar |
| VAColor | Color for bars within the Value Area |
| Parameter | Description |
|---|---|
| ShowLevels | Toggle to display Min, Max, and Pivot levels |
| MinLevelColor | Color of the Minimum price level line |
| MaxLevelColor | Color of the Maximum price level line |
| PivotLevelColor | Color of the Pivot line (midpoint of min and max) |
| LevelsLineWidth | Line width for levels |
| LevelsLineStyle | Line style (solid, dotted, dashed, etc.) |
| Parameter | Description |
|---|---|
| AvgBuyTickColor | Color of the label showing average upward tick movement |
| AvgSellTickColor | Color of the label showing average downward tick movement |
-
Volume bars are displayed horizontally on price levels.
-
POC is highlighted for easy identification.
-
Optional support levels and tick stats are shown in the upper left of the chart.
-
The indicator is designed to run in the main chart window.
-
Identifying strong price levels with high trading interest.
-
Detecting potential support/resistance zones.
-
Confirming volume-weighted market structure.
-
Analyzing market reactions to price imbalance zones.