MultiVision Dashboard
- Indicatori
- Versione: 1.0

MultiVision Dashboard – Monitor Multiple Markets at a Glance.
The MultiVision Dashboard is an advanced, user-friendly MQL5 indicator that allows traders to monitor multiple symbols and timeframes simultaneously in a single, intuitive dashboard. It's designed to simplify market analysis by presenting essential data clearly, helping traders quickly identify opportunities and make better trading decisions.
Key Features
Flexible Symbol & Timeframe Selection
- Customize the dashboard with your preferred symbols and timeframes or display all symbols directly from Market Watch.
- Quickly switch views to monitor favorite pairs or the broader market.
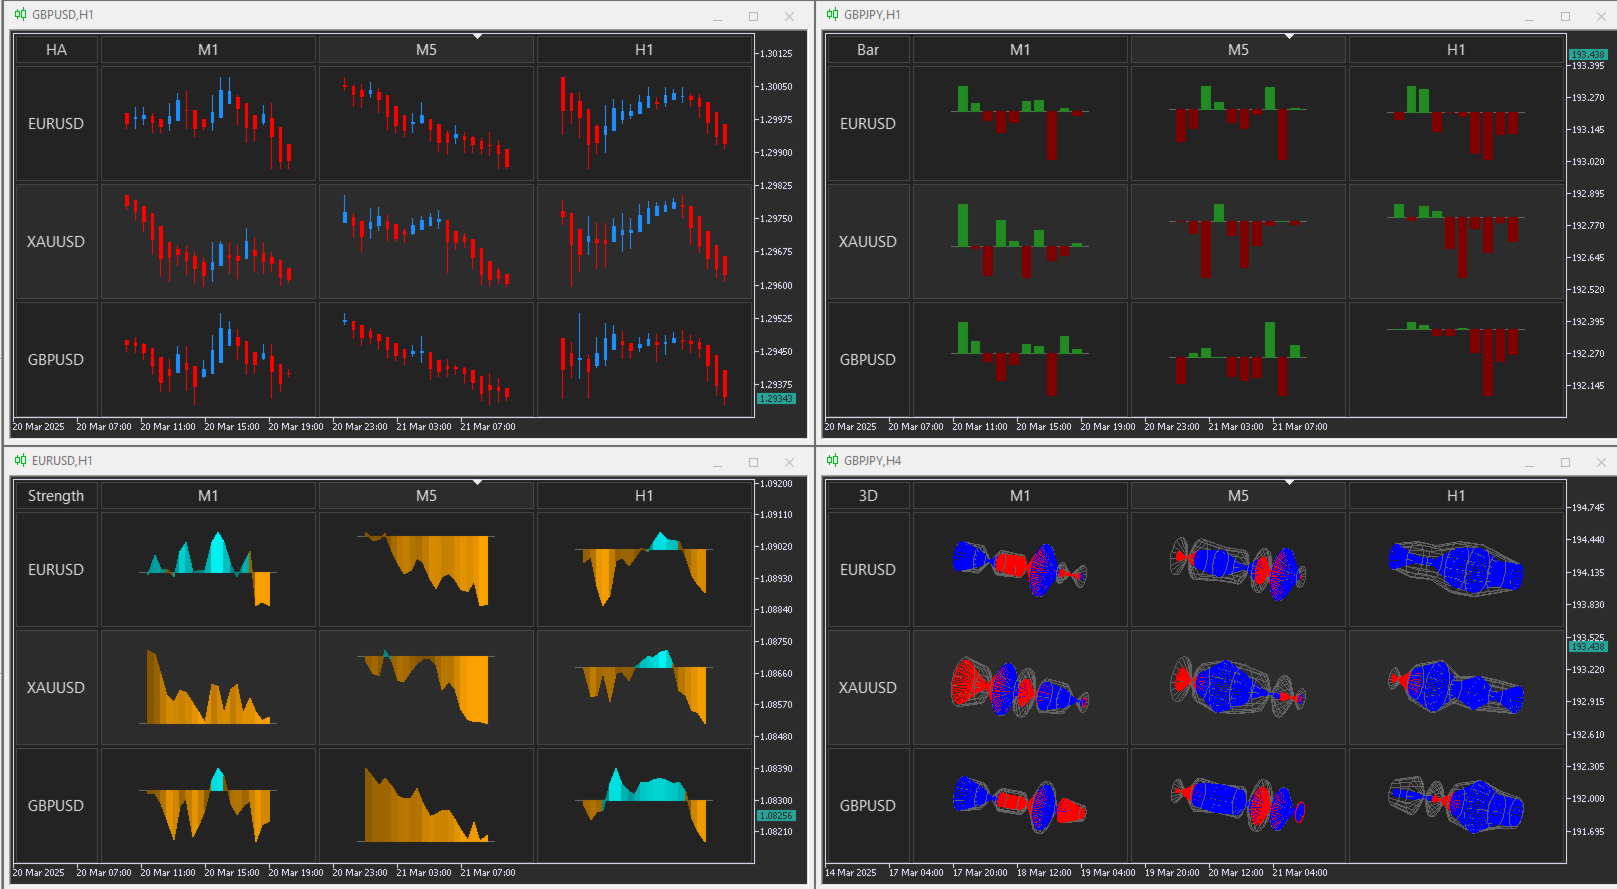
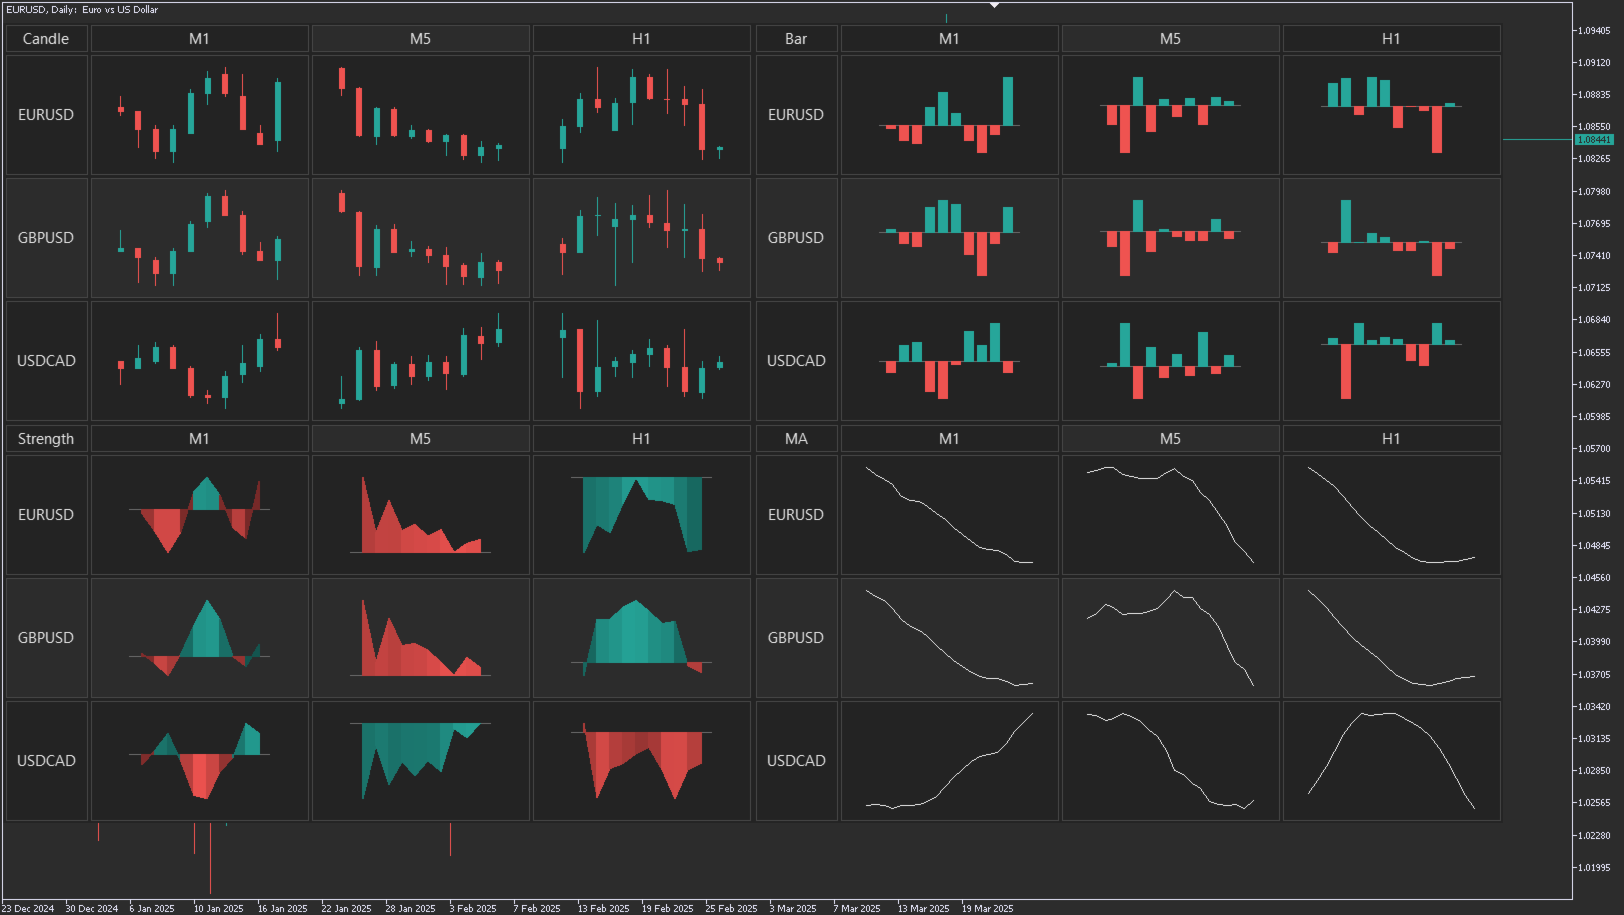
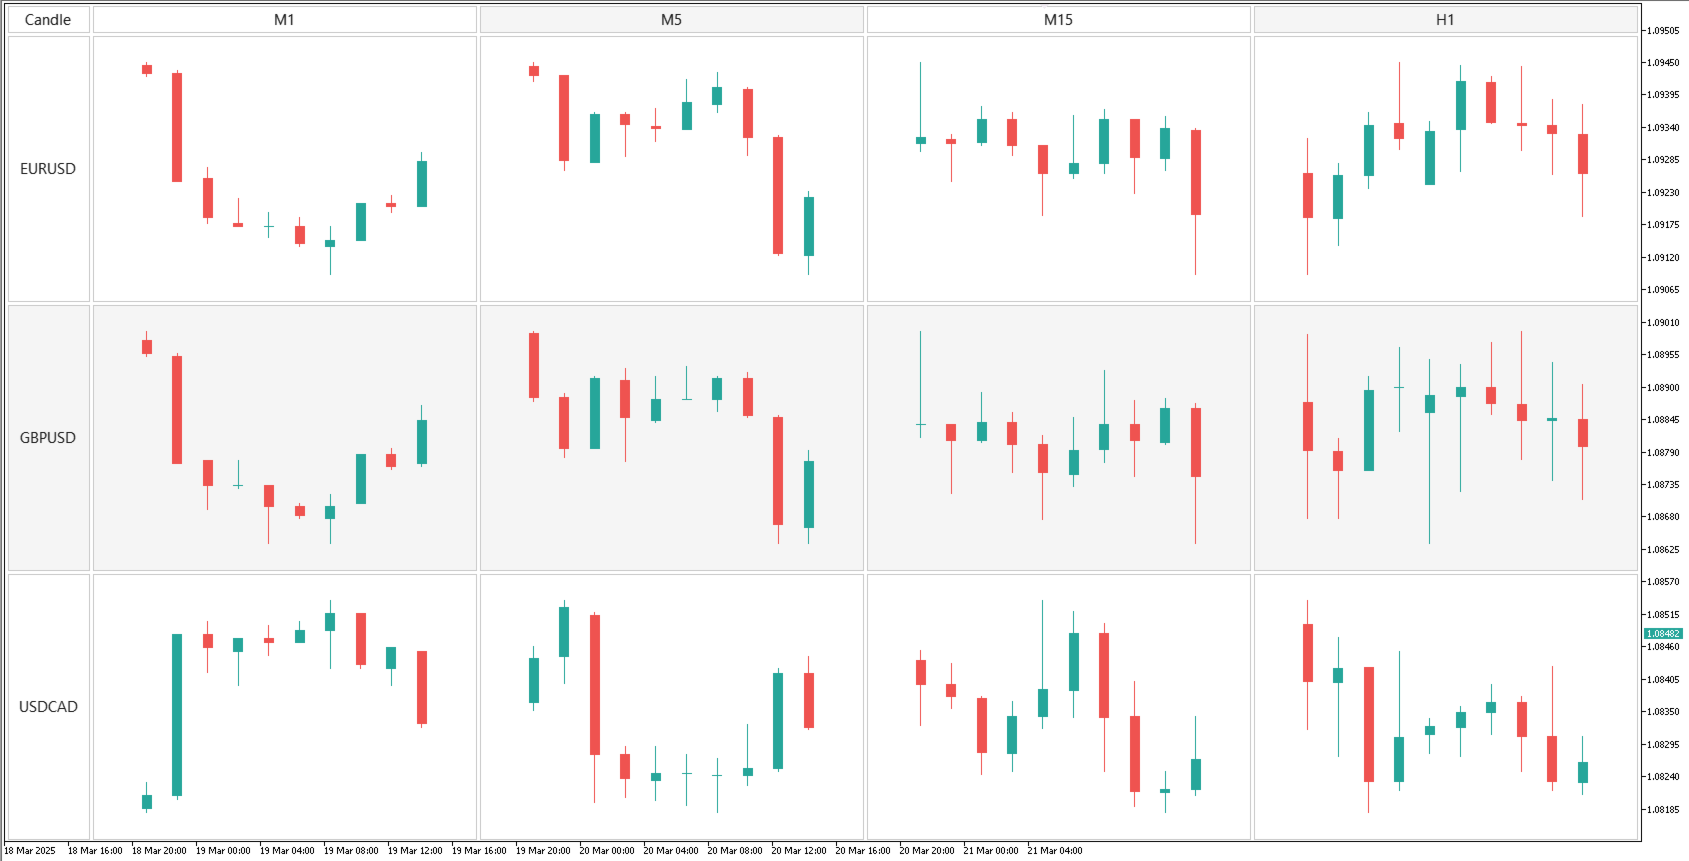
9 Customizable Visualization Modes
1. Standard Candlestick Chart:
- Traditional candlestick view for easy pattern recognition.
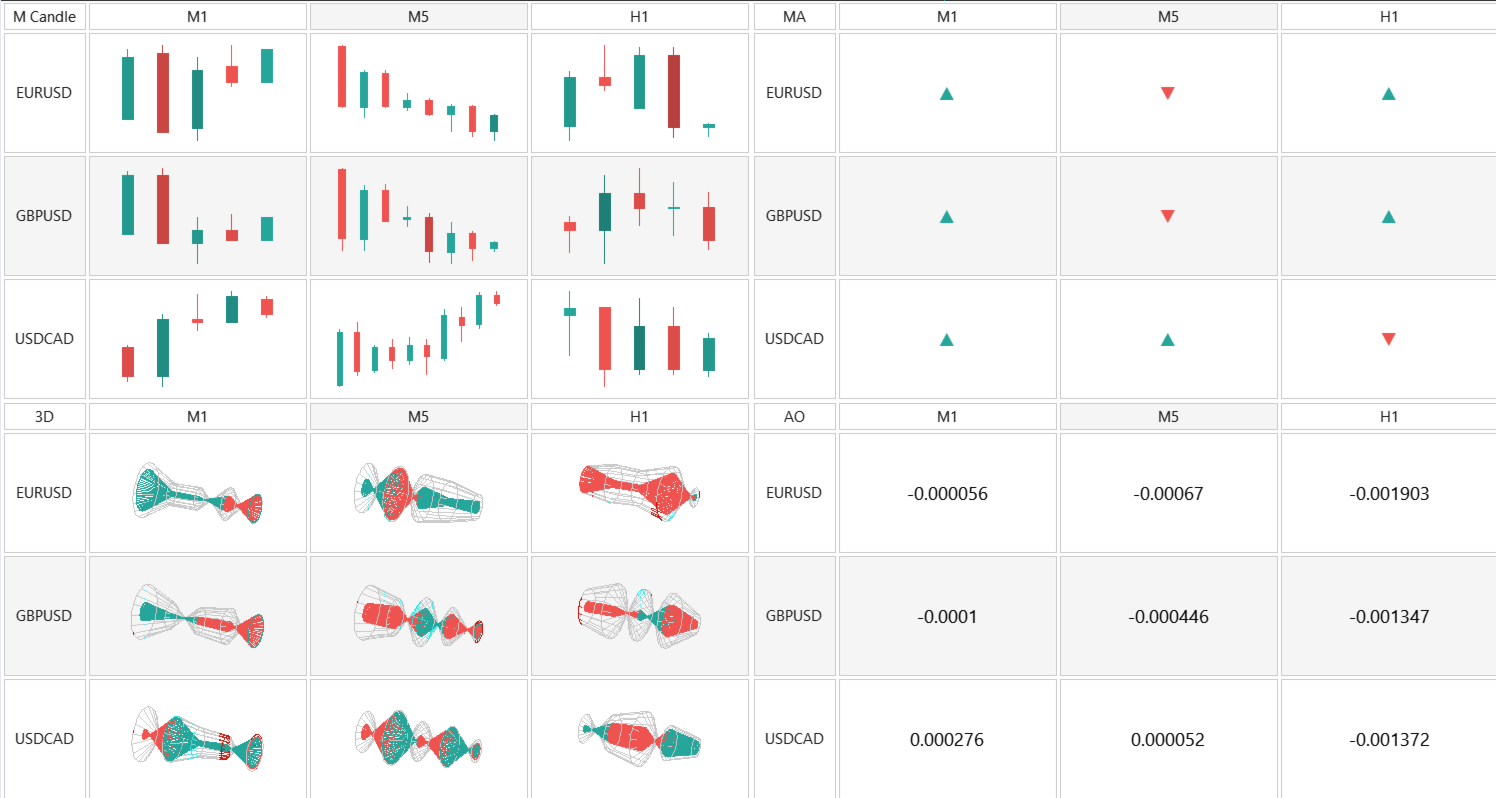
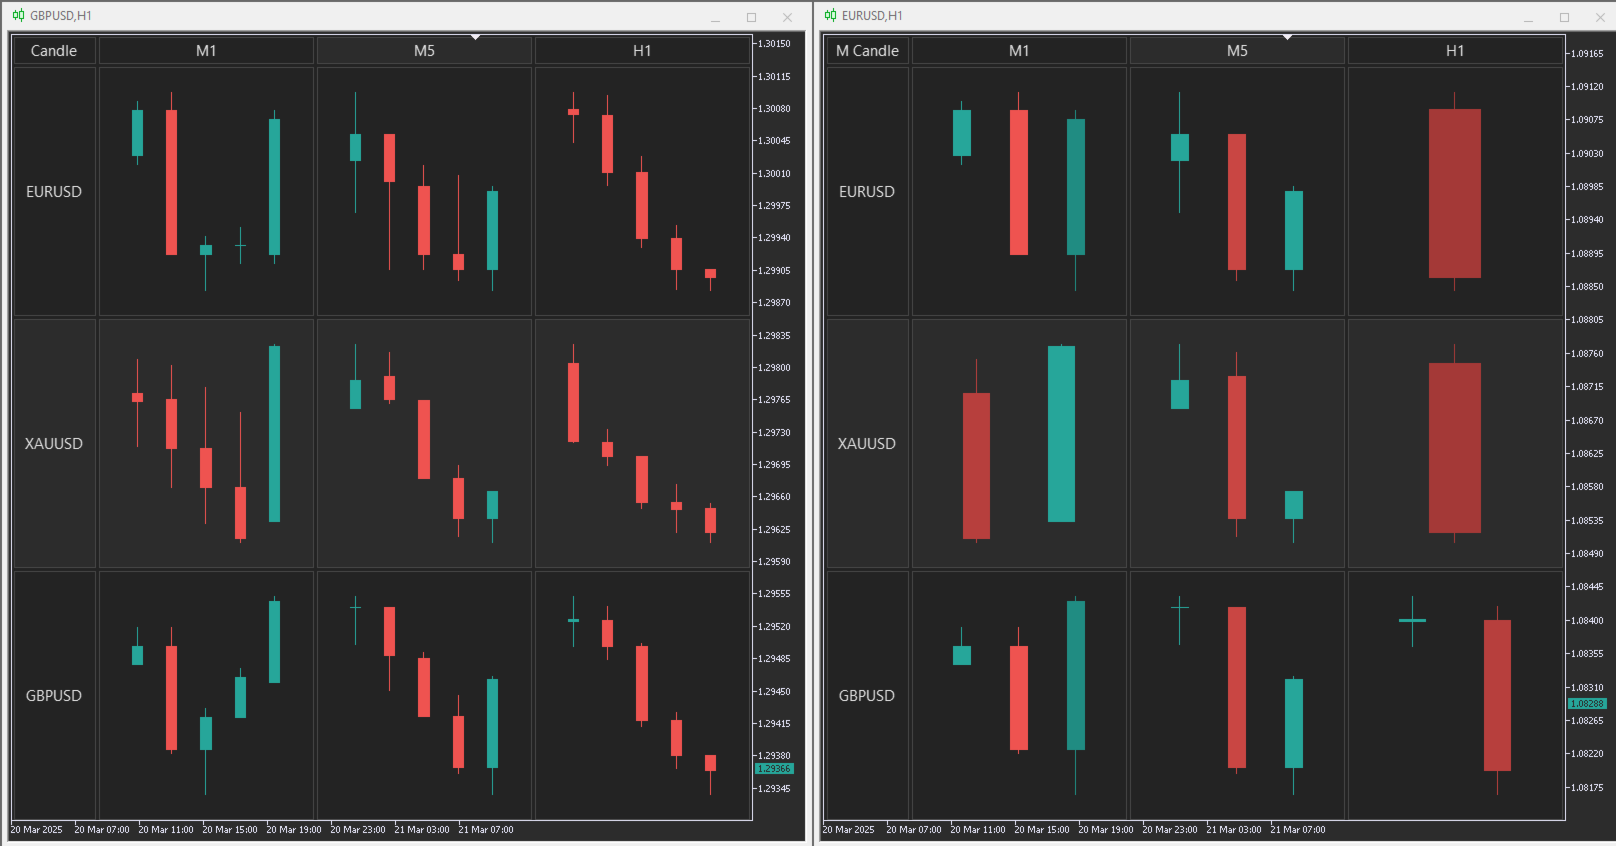
2. Merged Candles:
- Combines consecutive bullish or bearish candles into one, highlighting market momentum.
- Customize color intensity based on the number of candles merged, or set it to 0 for standard colors.
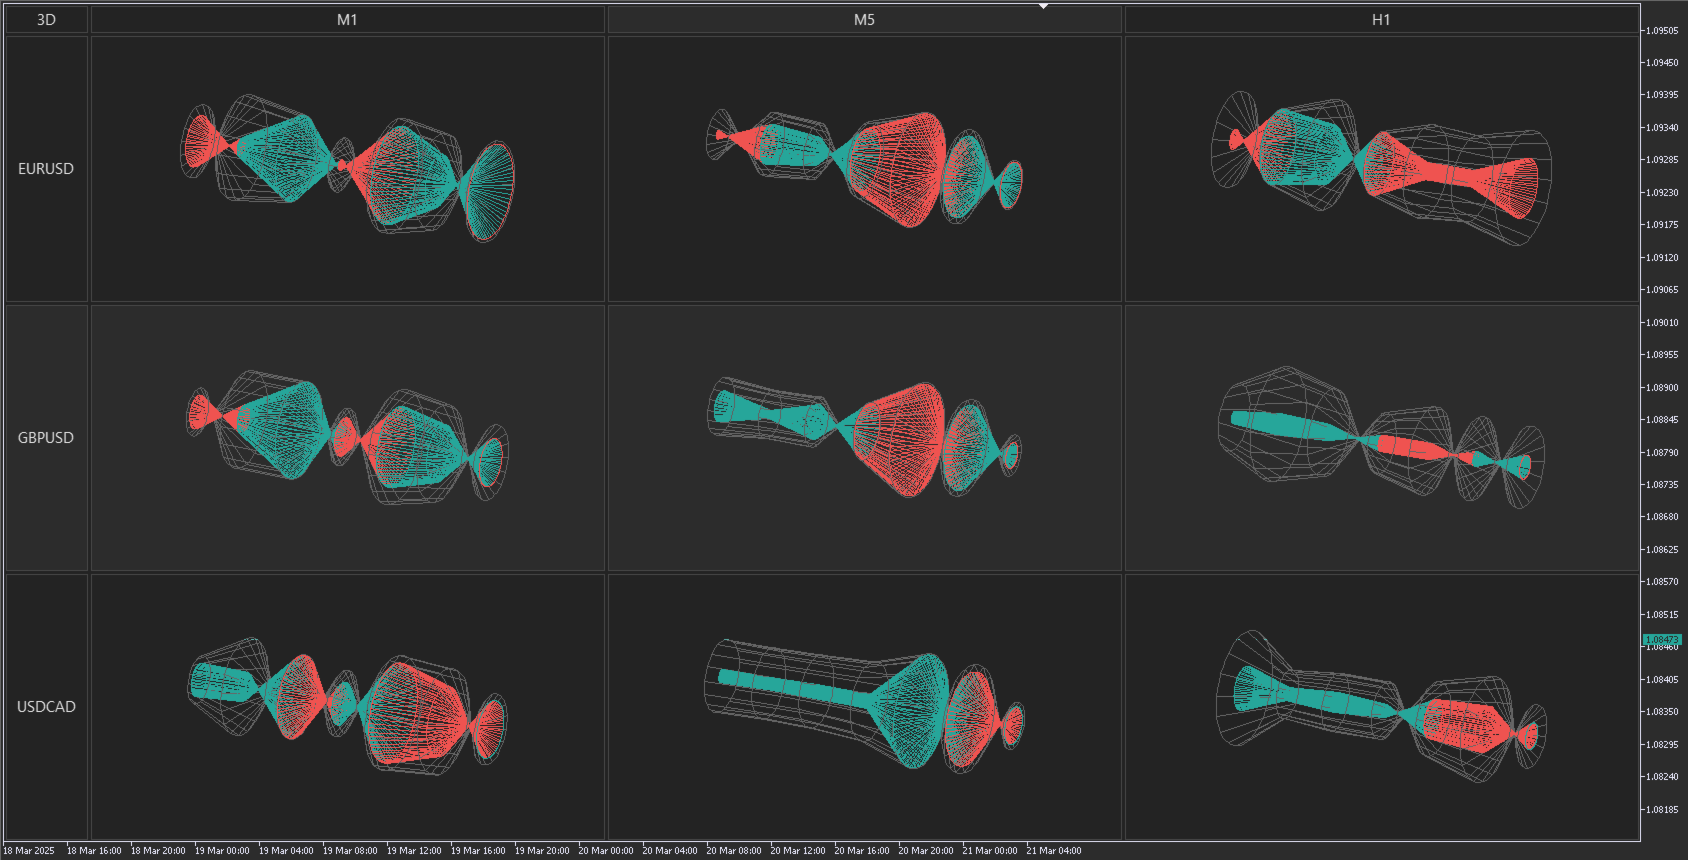
3. 3D Wireframe Candles:
- Interactive 3D candlesticks that clearly depict price dynamics.
4. Vertical Bar Chart:
- Simplified bar charts for quick visual comparison of price movements.
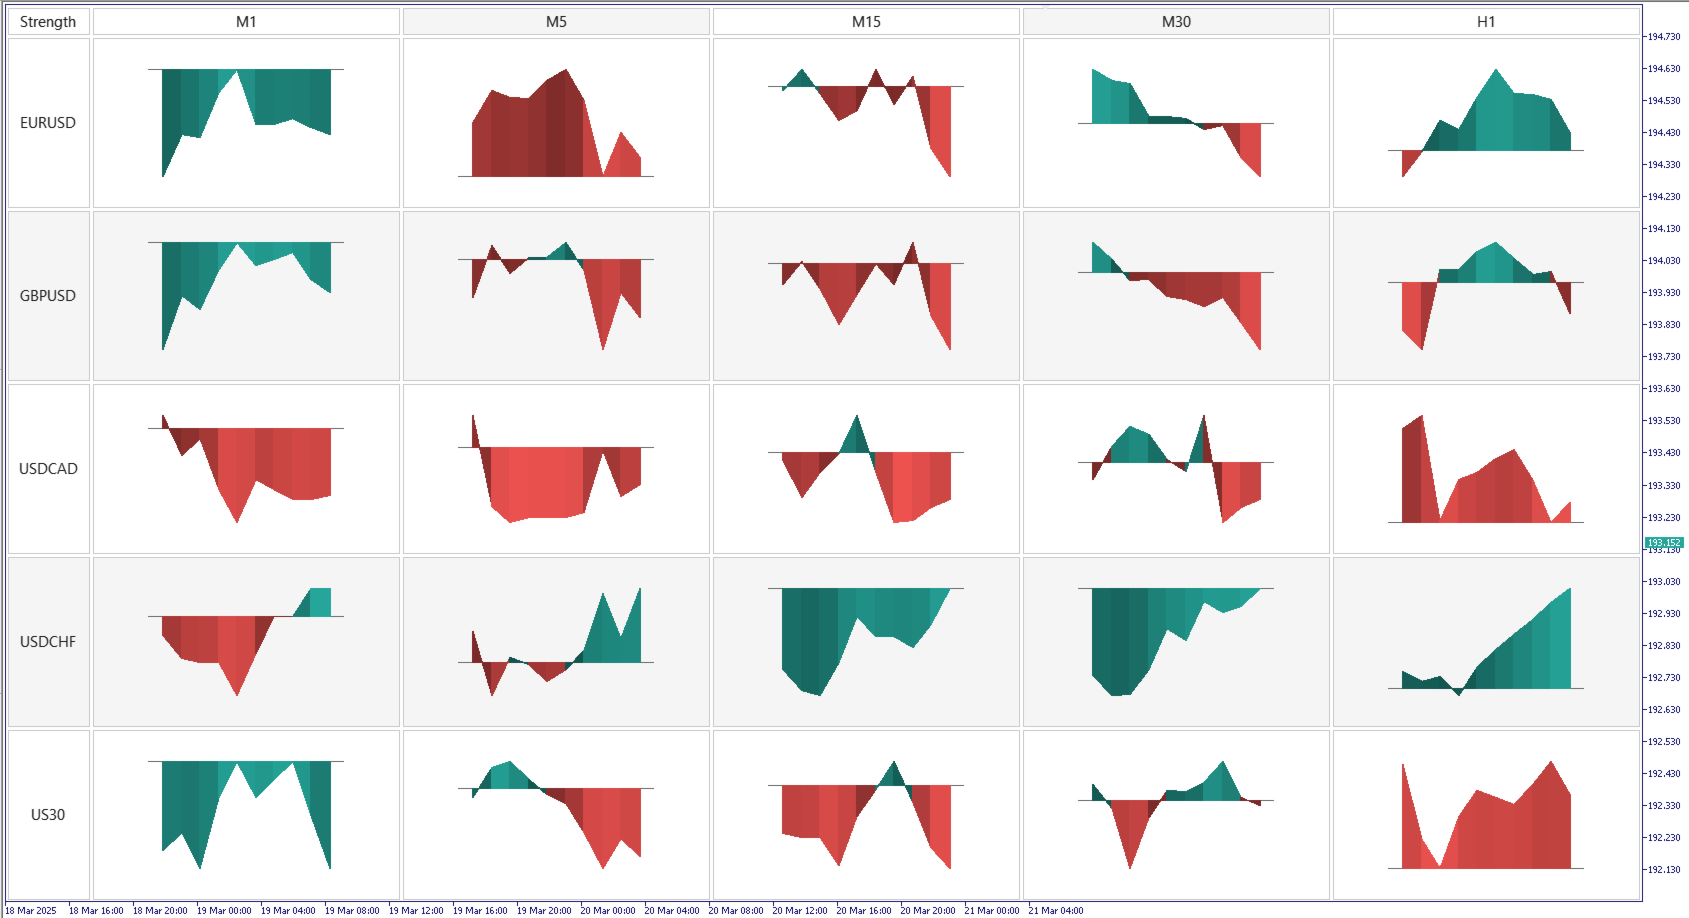
5. Strength Meter:
- Displays cumulative strength and momentum using dynamic color shading.
6. Heiken Ashi Candles:
- Smooth Heiken Ashi candles to clearly identify trends by filtering out market noise.
7. Indicator Arrows:
- Shows directional arrows comparing the current indicator value with the previous candle, quickly highlighting momentum shifts.
8. Indicator Numeric Values:
- Displays precise numeric values of the selected indicator.
9. Indicator Line Charts:
- Compact line charts visualizing indicator trends based on the first buffer of your selected indicator.
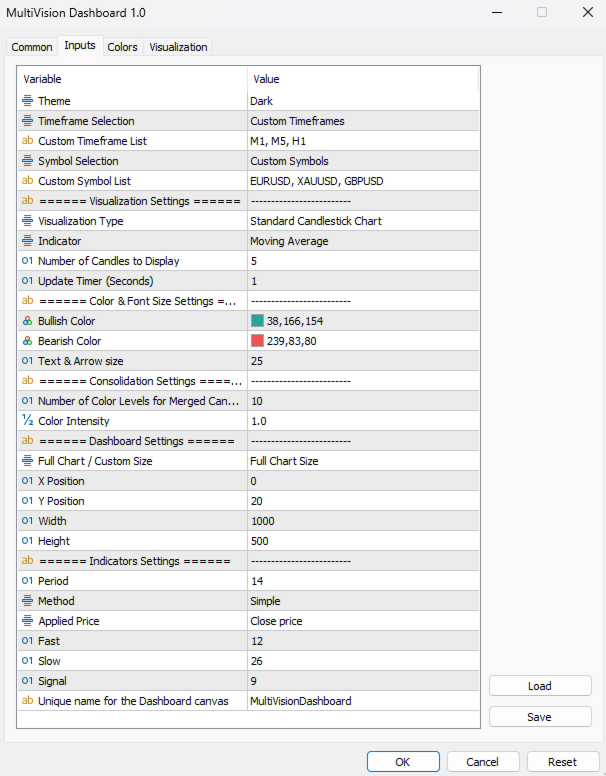
Customization & Design
- Choose between dark or light themes.
- Adjust text sizes, dashboard dimensions, and screen positioning.
- Control the scale and appearance of mini-charts within each cell for optimal clarity.
Indicator Flexibility
- Customize widely-used indicators such as Moving Average, MACD, RSI, and others.
- Easily set indicator parameters (period, method, applied price).
Attach Multiple Dashboards
- Attach multiple dashboard instances on a single chart by assigning unique canvas names.
- Adjust the size and position (coordinates) of each dashboard instance to organize your workspace effectively.
Automatic Real-time Updates
- Market data updates automatically based on your preferred refresh intervals.
How to Use
- Select Symbols & Timeframes: Choose which markets and time periods you wish to monitor.
- Choose Visualization Mode: Pick from standard candles, merged candles, indicators, and more.
- Customize Dashboard Appearance: Set theme, sizes, and dimensions to match your trading needs.
- Configure Indicators: Define parameters for popular indicators like MA, MACD, and RSI to tailor analysis.
Ideal for Traders Who:
- Want quick, clear, and concise market insights.
- Prefer a highly customizable tool to visualize multiple indicators and price trends.
- Need to monitor various markets efficiently from one location.
По описанию хороший , если его правильно настроить , на что я не стал дополнительно тратить время