VWAP Original MT5

4.67

If you love this indicator, please leave a positive rating and comment, it will be a source of motivation to help me create more products <3

Key Takeaways

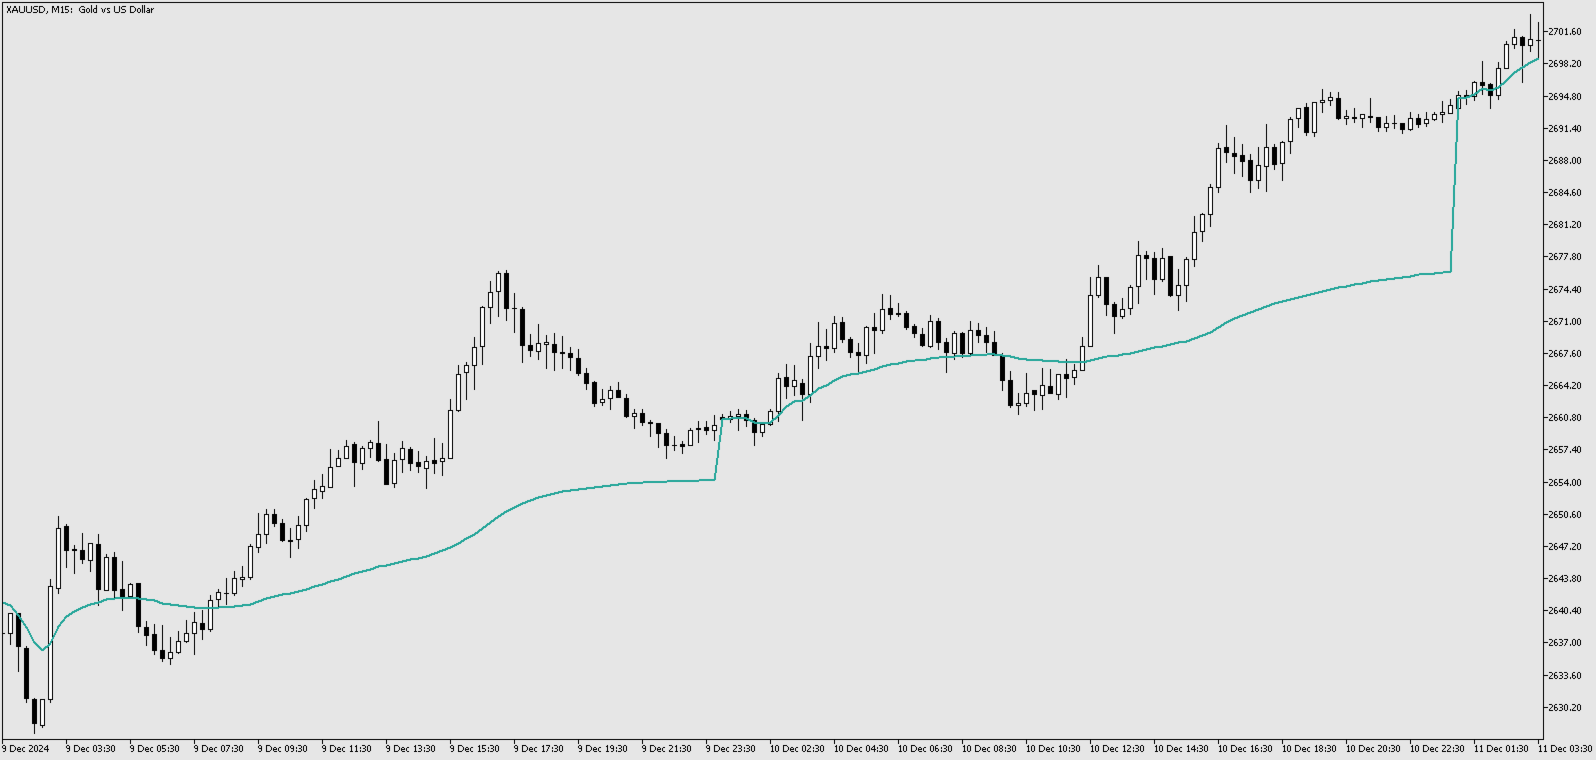
  • VWAP is a trading benchmark that typically is most useful to short-term traders.
  • VWAP is used in different ways by traders . Traders may use it as a trend confirmation tool and build trading rules around it.
  • Also, If prices below VWAP and move above it, can be used by traders as a sell signal. If prices above VWAP and move below it, can be used by traders as a sell signal

However, like all indicators, it isn't foolproof, to avoid false signals, it's best to use the VWAP indicator with other indicators. Technical indicators should always be used with others for confirmation.


Recensioni 3
Findolin
2090
Findolin 2025.01.21 13:24 
 

Very good and helpful. Thank you very much!

mpya12
14
mpya12 2025.10.13 06:50 
 

Very good to0l.Excellent work

Kedrov
1171
Kedrov 2025.05.15 12:10 
 

Просмотрел штук 40 VWAP в разных исполнениях. Но ни в одном не нашел коррекции по временной зоне по GMT – такое впечатление, что все брокеры работают в одной зоне. Странно!

Prodotti consigliati
Swiss VWAPsimple
Terence Gronowski
4.8 (5)
Swiss VWAPsimple Motivation Did not find free VWAP that works, the one that I found craseh. So I created a VWAP which calculates values only for the actual day. So computer resouces are not over stressed. What is VWAP, how is it used?  VWAP stands for Volume Weighed Average Price, it calculates the running sum of tick volume and the runnung sum of price times tickvolume. The division of these sums result in a weighed price (Sum P*V/Sum V). The calculation starts normally at midnight. The values
FREE
English VWAP Daily (Clean) is a simple and lightweight indicator that plots the classic Daily VWAP (Volume Weighted Average Price) directly on your MT5 chart. Features: Classic Daily VWAP calculation Supports real volume (if available) or tick volume Timezone offset option to match your broker’s server time Weekend merge option (merge Saturday/Sunday data into Friday) Clean version → no arrows, no alerts, only VWAP line VWAP is widely used by institutional traders to identify fair value, su
FREE
Raymond Cloudy Day
The Hung Ngo
5 (3)
Raymond Cloudy Day Indicator for MT5 – Pivot-Based Reversal and Trend Levels Raymond Cloudy Day Indicator is a pivot-based level indicator for MetaTrader 5 (MT5). It was developed by Ngo The Hung based on Raymond’s original idea and is designed to give a structured view of potential reversal zones, trend extensions and support/resistance levels directly on the chart. The default settings are optimised for XAUUSD on the H1 timeframe, but the indicator can be tested and adjusted for other symbols
FREE
An extended version of the indicator for visualizing the time ranges of key trading sessions: Asian, European and American. The main advantage of this indicator is the automatic construction of a price profile for a trading session. The indicator has the functionality to set the start and end time of each trading session, as well as automatically determine the time zone of the trading server. The indicators include the ability to work with minimal CPU usage and save RAM. In addition, the option
FREE
Time Box Indicator MT5
Young Ho Seo
4.67 (3)
Introduction To Time Box Indicator Time Box Indicator is a must have indicator for any trader. It will display daily, weekly and Monthly box according to your preferences. Yet, you can extend any important price levels in your chart automatically. You can use them as the significant support and resistance levels. It is very simple but effective tool for your trading. Graphic Setting Use White Chart Line Style for Current Open price Daily Setting Update Timeframe for daily box Number of days to
FREE
This indicator is stand alone version from  MP Pivot Levels  (All in one) containing Demark's Pivots. Calculations:     PP = X / 4     R1 = X / 2 - LOWprev     S1 = X / 2 - HIGHprev Uses: When the pair currency price may change the direction of movement. Possible constraints of support and resistance that creates plateaus for the currency pair prices. Tendency identification by comparing the present prices according to current day's pivot point and also the prior day's pivot points. ____________
FREE
Basic Vwap
james mugendi
4 (1)
Simple Vwap with the daily, weekly and monthly VWAP is the abbreviation for   volume-weighted average price , which is a technical analysis tool that shows the ratio of an asset's price to its total trade volume. It provides traders and investors with a measure of the average price at which a stock is traded over a given period of time. How it's used Identify entry and exit points:   Traders can use VWAP to determine when to buy or sell an asset.   Understand price trends :  Traders can use V
FREE
VWAP Diaria
Samuel De Souza Ferreira
Daily VWAP — Institutional Reference for Intraday Value The Daily VWAP is a professional indicator based on the Volume-Weighted Average Price (VWAP) , designed to reveal the true balance between price and volume throughout the trading session. Unlike traditional moving averages, the Daily VWAP incorporates the weight of traded volume in every price movement, providing a much more accurate reference to the behavior of institutional traders and large market participants. What the indicator deliver
FREE
This indicators automatically draws the   support and resistances   levels (key levels) for you once you've dropped it on a chart. It reduces the hustle of drawing and redrawing these levels every time you analyse prices on a chart. With it, all you have to do is drop it on a chart, adjust the settings to your liking and let the indicator do the rest. But wait, it gets better; the indicator is absolutely free! For more information:  https://youtu.be/rTxbPOBu3nY For more free stuff visit:  https:
FREE
PIVOT eXtreme
Syamsurizal Dimjati
Pivot eXtreme Pivot adalah level referensi penting yang digunakan trader untuk memetakan potensi support & resistance intraday maupun jangka lebih panjang. Dalam sistem ini, level pivot dikembangkan menjadi P (Pivot Point utama) , R1–R13 (Resistance) , serta S1–S13 (Support) . Pivot Point (P) Titik pusat utama, dihitung dari rata-rata harga (High + Low + Close) / 3 . Berfungsi sebagai acuan keseimbangan harga : Jika harga di atas P → tren cenderung bullish. Jika harga di bawah P → tren cenderung
FREE
Levels of Pivots
Nikolay Mitrofanov
The utility draws reversal levels using the formulas for each of the selected number of candles: Pivot = (high + close + low) / 3 R1 = ( 2 * Pivot) - low S1 = ( 2 * Pivot) - high R2 = Pivot + (R1 -S1) R3 = high + ( 2 * (Pivot - low)) S2 = Pivot - (R1 - S1) S3 = low - ( 2 * (high - Pivot)) H = high L = low U = if the candle is bullish, then close. Otherwise - open D = if the candle is bullish, then open. Otherwise - close On any timeframe. After a new candle closes on the calculated timeframe
FREE
This indicator is stand alone version from  MP Pivot Levels  (All in one) containing Woodie Pivots. Woodie’s pivot points are made up of multiple key levels, calculated from past price points, in order to frame trades in a simplistic manner. The key levels include the ‘pivot’ itself, and multiple support and resistance levels (usually up to three each). Traders use these levels as a guide for future price movements when setting up trades. The pivot : (Previous high + previous low + 2 x previous
FREE
Important Lines
Terence Gronowski
4.88 (24)
This indicator displays Pivot-Lines, preday high and low, preday close and the minimum and maximum of the previous hour. You just have to put this single indicator to the chart to have all these important lines, no need to setup many single indicators. Why certain lines are important Preday high and low : These are watched by traders who trade in a daily chart. Very often, if price climbs over or falls under a preday low/high there is an acceleration in buying/selling. It is a breakout out of a
FREE
Support and Ressistance
Raphael Lorenz Baumgartner
Last Day Support & Resistance Platform: MetaTrader 5 Type: Custom Indicator Display: Chart Window (Overlay) Functions: Calculates Support and Resistance zones based on high/low patterns of the previous day. Uses a sliding sampling window ( SampleWindowSize ) to detect recent price ranges. Detects potential support if current price range is significantly below previous highs. Detects potential resistance if price range is significantly above previous lows. Updates four output buffers: LDResistanc
FREE
The   Pivot Point indicator   automatically calculates and displays the pivot point line and support and resistance levels. Pivot can be calculated according to the Classic, Floor, Fibonacci, Woodie, Camarilla or DeMark formula. It is also possible to select the period for calculating the indicator. A trader can choose from daily, weekly, monthly, or user-defined periods. Types of pivots Classic Floor Fibonacci Woodie Camarilla DeMark Main features The indicator shows the current and historic
FREE
React Fibonacci Chart
Kim Yonghwa
4.75 (12)
Funzionalità Indicatore per il Trading di Ritrazione di Fibonacci Viene disegnato un grafico di Fibonacci basato sulla barra precedente selezionata tra 1H, 4H, 1D e 1W. Quando il prezzo di mercato tocca il livello di Fibonacci, il colore cambia e viene visualizzato l'orario del tocco. Il grafico di Fibonacci è disegnato ai livelli -23.6, 0, 23.6, 38.2, 50, 61.8, 76.4, 100 e 123.6, e il grafico si aggiorna quando la barra viene aggiornata. Variabili Intervallo di tempo: Un grafico di Fibonacc
FREE
B2U Market State System Part of the B2U Market State System A professional indicator suite designed to analyze market structure, trend state, and momentum. B2U Market State System 의 구성 요소입니다. 시장 구조, 추세 상태, 모멘텀을 입체적으로 분석하기 위한 전문 인디케이터 시스템입니다. Highlights structurally validated reaction zones after FVG inversion. The New Generation of Inversion Fair Value Gaps B2U IFVG BOX & Zone visually analyzes market reaction zones formed after Fair Value Gap (FVG) inversion. 차세대 Inversion Fair Value Gaps FVG 반
FREE
White Weis Volume Ticks
Ricardo Almeida Branco
5 (4)
White Weis Volume This indicator shows the sum of the volume in each wave, bulish or bearish, as idealized by David Weis , but it brings an important addition , which is the marking of the bar with the highest volume of the wave (White Bar)! In coding the indicator, it was sought to optimize the code to require minimal processing during use and not to overload mt5. The indicator can be used for pre-trading analysis and study, where the trader analyzes possible points of support and resistance
Time Candle with Sound Alert This indicator will be display the time left candle Features : 1. Multi Time Frames, Multi Pairs 2. Time Left 2. Position dynamic with Bid Price or Edge of Chart Screen 3. Font Size and Color 4. Display Current Spread, Maximum Spread and Minimum Spread Note: Maximum and Minimum Spread will be reset when you change TF Tested On MT5 Version 5 Build 5200 If you want the source code, just PM me
FREE
The Pivot Indicator is a vital tool for technical analysis used by traders in the financial markets. Designed to assist in identifying potential reversal points or trend changes, this indicator provides valuable insights into key levels in the market. Key features of the Pivot Indicator include: Automatic Calculations: The Pivot Indicator automatically calculates Pivot Point, Support, and Resistance levels based on the previous period's high, low, and close prices. This eliminates the complexity
FREE
Peak Trough Analysis is the great tool to detect peaks and troughs in your chart. Peak Trough Analysis tool can use three different peaks and troughs detection algorithm. The three algorithm include the orignal Fractals Indicator by Bill Williams, the Modified Fractals indicator and ZigZag indicator. You can use this peak and trough analysis tool to detect the price pattern made up from Equilibrium Fractal-Wave process. For further usage, there are good guide line on how to use this peak trough
FREE
Get ALERTS for break of your TRENDLINES, SUPPORT LINES, RESISTANCE LINE, ANY LINE!! 1. Draw a line on the chart (Trend, support, resistance, whatever you like) and give it a name (e.g. MY EURUSD line) 2. Load the Indicator and input the Line Name the same name in Indicator INPUT so system knows the name of your line (= MY EURUSD line) 3. Get Alerts when Price breaks the line and closes Works on All Time frames and charts LEAVE A COMMENT AND IF THERE IS ENOUGH INTEREST I WILL WRITE AN EA WHICH W
FREE
Pivot Points Classic – L’indicatore essenziale per ogni trader tecnico Questo indicatore disegna automaticamente i livelli di Pivot Point più utilizzati dai trader professionisti, con supporto completo a 4 metodi di calcolo:   Metodi supportati : • Traditional • Fibonacci • Woodie • Camarilla   Caratteristiche principali :  Calcolo su timeframe superiore (multi-timeframe)  Visualizzazione chiara dei livelli P, R1, R2, R3, S1, S2, S3   Etichette dinamiche con nome e valore del livello  Colori per
FREE
AliPivot Points is a Meta Trader 5 Indicator that draws you the latest pivot points. You can choose from timeframes ranging from 1 Minute to 1 Month. Calculation methods for pivot points includes: Classic Pivot Points Camarilla Pivot Points Fibonacci Pivot Points Woodie Pivot Points You can personalize the line colors, style, and width to suit your preference. The indicator displays values on the right side of the chart. AliPivot Points values can also be utilized by developers for creating Expe
FREE
SnR Engine
Muhammad Tamimul Huda
SnR Engine Basically, this is a Support and Resistance indicator like most others that use fractals to determine support and resistance levels. The difference is that this indicator determines whether a support or resistance level has been broken based on ATR. Levels that have been broken will become “dead levels” and will be shown with dashed lines. Levels that have many rejections and fail to be broken will have increasingly thicker lines. For effective use, you need to understand the charac
FREE
Camarilla Swing Trade Indicator is an Indicator. Support and resistance points are calculated from the High Low Close of the previous TF Week's price. What are Camarilla Pivot Points? 1.Camarilla Pivot Points is a modified version of the classic Pivot Point. 2.Camarilla Pivot Points was launched in 1989 by Nick Scott, a successful bond trader. 3.The basic idea behind Camarilla Pivot Points is that price tends to revert to its mean until it doesn't. 4.Camarilla Pivot Points is a mathematical pr
FREE
Support Resistance Channels - Trading Guide *** Group support:  https://www.mql5.com/en/channels/vuongphamtrading Overview The Support Resistance Channels indicator automatically identifies and displays the strongest support and resistance zones based on pivot points. Unlike simple horizontal lines, this indicator creates channels (zones) which better represent real market behavior where support and resistance act as areas rather than precise levels. Key Features Automatic Detection : Identifie
FREE
Pivot MT5
Dmitrij Isaenko
The indicator draws daily support and resistance lines on the chart, as well as the Pivot level (reversal level). Adapted to work in MT5 The standard timeframe for calculating support and resistance levels is D1. You can choose other timeframes according to your strategy (for example, for M1-M15, the optimal timeframe for calculations is H1) The function for calculating support and resistance levels has been updated; in this calculation option, fibonacci levels are taken into account, respec
FREE
The selective pin bar is designed to identify reversals. To use the selective pin bar effectively, traders typically look for Strong Rejection: The tail of the pin bar should extend significantly beyond the surrounding price action. It indicates that there was a sharp rejection of higher or lower prices during the trading period. A strong rejection suggests that the market sentiment may be changing.
FREE
Rilevatore di supporto e resistenza Phoenix (MT5) Strumento professionale per il rilevamento di supporto e resistenza per MetaTrader 5. Rileva automaticamente i livelli di S&R più forti da un intervallo di tempo superiore e visualizza un'analisi completa della forza attraverso un pannello di controllo visivo. Panoramica Il rilevatore di supporto e resistenza Phoenix identifica i tre livelli di supporto e resistenza più forti utilizzando l'analisi pivot su un intervallo di tempo superiore (H4
FREE
Gli utenti di questo prodotto hanno anche acquistato
SuperScalp Pro
Van Minh Nguyen
5 (10)
SuperScalp Pro – Sistema avanzato di indicatore per scalping con filtri multipli SuperScalp Pro è un sistema avanzato di indicatore per scalping che combina il classico Supertrend con molteplici filtri di conferma intelligenti. L’indicatore funziona in modo efficiente su tutti i timeframe da M1 a H4 ed è particolarmente adatto per XAUUSD, BTCUSD e le principali coppie Forex. Può essere utilizzato come sistema stand-alone o integrato in modo flessibile nelle strategie di trading esistenti. L’indi
Divergence Bomber
Ihor Otkydach
4.89 (83)
Ogni acquirente dell’indicatore riceverà inoltre gratuitamente: L’utilità esclusiva “Bomber Utility”, che gestisce automaticamente ogni operazione, imposta i livelli di Stop Loss e Take Profit e chiude le posizioni secondo le regole della strategia I file di configurazione (set file) per adattare l’indicatore a diversi asset I set file per configurare il Bomber Utility in tre modalità: “Rischio Minimo”, “Rischio Bilanciato” e “Strategia di Attesa” Una guida video passo-passo per installare, conf
Azimuth Pro
Ottaviano De Cicco
5 (4)
LAUNCH PROMO Azimuth Pro price is initially set at 299$ for the first 100 buyers. Final price will be 499$ . THE DIFFERENCE BETWEEN RETAIL AND INSTITUTIONAL ENTRIES ISN'T THE INDICATOR — IT'S THE LOCATION. Most traders enter at arbitrary price levels, chasing momentum or reacting to lagging signals. Institutions wait for price to reach structured levels where supply and demand actually shift. Azimuth Pro maps these levels automatically: swing-anchored VWAP, multi-timeframe structure lines, an
Entry In The Zone and SMC Multi Timeframe is a real-time market analysis tool developed based on Smart Money Concepts (SMC). It is designed to analyze market structure, price direction, reversal points, and key zones across multiple timeframes in a systematic way. The system displays Points of Interest (POI) and real-time No Repaint signals, with instant alerts when price reaches key zones or when signals occur within those zones. It functions as both an Indicator and a Signal System (2-in-1), c
ARICoins
Temirlan Kdyrkhan
ARICoin is a powerful trading companion designed to generate high-probability entry signals with dynamic TP/SL/DP levels based on volatility. Built-in performance tracking shows win/loss stats, PP1/PP2 hits, and success rates all updated live. Key Features: Buy/Sell signals with adaptive volatility bands Real-time TP/SL/DP levels based on ATR Built-in MA Filter with optional ATR/StdDev volatility Performance stats panel (Success, Profit/Loss, PP1/PP2) Alerts via popup, sound, push, or email Cust
Se acquisti questo indicatore, riceverai il mio Trade Manager Professionale + EA  GRATUITAMENTE. Innanzitutto è importante sottolineare che questo sistema di trading è un indicatore Non-Repainting, Non-Redrawing e Non-Lagging, il che lo rende ideale sia per il trading manuale che per quello automatico. Corso online, manuale e download di preset. Il "Sistema di Trading Smart Trend MT5" è una soluzione completa pensata sia per i trader principianti che per quelli esperti. Combina oltre 10 indicat
FX Trend MT5 NG
Daniel Stein
5 (4)
FX Trend NG: La Nuova Generazione di Intelligenza di Trend Multi-Mercato Panoramica FX Trend NG è uno strumento professionale di analisi del trend multi-timeframe e monitoraggio dei mercati. Ti consente di comprendere la struttura completa del mercato in pochi secondi. Invece di passare tra numerosi grafici, puoi identificare immediatamente quali strumenti sono in trend, dove il momentum sta diminuendo e dove esiste un forte allineamento tra i timeframe. Offerta di Lancio – Ottieni FX Trend NG
[ My Products ] , [ My Channel ]   ,  [ LIVE SIGNAL ] HFT Spike Detector HFT Spike Detector è uno strumento professionale di monitoraggio dei tick progettato per analizzare e misurare in tempo reale i movimenti di prezzo ad alta frequenza (picchi improvvisi causati da HFT). Il suo scopo è permetterti di rilevare slippage anomalo, gap di liquidità e picchi di prezzo a livello millisecondo causati dal broker, utilizzando dati numerici. Poiché analizza il flusso di tick in tempo reale e le cond
Power Candles MT5
Daniel Stein
5 (6)
Power Candles – Segnali di ingresso basati sulla forza per tutti i mercati Power Candles porta l’analisi di forza collaudata di Stein Investments direttamente sul grafico dei prezzi. Invece di reagire solo al prezzo, ogni candela viene colorata in base alla reale forza di mercato, consentendo di identificare immediatamente accumuli di momentum, accelerazioni della forza e transizioni di trend pulite. Un’unica logica per tutti i mercati Power Candles funziona automaticamente su tutti i simboli di
RFI levels PRO MT5
Roman Podpora
3.67 (3)
L'indicatore mostra accuratamente i punti di inversione e le zone di ritorno dei prezzi in cui il       Principali attori   . Vedi dove si formano le nuove tendenze e prendi decisioni con la massima precisione, mantenendo il controllo su ogni operazione. VERSION MT4     -    Rivela il suo massimo potenziale se combinato con l'indicatore   TREND LINES PRO Cosa mostra l'indicatore: Strutture di inversione e livelli di inversione con attivazione all'inizio di un nuovo trend. Visualizzazione dei li
Gold Entry Sniper
Tahir Mehmood
5 (6)
Gold Entry Sniper – Dashboard ATR Multi-Timeframe per Scalping e Swing Trading sull’Oro Gold Entry Sniper è un indicatore avanzato per MetaTrader 5 che offre segnali di acquisto/vendita precisi per XAUUSD e altri strumenti, basato sulla logica ATR Trailing Stop e l' analisi multi-timeframe . Caratteristiche e Vantaggi Analisi Multi-Timeframe – Visualizza trend su M1, M5, M15 in un'unica dashboard. Trailing Stop Basato su ATR – Stop dinamici che si adattano alla volatilità. Dashboard Professional
Trend Screener Pro MT5
STE S.S.COMPANY
4.84 (101)
Indicatore di tendenza, soluzione unica rivoluzionaria per il trading di tendenze e il filtraggio con tutte le importanti funzionalità di tendenza integrate in un unico strumento! È un indicatore multi-timeframe e multi-valuta al 100% non ridipingibile che può essere utilizzato su tutti i simboli/strumenti: forex, materie prime, criptovalute, indici e azioni. Trend Screener è un indicatore di tendenza che segue un indicatore efficiente che fornisce segnali di tendenza a freccia con punti nel gra
AriX
Temirlan Kdyrkhan
1 (4)
AriX Indicator for MT5 A powerful trend-following and signal-evaluation tool AriX is a custom MT5 indicator that combines Moving Averages and ATR-based risk/reward logic to generate clear buy/sell signals. It visualizes dynamic SL/TP levels, evaluates past trade outcomes, and displays win/loss statistics in a clean on-chart panel. Key features include: Buy/Sell signals based on MA crossovers ATR-based SL/TP1/TP2/TP3 levels with visual lines and labels Signal outcome tracking with real-time stat
Grabber System MT5
Ihor Otkydach
4.83 (23)
Ti presento un eccellente indicatore tecnico: Grabber, che funziona come una strategia di trading "tutto incluso", pronta all’uso. In un solo codice sono integrati strumenti potenti per l’analisi tecnica del mercato, segnali di trading (frecce), funzioni di allerta e notifiche push. Ogni acquirente di questo indicatore riceve anche gratuitamente: L’utility Grabber: per la gestione automatica degli ordini aperti Video tutorial passo dopo passo: per imparare a installare, configurare e utilizzare
Game Changer Indicator mt5
Vasiliy Strukov
4.48 (23)
Game Changer è un indicatore di tendenza rivoluzionario, progettato per essere utilizzato su qualsiasi strumento finanziario, per trasformare il tuo MetaTrader in un potente analizzatore di trend. Funziona su qualsiasi intervallo temporale e aiuta a identificare i trend, segnala potenziali inversioni, funge da meccanismo di trailing stop e fornisce avvisi in tempo reale per risposte tempestive del mercato. Che tu sia un professionista esperto o un principiante in cerca di un vantaggio, questo st
Atomic Analyst MT5
Issam Kassas
4.03 (30)
Innanzitutto, vale la pena sottolineare che questo indicatore di trading non è repaint, non è ridisegno e non presenta ritardi, il che lo rende ideale sia per il trading manuale che per quello automatico. Manuale utente: impostazioni, input e strategia. L'Analista Atomico è un indicatore di azione del prezzo PA che utilizza la forza e il momentum del prezzo per trovare un miglior vantaggio sul mercato. Dotato di filtri avanzati che aiutano a rimuovere rumori e segnali falsi, e aumentare il pote
OmniSync Projection
Antonio-alin Teculescu
5 (1)
Chronos Fractal Engine is an innovative price projection indicator for MetaTrader 5, designed to transform your technical analysis by intelligently identifying and projecting historical price patterns. Built upon an advanced correlation algorithm and the fractal principles of the market, this powerful tool visualizes potential future price movements, giving you a unique edge in your trading decisions. What is Chronos Fractal Engine? At its core, the Chronos Fractal Engine employs a sophisticat
FX Power MT5 NG
Daniel Stein
5 (31)
FX Power: Analizza la Forza delle Valute per Decisioni di Trading Più Intelligenti Panoramica FX Power è lo strumento essenziale per comprendere la reale forza delle principali valute e dell'oro in qualsiasi condizione di mercato. Identificando le valute forti da comprare e quelle deboli da vendere, FX Power semplifica le decisioni di trading e rivela opportunità ad alta probabilità. Che tu segua le tendenze o anticipi inversioni utilizzando valori estremi di Delta, questo strumento si adatta
Smart Stop Indicator – Precisione intelligente dello stop-loss direttamente sul grafico Panoramica Smart Stop Indicator è la soluzione ideale per i trader che desiderano posizionare il loro stop-loss in modo chiaro e metodico, senza dover indovinare o affidarsi all’intuizione. Questo strumento combina la logica classica del price action (massimi e minimi strutturali) con un moderno riconoscimento dei breakout per identificare il prossimo livello di stop realmente logico. In trend, in range o i
Trend Lines PRO MT5
Roman Podpora
5 (1)
LINEE DI TENDENZA PRO  Aiuta a capire dove il mercato sta realmente cambiando direzione. L'indicatore mostra reali inversioni di tendenza e punti in cui i principali operatori rientrano. Vedi   Linee BOS   Cambiamenti di tendenza e livelli chiave su timeframe più ampi, senza impostazioni complesse o rumore inutile. I segnali non vengono ridisegnati e rimangono sul grafico dopo la chiusura della barra. VERSIONE MT4   -   Svela il suo massimo potenziale se abbinato all'indicatore   RFI LEVELS PRO
Innanzitutto, vale la pena sottolineare che questo Strumento di Trading è un Indicatore Non-Ridipingente, Non-Ridisegnante e Non-Laggante, il che lo rende ideale per il trading professionale. Corso online, manuale utente e demo. L'Indicatore Smart Price Action Concepts è uno strumento molto potente sia per i nuovi che per i trader esperti. Racchiude più di 20 utili indicatori in uno solo, combinando idee di trading avanzate come l'Analisi del Trader del Circolo Interno e le Strategie di Tradin
ARIPoint
Temirlan Kdyrkhan
ARIPoint is a powerful trading companion designed to generate high-probability entry signals with dynamic TP/SL/DP levels based on volatility. Built-in performance tracking shows win/loss stats, PP1/PP2 hits, and success rates all updated live. Key Features: Buy/Sell signals with adaptive volatility bands Real-time TP/SL/DP levels based on ATR Built-in MA Filter with optional ATR/StdDev volatility Performance stats panel (Success, Profit/Loss, PP1/PP2) Alerts via popup, sound, push, or email Cu
Trend indicator AI mt5
Ramil Minniakhmetov
5 (15)
Trend Ai indicator è un ottimo strumento che migliorerà l'analisi di mercato di un trader combinando l'identificazione della tendenza con punti di ingresso utilizzabili e avvisi di inversione. Questo indicatore consente agli utenti di navigare nelle complessità del mercato forex con fiducia e precisione Oltre ai segnali primari, l'indicatore Ai di tendenza identifica i punti di ingresso secondari che si presentano durante i pullback o i ritracciamenti, consentendo ai trader di capitalizzare le
Crystal Heikin Ashi Signals
Muhammad Jawad Shabir
5 (1)
Crystal Heikin Ashi Signals - Professional Trend & Signal Detection Indicator Advanced Heikin Ashi Visualization with Intelligent Signal System for Manual & Automated Trading Final Price: $149 ---------> Price goes up $10 after every 10 sales . Limited slots available — act fast . Overview Crystal Heikin Ashi Signals is a professional-grade MetaTrader 5 indicator that combines pure Heikin Ashi candle visualization with an advanced momentum-shift detection system. Designed for both manual traders
RelicusRoad Pro: Sistema Operativo Quantitativo di Mercato 70% DI SCONTO ACCESSO A VITA (TEMPO LIMITATO) - UNISCITI A 2.000+ TRADER Perché la maggior parte dei trader fallisce anche con indicatori "perfetti"? Perché operano su Singoli Concetti isolati. Un segnale senza contesto è una scommessa. Per vincere serve CONFLUENZA . RelicusRoad Pro non è un semplice indicatore. È un Ecosistema Quantitativo completo . Mappa la "Fair Value Road", distinguendo tra rumore e rotture strutturali. Smetti di in
FX Levels MT5
Daniel Stein
5 (13)
FX Levels: Supporti e Resistenze di Precisione Eccezionale per Tutti i Mercati Panoramica Rapida Cercate un modo affidabile per individuare livelli di supporto e resistenza in ogni mercato—coppie di valute, indici, azioni o materie prime? FX Levels fonde il metodo tradizionale “Lighthouse” con un approccio dinamico all’avanguardia, offrendo una precisione quasi universale. Basato sulla nostra esperienza reale con i broker e su aggiornamenti automatici giornalieri più quelli in tempo reale, FX
Quantum TrendPulse
Bogdan Ion Puscasu
5 (22)
Ecco   Quantum TrendPulse   , lo strumento di trading definitivo che combina la potenza di   SuperTrend   ,   RSI   e   Stocastico   in un unico indicatore completo per massimizzare il tuo potenziale di trading. Progettato per i trader che cercano precisione ed efficienza, questo indicatore ti aiuta a identificare con sicurezza le tendenze di mercato, i cambiamenti di momentum e i punti di entrata e uscita ottimali. Caratteristiche principali: Integrazione SuperTrend:   segui facilmente l'andame
Pips Stalker mt5
Abdulkarim Karazon
5 (1)
Il Pips Stalker è un indicatore a freccia lunga e corta, aiuta i trader di tutti i livelli a prendere decisioni migliori nel trading sul mercato, l'indicatore non viene mai ridipinto e usa l'RSI come logica principale del segnale; una volta applicata una freccia, non verrà mai ridipinta o ridipinga e le frecce non vengono ritardate. VERSIONE MT4 &lt;---- CARATTERISTICHE DELLA FRECCIA PIPS STALKER : PANNELLO STATISTICHE un dashboard informativo unico che mostra la percentuale complessiva di
Gold Sniper Scalper Pro
Ich Khiem Nguyen
3.78 (9)
Gold Sniper Scalper Pro è un indicatore per MetaTrader 5 costruito specificamente per rilevare pattern di falsa rottura (false breakout) su XAUUSD. Identifica la struttura trappola a 4 barre dove il prezzo supera il confine di un range, attira i trader di rottura e poi inverte — confermando che il movimento era una falsa rottura. L'indicatore valuta ogni setup secondo 17 fattori di qualità, lo elabora attraverso un pipeline di confluenza a 4 livelli, lo verifica contro un motore di consenso di
Candle Smart Range
Gianny Alexander Lugo Sanchez
5 (1)
Candle Smart Range (CSR) per MetaTrader 5 Candle Smart Range è un indicatore tecnico progettato per l'identificazione automatica dei range di prezzo su più timeframe. Questo strumento analizza la struttura del mercato basandosi sulle formazioni delle candele e sull'interazione del prezzo con i massimi e i minimi precedenti. Caratteristiche principali: Rilevamento Range: Identifica le zone di consolidamento prima dei movimenti impulsivi. Identificazione Falsi Breakout: Segnala quando il prezzo su
Altri dall’autore
ZigZag Advanced MT5
Do Kim Dang Khoi
5 (1)
If you love this indicator, please leave a positive rating and comment, it will be a source of motivation to help me create more products <3 Key Takeaways The Zig Zag  Advanced   indicator plot points on a chart whenever prices reverse by the percentage the trader sets in the input section. The Zig Zag Advanced indicator lowers the impact of random price fluctuations and is used to identify trends and changes in trends. The indicator lowers noise levels, highlighting trends higher and lower. Th
FREE
Range Breakout Alert MT5
Do Kim Dang Khoi
5 (1)
If you love this indicator, please leave a positive rating and comment, it will be a source of motivation to help me create more products <3 Key Takeaways Automatically draws Range High and Range Low boundaries for a chosen time period. Alerts when price breaks above or below the defined range. Support sending notifications via alert, email, notification when breakout occurs. Can be used as a trade signal in breakout-based strategies. However, like all indicators, it isn't foolproof,  to avoid
FREE
If you love this indicator, please leave a positive rating and comment, it will be a source of motivation to help me create more products <3 How to use Gann High-Low Activator? The Gann HiLo Activator helps the trader identify the current trend of the market. When the indicator is below the closing price, it can indicate that an uptrend is taking place. Conversely, when the indicator is above the closing price, it can indicate a downtrend. The Gann HiLo Activator also generates buy and sell sig
FREE
Laguerre RSI MT5
Do Kim Dang Khoi
5 (2)
If you love this indicator, please leave a positive rating and comment, it will be a source of motivation to help me create more products <3 Key Takeaways The Laguerre RSI is an enhanced version of the traditional Relative Strength Index (RSI) that incorporates Laguerre filters to smooth the price data. This helps reduce the noise and volatility that are often seen in the standard RSI, providing a cleaner and more reliable indicator for spotting trends, reversals, and overbought or oversold con
FREE
If you love this indicator, please leave a positive rating and comment, it will be a source of motivation to help me create more products <3 Key Takeaways Provides both trend and momentum signals in a single view. Entry and exit signals are based on the crossover of the RSI and Signal Line. Market Base Line offers insight into the overall trend direction. Volatility Bands help identify overbought and oversold market conditions.
FREE
If you love this indicator, please leave a positive rating and comment, it will be a source of motivation to help me create more products <3 What is  Schaff Trend Cycle indicator? The Schaff Trend Cycle (STC) is a technical analysis indicator used in trading and investing to identify trends and generate trading signals. The STC is designed to identify trends and trend reversals by measuring the strength of the trend and the speed of price changes. The STC indicator helps to identify trends in a
FREE
SuperTrend Original MT5
Do Kim Dang Khoi
5 (2)
If you love this indicator, please leave a positive rating and comment, it will be a source of motivation to help me create more products <3 How to use SuperTrend? When the price crosses above the supertrend line it signals a buy signal and when the price crosses below the supertrend line it signals a sell signal. The supertrend indicator which acts as a dynamic level of support or resistance and helps traders make informed decisions about entry and exit points.  When prices are above s upertre
FREE
QQE Indicator MT5
Do Kim Dang Khoi
5 (1)
If you love this indicator, please leave a positive rating and comment, it will be a source of motivation to help me create more products <3 How to use QQE? Determine trend when RSI MA ​​above 50 indicate a bullish market, while RSI MA ​​below 50 indicate a bearish market and   can server as a trend filter. Identify short-term up/down momentum, when the RSI MA crosses up Smoothed signals bullish momentum, and when the RSI MA crosses down Smoothed signals bearish momentum. It is also possible to
FREE
StochRSI MT5
Do Kim Dang Khoi
If you love this indicator, please leave a positive rating and comment, it will be a source of motivation to help me create more products <3 Key Takeaways StochRSI is an oscillator that measures the RSI level relative to its high-low range over a period of time. It is more sensitive than the traditional RSI and can highlight overbought or oversold conditions in the market. StochRSI is typically used to generate more frequent and timely trading signals compared with the traditional RSI. StochRSI
FREE
Slope Direction Line MT5
Do Kim Dang Khoi
5 (2)
If you love this indicator, please leave a positive rating and comment, it will be a source of motivation to help me create more products <3 How to use  Slope Direction Line Uptrend: When the SDL line slopes up and turns from red to green, it shows that the price is trending up. This is also considered a buy signal. Downtrend: When the SDL line slopes down and turns from green to red, it shows that the price is trending down. This is also considered a sell signal. Sideways: When the SDL line mo
FREE
Aroon Indicator MT5
Do Kim Dang Khoi
4 (1)
If you love this indicator, please leave a positive rating and comment, it will be a source of motivation to help me create more products <3 How to use Aroon Indicator? The AroonUp and the AroonDown measure the strength of the uptrend and the strength of the downtrend, respectively. These lines fluctuate between zero and 100. Values close to 100 indicate a strong trend and values near zero indicate a weak trend where the lower the AroonUp, the weaker the uptrend and the stronger the downtrend,
FREE
If you love this indicator, please leave a positive rating and comment, it will be a source of motivation to help me create more products <3 Key Takeaways Generates buy and sell signals earlier than regular MA This indicator can detect a trend when it is just starting Filter :  A special parameter that is useful for filtering out spikes without causing lag. However, like all indicators, it isn't foolproof,  to avoid false signals, it's best to use the   Dots  indicator with other indicators. Te
FREE
If you love this indicator, please leave a positive rating and comment, it will be a source of motivation to help me create more products <3 Key Takeaways Fisher is a repaint indicator. It recalculates previous bars when new bars become available. Modified to avoid repainting to accommodate some merchants. Fisher indicator is quite a simple histogram indicator that detects the trend's direction and strength and signals about trend changes. Traders look for extreme readings to signal potential p
FREE
Key Takeaways This timer does not lag like other timer indicators Show the time end of candlesticks and spread Hide or Show Spread depending on user needs Works on all timeframes Adjust Text Size Adjust Text Color Adjust Text Font  If you love this indicator, please leave a positive rating and comment, it will be a source of motivation to help me create more products <3
FREE
If you love this indicator, please leave a positive rating and comment, it will be a source of motivation to help me create more products <3 Key Takeaways Bulls Bears Eyes is another version of Laguerre RSI. Use Bull/Bear Power to calculate. One use of the  Bulls Bears Eyes is to identify trends. This is done by looking for sustained periods when the indicator is above or below the 0.5 line. Also, a buy signal is generated when the   Bulls Bears Eyes line crosses above the 0.15 level, while a s
FREE
Fuzzy Oscillator is developed for personal use in future EA projects, so Fuzzy Oscillator is not too special, but it will help make trading easier when you can use Fuzzy Oscillator to identify trends and entry and exit points. Why Choose Fuzzy Oscillator: Fuzzy Oscillator is not repaints. There are many ways to use it like trading pullback, reversals and many more. Can help traders identify potential trend reversals, momentum shifts. Catch the long wave when a new trend starts. Suitable for all
Filtro:
mpya12
14
mpya12 2025.10.13 06:50 
 

Very good to0l.Excellent work

Kedrov
1171
Kedrov 2025.05.15 12:10 
 

Просмотрел штук 40 VWAP в разных исполнениях. Но ни в одном не нашел коррекции по временной зоне по GMT – такое впечатление, что все брокеры работают в одной зоне. Странно!

Do Kim Dang Khoi
11181
Risposta dello sviluppatore Do Kim Dang Khoi 2025.05.15 12:48
Most brokers always use GMT+2 and will change to GMT+3 when DST is applied. Some brokers that do not use DST will keep GMT+3. So changing GMT when using VWAP indicator is not necessary.
Findolin
2090
Findolin 2025.01.21 13:24 
 

Very good and helpful. Thank you very much!

Rispondi alla recensione