RSITrendLine

RSI Trend Lines Indicator - Identify Optimal Buying and Selling Opportunities

Introduction:
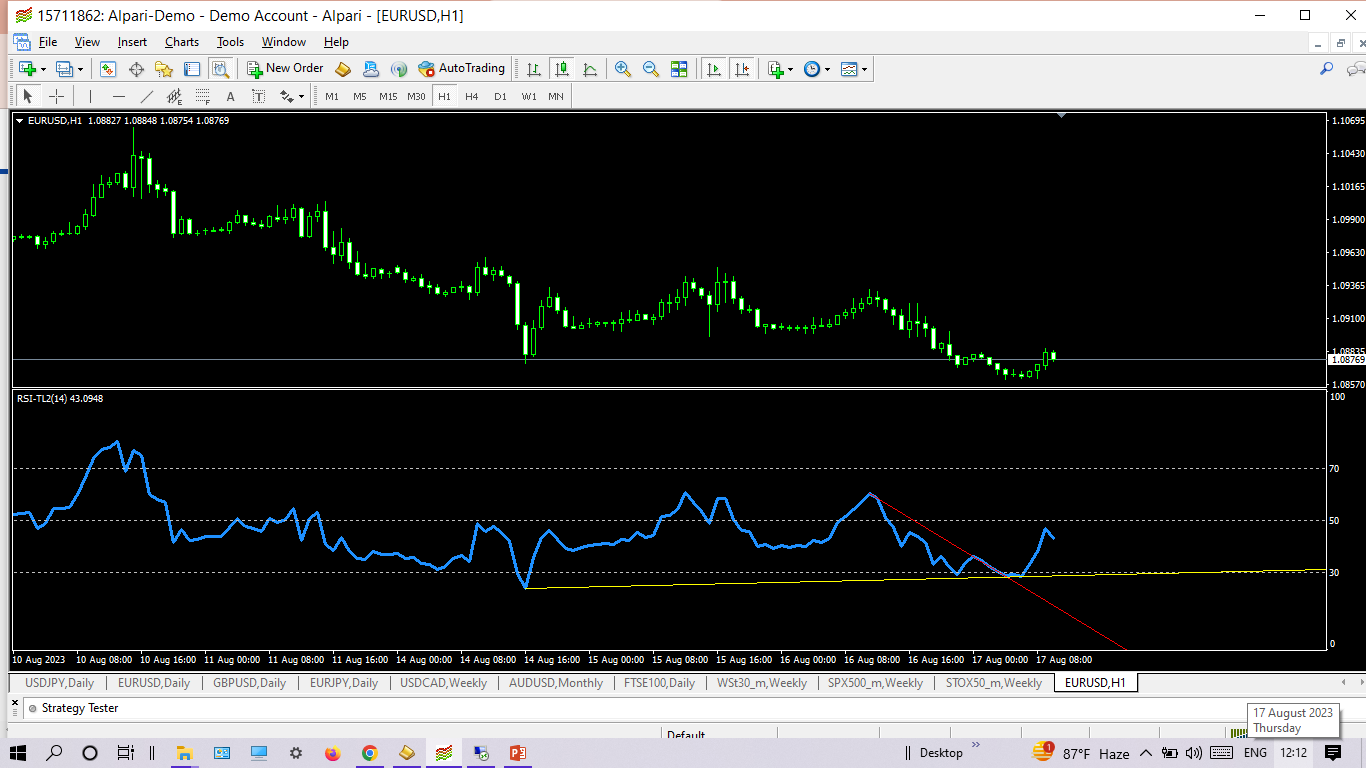
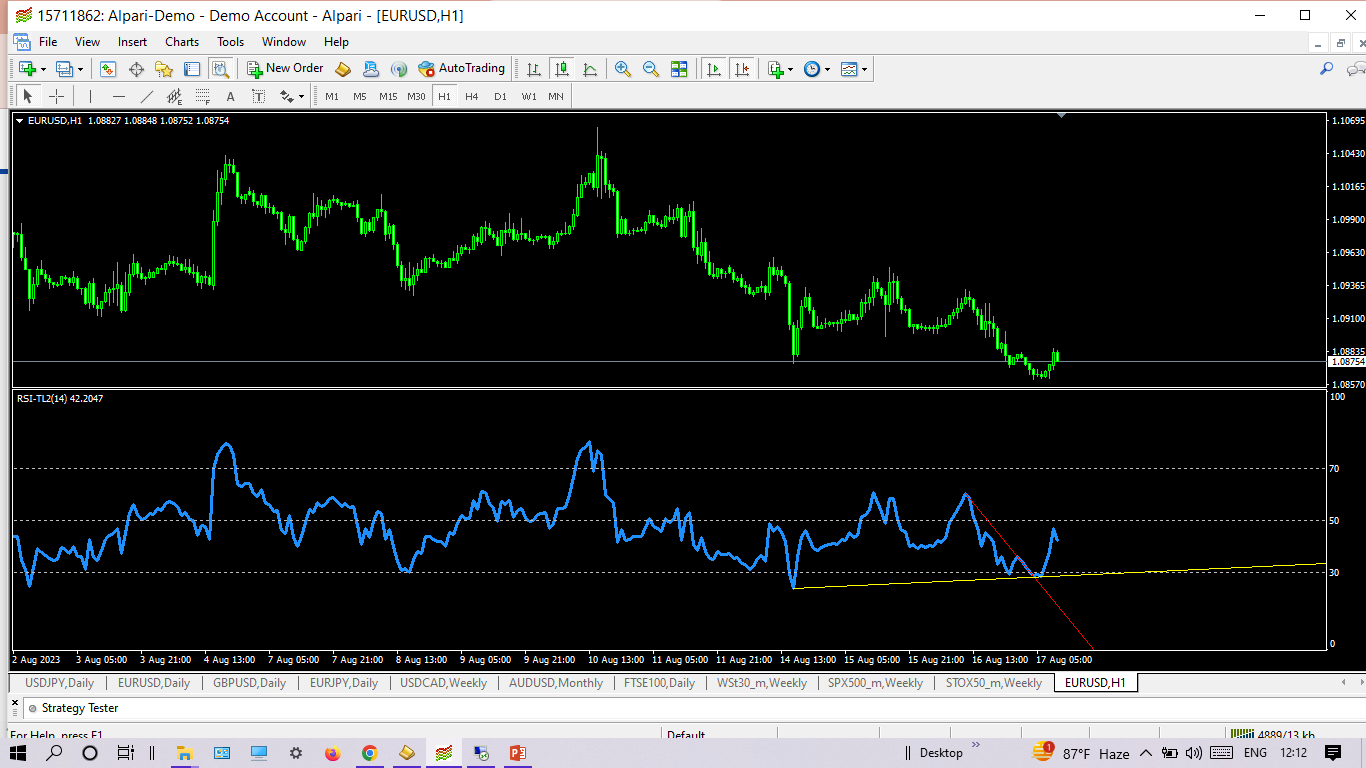
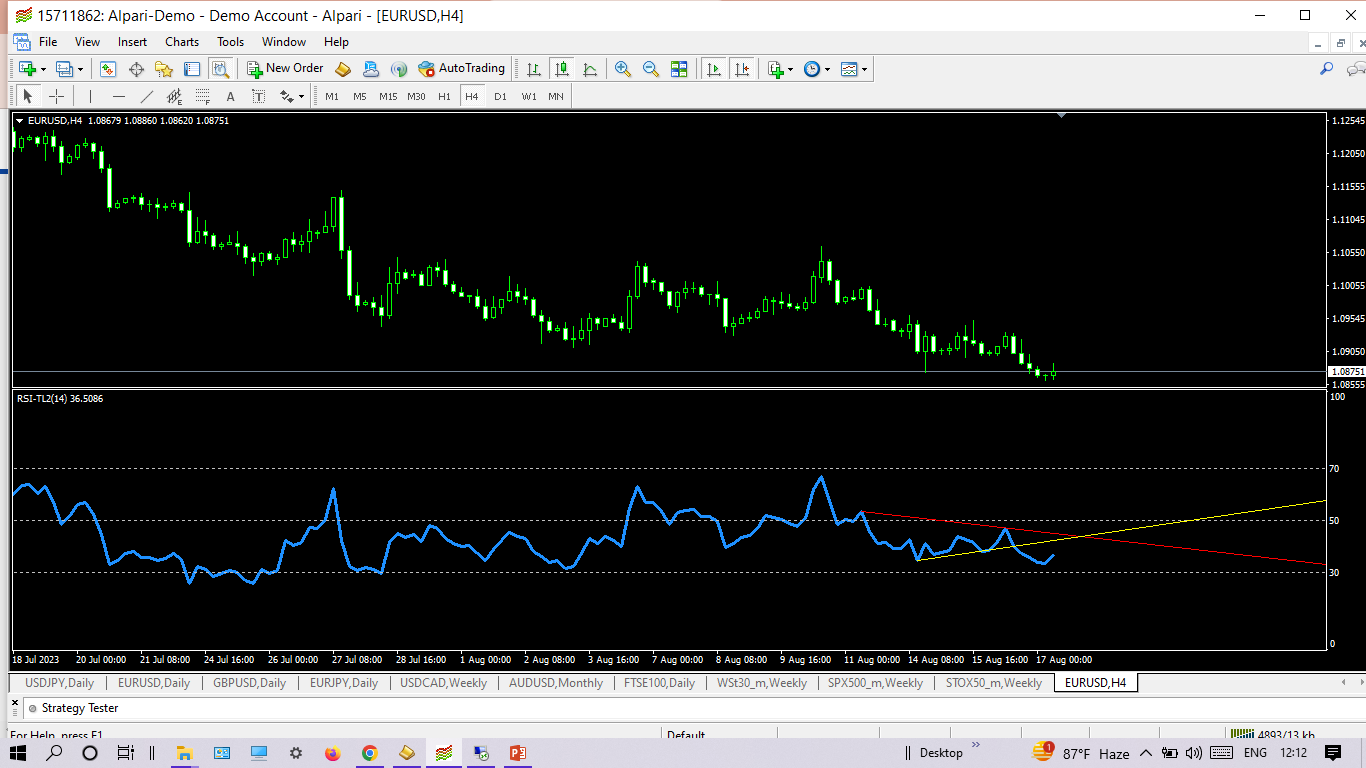
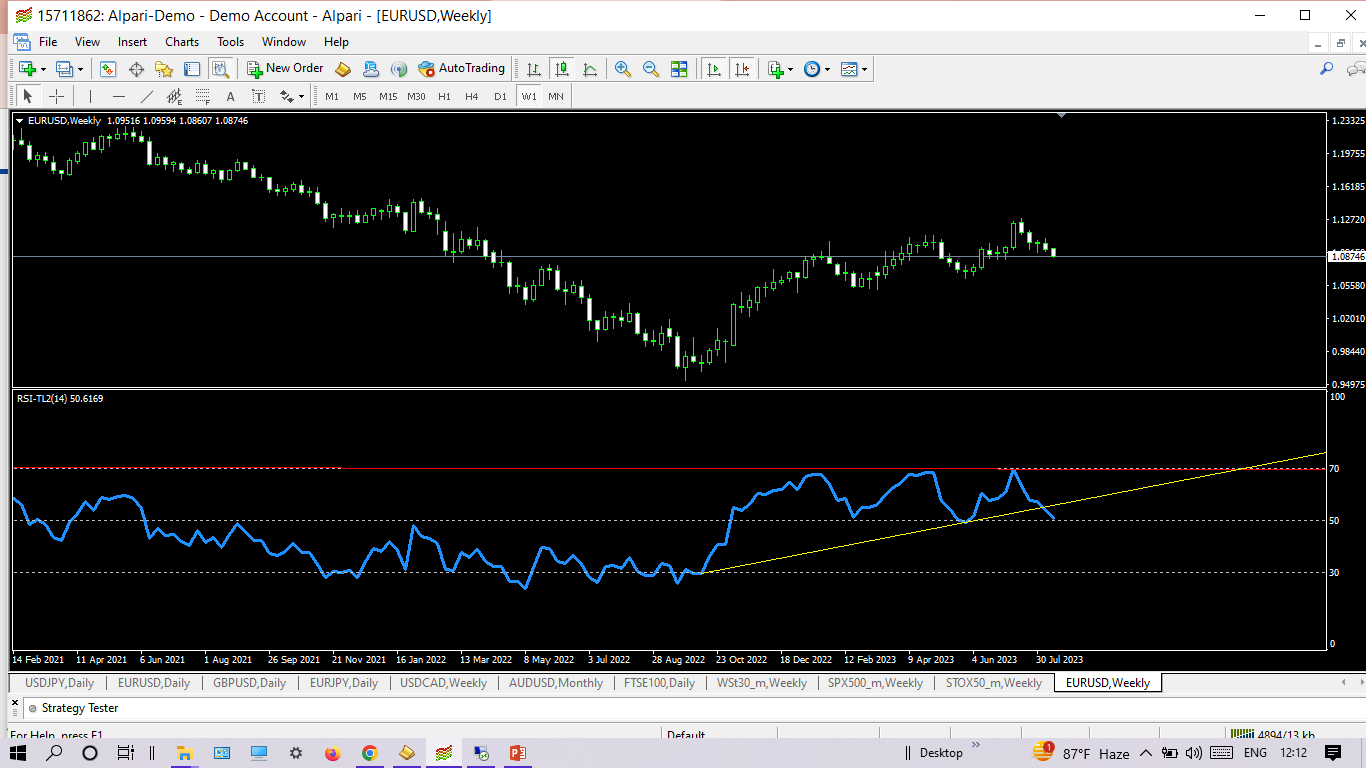
The RSI Trend Lines Indicator is a powerful tool designed to assist traders in identifying optimal buying and selling opportunities based on the Relative Strength Index (RSI) oscillator. This advanced indicator draws trend lines on the RSI chart using multiple points, providing valuable insights into potential market trends and reversals. By leveraging the RSI Trend Lines Indicator, traders can enhance their decision-making process and potentially improve their trading outcomes.

Key Features:

  1. Trend Line Drawing: The RSI Trend Lines Indicator offers the ability to draw trend lines directly on the RSI oscillator chart, enabling traders to visualize the RSI's movements with greater clarity. These trend lines are automatically generated by the indicator based on user-defined parameters, making it easier to identify key support and resistance levels.

  2. Multiple Point Drawing: Unlike traditional trend lines that are drawn using only two points, this indicator allows traders to draw trend lines using multiple points on the RSI chart. This feature provides a more accurate representation of trend strength and stability, enabling traders to make more informed trading decisions.

  3. Buying and Selling Situations: By analyzing the drawn trend lines, the RSI Trend Lines Indicator identifies potential buying and selling situations. It highlights critical levels where the RSI is likely to reverse, signaling optimal entry or exit points for trades. Traders can take advantage of these situations to capture potential profits and minimize risks.

  4. Customizable Parameters: The indicator offers a range of customizable parameters to adapt to individual trading preferences. Traders can adjust the sensitivity of the trend line detection, modify the number of points required to draw a trend line, and set alert notifications for specific conditions. This flexibility ensures that the indicator aligns with various trading strategies and styles.

  5. User-Friendly Interface: The RSI Trend Lines Indicator features a user-friendly interface, making it accessible to both novice and experienced traders. The intuitive design allows for easy installation, customization, and interpretation of the trend lines. Additionally, comprehensive documentation and customer support are available to assist users with any queries or concerns.

How to Use:

  1. Install the indicator on your preferred trading platform (MetaTrader 4).

  2. Apply the RSI Trend Lines Indicator to the desired chart, selecting the appropriate settings.

  3. Observe the drawn trend lines on the RSI chart, which represent potential support and resistance levels.

  4. Analyze the buying and selling situations indicated by the trend lines to make informed trading decisions.

  5. Consider additional technical and fundamental analysis in conjunction with the RSI Trend Lines Indicator for comprehensive market evaluation.


Conclusion:

The RSI Trend Lines Indicator is a robust technical analysis tool that empowers traders to identify optimal buying and selling opportunities based on the RSI oscillator's trend lines. By leveraging its advanced features and customizable parameters, traders can gain valuable insights into market trends and reversals, enhancing their trading strategies and potentially improving their overall profitability. Add the RSI Trend Lines Indicator to your trading toolbox today and unlock new possibilities in your trading journey.

Disclaimer: The RSI Trend Lines Indicator is offered for informational purposes only and does not guarantee profitable trading outcomes. Users should exercise caution and perform thorough analysis before making any trading decisions.


Prodotti consigliati
Binary Options Support Resistance Indicator This indicator is designed for binary options trading and effectively shows retracements from support and resistance levels. Signals appear on the current candle. A red arrow pointing downwards indicates a potential selling opportunity, while a blue arrow pointing upwards suggests buying opportunities. All that needs adjustment is the color of the signal arrows. It is recommended to use it on the M1-M5 timeframes as signals are frequent on these timef
Alpha Trend sign has been a very popular trading tool in our company for a long time. It can verify our trading system and clearly indicate trading signals, and the signals will not drift. Main functions: Based on the market display of active areas, indicators can be used to intuitively determine whether the current market trend belongs to a trend market or a volatile market. And enter the market according to the indicator arrows, with green arrows indicating buy and red arrows indicating se
PABT Pattern Indicator - it's classical system one of the signal patterns. Indicator logic - the Hi & Lo of the bar is fully within the range of the preceding bar, look to trade them as pullback in trend. In the way if indicator found PABT pattern it's drawing two lines and arrow what showing trend way.  - First line - it's entry point and drawing at: 1. On the high of signal bar or on middle of the signal bar (depending from indicator mode) for buy; 2. On the low of signal bar or on middle of t
FiboZag
Andriy Sydoruk
Indicator FiboZag - transfer the indicator to the chart and the Fibonacci levels will be built automatically on the last ZigZag turn. The main advantage lies in the correct construction of Fibonacci levels and markup of price levels. Simple, visual and effective use. The indicator is not redrawn and does not lag. Works on all currency pairs and on all timeframes.
Power Renko MT4
Pierce Vallieres
Power Renko is an indicator which plots Renko bricks underneath the chart using a histogram. You can select the brick size and the timeframe of the Renko bricks as well as whether or not to use the close price or the high/low price of the candles. Renko bricks are based on price alone, not time, therefor the Renko bricks will not be aligned with the chart's time. They are extremely useful for trend trading and many different strategies can be formed from them. Buffers are provided allowing you t
Interactive BB Matrix
Tsvetan Tsvetanov
2 (1)
This indicator displays Bollinger Bands signals for multiple symbols and multiple time frames. The signals are created as a simple ratios which represent the distance between the current price and the moving average measured in standard deviations. This way we create a very versatile and easy to use indicator which helps us to identify not only the strongest trends but also the most overbought and oversold conditions. Features Accurate signals in real time for multiple time frames and multiple
The arrow indicator without redrawing shows potential entry points into the market in the form of arrows of the appropriate color: the up arrows (usually green) suggest opening a purchase, the red down arrows suggest selling. The appearance of arrows may be accompanied by beeps. It is usually assumed to enter at the next bar after the pointer, but there may be non-standard recommendations. Arrow indicators visually "unload" the price chart and save time for analysis: no signal – no deal, if ther
BoS CHoCH FVG
Usiola Oluwadamilol Olagundoye
4.67 (3)
Next Arrival : Flip or Die Trading Arena. Flip a trading account:  https://flipordie.com/chapter-1-thirteen-doublings-double-a-trading-account/ The Break of Structure (BoS) and Change of Character indicator with Fair Value Gap (FVG) filter is a specialized tool designed to enhance trading strategies by pinpointing high-probability trading opportunities on price charts. By integrating the BoS and Change of Character concepts with the FVG formation, this indicator provides traders with a robust f
FREE
Bos CHoCH 4
Usiola Oluwadamilol Olagundoye
Next Arrival : Flip or Die Trading Arena. Flip a trading account:  https://flipordie.com/chapter-1-thirteen-doublings-double-a-trading-account/ The Break of Structure (BoS) and Change of Character indicator is a powerful tool designed to identify significant turning points in price movements on financial charts within the MetaTrader 4 platform. By analyzing price action, this indicator highlights instances where the market shifts from a trend to a potential reversal or consolidation phase. Util
FREE
Infinity Trend Pro
Yaroslav Varankin
1 (1)
This is a trend indicator without redrawing Developed instead of the binary options strategy (by the color of the Martingale candlestick) Also works well in forex trading When to open trades (binary options) A signal will appear in the place with a candle signaling the current candle It is recommended to open a deal for one candle of the current timeframe M1 and M5 When a blue dot appears, open a deal up When a red dot appears, open a trade down. How to open trades on Forex. When a signal is rec
[ZhiBiCCI] indicators are suitable for all cycle use, and are also suitable for all market varieties. [ZhiBiCCI] Green solid line is a reversal of bullish divergence. The green dotted line is a classic bullish divergence. [ZhiBiCCI] The solid line to the red is a reverse bearish divergence. The red dotted line is a classical bearish divergence. [ZhiBiCCI] can be set in the parameters (Alert, Send mail, Send notification), set to (true) to send instant signals to the alarm window, email, insta
Auto Fibo Pro m
DMITRII GRIDASOV
Indicatore "Auto FIBO Pro" Crypto_Forex: è un ottimo strumento ausiliario nel trading! - L'indicatore calcola e posiziona automaticamente sul grafico i livelli di Fibo e le linee di tendenza locali (colore rosso). - I livelli di Fibonacci indicano le aree chiave in cui il prezzo può invertirsi. - I livelli più importanti sono 23,6%, 38,2%, 50% e 61,8%. - Puoi usarlo per lo scalping di inversione o per il trading di zone grid. - Ci sono molte opportunità per migliorare il tuo sistema attuale us
Description The base of this indicator is an ZigZag algorithm based on ATR and Fibo retracement. The ZigZag can be drawn like a classic ZigZag or like Arrows or needn't be drawn at all. This indicator is not redrawing in sense that the ZigZag's last shoulder is formed right after the appropriate conditions occur on the market. The shoulder doesn't change its direction afterwards (can only continue). There are some other possibilities to show advanced information in this indicator: Auto Fibo on
"Dynamic Scalping Oscillator" - è un indicatore Crypto_Forex personalizzato avanzato - uno strumento di trading efficiente per MT4! - Nuova generazione di oscillatori - guarda le immagini per vedere come usarlo. - L'oscillatore Dynamic Scalping ha zone di ipervenduto/ipercomprato adattive. - L'oscillatore è uno strumento ausiliario per trovare punti di ingresso esatti dalle aree dinamiche di ipervenduto/ipercomprato. - Valori di ipervenduto: sotto la linea verde, valori di ipercomprato: sopra
This is a unique multi-currency trading strategy developed for trading on H1 timeframe, which allows you to determine the global market entry points and obtain the maximum profit for each transaction. The market entry point is calculated using a variety of author equations and algorithms. We recommend using the indicator simultaneously on several trading instruments . A huge advantage of Big Deals System is an information panel in which the user can see the current information on potential entry
Super Reversal Pattern
Parfait Mujinga Ndalika
Super Reversal Pattern Indicator Unlock the power of advanced pattern recognition with our Super Reversal Pattern Indicator. Designed for traders seeking precision and reliability, this indicator identifies one of the most effective reversal patterns in technical analysis, offering a significant edge in your trading strategy. Key Features: Non-Repainting Accuracy: Enjoy the confidence of non-repainting technology. Once a Super Reversal Pattern is detected, it remains static, providing consiste
This indicator watch the Fibonacci retracement for levels and timeframes selected by the trader. In the workload of day trading, having your eyes on all the timeframes to validate some information, for Fibonacci traders, is really time consuming and requires constant focus.  With this in mind, this tool allows you to have your attention on other trading details while this one monitors the retracements of each timeframe in real time. In the charts, this indicator data (retracement %, age of the r
FX Flow
Eva Stella Conti
FX Flow   indicator can be used as an anticipator of the next trend, preferably confirmed by Price Action or another oscillator (RSi, Stochastic ..). It takes the money flows of the major currencies USD EUR GBP AUD NZD CAD CHF JPY into account, and processes them. Excellent tool for indices, but also for correlations between currencies. Works on each timeframes.  Blue line: Bull market Yellow line: Bear market Note : if the indicator opens the window, but does not draw lines, load the historie
Forex Gump
Andrey Kozak
2.4 (5)
Forex Gump is a fully finished semi-automatic trading system. In the form of arrows, signals are displayed on the screen for opening and closing deals. All you need is to follow the instructions of the indicator. When the indicator shows a blue arrow, you need to open a buy order. When the indicator shows a red arrow, you need to open a sell order. Close orders when the indicator draws a yellow cross. In order to get the most effective result, we recommend using the timeframes H1, H4, D1. There
EZZ Zig Zag MT4
Paulo Rocha
5 (1)
EZZ Elite Zig Zag is an indicator for the MetaTrader 4 terminal. This indicator traces the peak of the trend based on the market reversal, thus showing various opportunities in the financial market. EZZ Elite Zig Zag is a visual tool, intuitive, and easy to understand and use.  Test it Yourself by Downloading it for Free. Author Paulo Rocha all rights reserved
Lyne
Maksim Kalachev
About the Lyne indicator Lyne is a Metatrader 4 (MT4) indicator, the essence of which is to transform the accumulated historical data. The Lyne indicator makes it possible to detect various features and patterns in price dynamics that are invisible to the naked eye. Based on this information, traders can anticipate further price movement and adjust their strategy accordingly. This indicator has proven itself in the scalping strategy. The indicator works without repainting.
Scalping Modulator
Andrey Kozak
5 (1)
Scalping Modulator is a scalping trading system. The indicator consists of several analytical modules. It automatically analyzes the market and shows the trader all the necessary information for trading. Scalping Modulator draws two trend lines on the chart. One line shows the long-term direction of the price, the second line shows the medium-term direction of the price. The indicator also draws red and blue dots on the chart. They indicate a likely change in price movement. In order to open a
System Trend Pro
Aleksandr Makarov
5 (2)
System Trend Pro - This is the best trend trading indicator!!! The indicator no repaint!!!  The indicator has   MTF   mode, which adds confidence to trading on the trend (   no repaint   ). How to trade? Everything is very simple, we wait for the first signal (big arrow), then wait for the second signal (small arrow) and enter the market in the direction of the arrow. (See screens 1 and 2.) Exit on the opposite signal or take 20-30 pips, close half of it, and keep the rest until the opposite
Price Magnet — Price Density and Attraction Levels Indicator Price Magnet is a professional analytical tool designed to identify key support and resistance levels based on statistical Price Density. The indicator analyzes a specified historical period and detects price levels where the market spent the most time. These zones act as “magnets,” attracting price action or forming a structural base for potential reversals. Unlike traditional Volume Profile tools, Price Magnet focuses on price-time d
Dynamic Levels
Svyatoslav Kucher
Dynamic Levels is a channel indicator of dynamic levels, designed for identification of the price extremums. It allows increasing the efficiency of any strategy due to advanced parameters, which in turn allow customizing it for personal trading style. Dynamic Levels does not change its values, it is suitable for any timeframe and currency pair. Indicator Parameters ChannelPeriod - period for the indicator calculation. ChannelSmoot - smoothing of values. ATRPeriod - volatility calculation period
This indicator is an upgrade of traditional MACD on MT4. Macd Base line cross above Macd signal line the color of histogram change is red color and entry order Sell. Macd Base line cross below Macd signal line the color of histogram change is green color and entry order Buy. For above histogram of Macd can change color to good looking by can change color above zero line and lower line.
Provides Regression Channel on the current chart. Combined by Trend of Moving Averages and Multi timeframes Oscillator Indicators: CCI, RSI, Stochastic, and MACD with specific working logic . It could make us easier to identify swing high-low as an entry point, the retracement area while following the current trend. Consists of 2 types of signal, main and secondary. The main signal will draw very clearly triangle and lines on the chart with the word " BUY" or 'SELL'. and the secondary is the sta
The Sextet Scalper Pro  is an MT4 indicator that gives signals when new waves are starting in a trend. The trends are calculated using the original " The Sextet " indicator method. You get a free EA to trade with The Sextet Scalper Pro: Free EA . Default settings were optimized on GBPUSD H1 from 2017. EA could be tested on free demo version of The Sextet Scalper Pro, before purchase. Key Features: Uses The Sextet Trend Detection Method which is already a good strategy in itself for detecting lo
Overview Base Box Indicator automatically detects and draws institutional supply and demand base zones using the Rally-Base-Rally (RBR) and Drop-Base-Drop (DBD) price action methodology — one of the most reliable frameworks for identifying high-probability reversal and continuation areas. Unlike basic support/resistance tools, this indicator isolates the precise consolidation phase (the "Base") between two impulse moves and renders it as a structured 3-layer box that separates candle bodies from
Color Stochastic Enhanced Stochastic Oscillator with Cross Detection and Visual Signal Support Overview Color Stochastic is a customized version of the classic Stochastic Oscillator designed for momentum analysis and crossover visualization. The indicator provides color-based signal marking and configurable crossover detection at user-defined overbought and oversold levels. It can be used as part of: Momentum analysis Mean reversion workflows DCA-based strategies Multi-indicator confirmation sys
Gli utenti di questo prodotto hanno anche acquistato
Gann Made Easy
Oleg Rodin
4.83 (162)
Gann Made Easy è un sistema di trading Forex professionale e facile da usare che si basa sui migliori principi del trading utilizzando la teoria di mr. WD Gann. L'indicatore fornisce segnali ACQUISTA e VENDI accurati, inclusi i livelli di Stop Loss e Take Profit. Puoi fare trading anche in movimento utilizzando le notifiche PUSH. CONTATTAMI DOPO L'ACQUISTO PER RICEVERE GRATUITAMENTE LE ISTRUZIONI DI TRADING E OTTIMI INDICATORI EXTRA! Probabilmente hai già sentito parlare molte volte dei metodi d
The Propfolio Master Suite is the ultimate all-in-one analytical workstation for professional traders. Combining the power of the Beat The Market Maker (BTMM) methodology, Smart Money Concepts (SND/Liquidity), and Advanced Volume Profile, this suite replaces multiple different indicators with one optimized engine. Monitor up to 14 pairs simultaneously from a single chart, instantly identify market cycles, and seamlessly map institutional footprints with the click of a button. The Command Center
Scalper Inside PRO
Alexey Minkov
4.74 (69)
Scalper Inside PRO Scalper Inside PRO is an intraday trend and scalping indicator for MetaTrader 4 that uses an exclusive algorithm to quickly detect market direction and key target levels. It automatically calculates entry, exit and multiple profit targets, and shows detailed performance statistics so you can see how different instruments and strategies performed. This helps you choose the most suitable trading instruments for the current market conditions. Additionally, you can easily integrat
PZ Harmonacci Patterns
PZ TRADING SLU
3.17 (6)
Trade smarter, not harder: Empower your trading with Harmonacci Patterns This is arguably the most complete harmonic price formation auto-recognition indicator you can find for the MetaTrader Platform. It detects 19 different patterns, takes fibonacci projections as seriously as you do, displays the Potential Reversal Zone (PRZ) and finds suitable stop-loss and take-profit levels. [ Installation Guide | Update Guide | Troubleshooting | FAQ | All Products  ] It detects 19 different harmonic pric
M1 Sniper
Oleg Rodin
5 (23)
M1 SNIPER è un sistema di indicatori di trading facile da usare. Si tratta di un indicatore a freccia progettato per l'intervallo temporale M1. L'indicatore può essere utilizzato come sistema autonomo per lo scalping sull'intervallo temporale M1 e come parte del tuo sistema di trading esistente. Sebbene questo sistema di trading sia stato progettato specificamente per il trading sull'intervallo temporale M1, può comunque essere utilizzato anche con altri intervalli temporali. Inizialmente ho pro
Auto Optimized Parabolic RSI: Motore di Momentum 3D Avanzato La maggior parte degli indicatori per trader privati fallisce perché si affida a parametri statici che smettono di funzionare nel momento in cui la volatilità del mercato cambia. Auto Optimized Parabolic RSI risolve il problema dell'"obsolescenza dell'indicatore" ricalcolando continuamente il proprio vantaggio matematico, portando un adattamento quantitativo di livello istituzionale direttamente sul tuo terminale MT5. Il Vantaggio Prin
PRO Renko System
Oleg Rodin
5 (30)
PRO Renko System è un sistema di trading altamente accurato appositamente progettato per il trading di grafici RENKO. Questo è un sistema universale che può essere applicato a vari strumenti di trading. Il sistema neutralizza efficacemente il cosiddetto rumore di mercato che consente di accedere a segnali di inversione accurati. L'indicatore è molto facile da usare e ha un solo parametro responsabile della generazione del segnale. Puoi facilmente adattare lo strumento a qualsiasi strumento di
NAM Order Blocks
NAM TECH GROUP, CORP.
3.67 (3)
MT4 Multi-timeframe Order Blocks detection indicator. Features - Fully customizable on chart control panel, provides complete interaction. - Hide and show control panel wherever you want. - Detect OBs on multiple timeframes. - Select OBs quantity to display. - Different OBs user interface. - Different filters on OBs. - OB proximity alert. - ADR High and Low lines. - Notification service (Screen alerts | Push notifications). Summary Order block is a market behavior that indicates order collection
Quants HL Break
Ferhat Mutlu
5 (2)
Calcolo avanzato fatto da pura azione sui prezzi per trovare breakout LH e HL. Ti darà un grande punto di inversione nel mercato.I segnali LH e HL possono essere utilizzati anche per i breakout di traingle. Una volta che si verifica un breakout, indica una forte inversione.Bel filtro per le medie mobili.Consiglio vivamente di usarlo con gli indicatori di tendenza. Può essere utilizzato come ulteriore conferma per supporto e resistenza, indicatori della domanda di offerta. Maggiori dettagli po
Dynamic Forex28 Navigator
Bernhard Schweigert
4.43 (7)
Dynamic Forex28 Navigator - Lo strumento di trading Forex di nuova generazione. ATTUALMENTE SCONTATO DEL 49%. Dynamic Forex28 Navigator è l'evoluzione dei nostri indicatori popolari di lunga data, che combinano la potenza di tre in uno: Advanced Currency Strength28 Indicator (695 recensioni) + Advanced Currency IMPULSE con ALERT (520 recensioni) + CS28 Combo Signals (Bonus). Dettagli sull'indicatore https://www.mql5.com/en/blogs/post/758844 Cosa offre l'indicatore di forza di nuova generazione?
RFI levels PRO
Roman Podpora
5 (1)
L'indicatore mostra accuratamente i punti di inversione e le zone di ritorno dei prezzi in cui il       Principali attori   . Vedi dove si formano le nuove tendenze e prendi decisioni con la massima precisione, mantenendo il controllo su ogni operazione. VERSION MT5     -     Rivela il suo massimo potenziale se combinato con l'indicatore   TREND LINES PRO Cosa mostra l'indicatore: Strutture di inversione e livelli di inversione con attivazione all'inizio di un nuovo trend. Visualizzazione dei l
Apollo SR Master è un indicatore di Supporto/Resistenza con caratteristiche speciali che rendono il trading con le zone di Supporto/Resistenza più semplice e affidabile. L'indicatore calcola le zone di Supporto/Resistenza in tempo reale senza alcun ritardo, rilevando i massimi e i minimi dei prezzi locali. Quindi, per confermare la nuova area SR formata, l'indicatore mostra un segnale speciale che segnala che la zona SR può essere presa in considerazione e utilizzata come un vero e proprio segna
Se acquisti questo indicatore, riceverai il mio Trade Manager Professionale   + EA  GRATUITAMENTE. Innanzitutto è importante sottolineare che questo sistema di trading è un indicatore Non-Repainting, Non-Redrawing e Non-Lagging, il che lo rende ideale sia per il trading manuale che per quello automatico. Corso online, manuale e download di preset. Il "Sistema di Trading Smart Trend MT5" è una soluzione completa pensata sia per i trader principianti che per quelli esperti. Combina oltre 10 indic
CRT Candle Range Theory HTF MT4.   Ultimate CRT Indicator: Advanced ICT Concepts and Malaysian SnR Trading System Discounted   Price   $50  !!     Secure your lifetime access   now   before it switches to   subscription-only ! Master the Market Maker's Footprints with the Most Advanced Candle Range Theory Indicator Unlock the true power of   Smart Money Concepts (SMC)   and trade precisely like the institutions with the   Ultimate CRT Indicator . Built exclusively for serious traders, this indic
ATTUALMENTE SCONTATO DEL 40% La soluzione migliore per ogni principiante o trader esperto! Questo indicatore è uno strumento di trading unico, di alta qualità e conveniente perché abbiamo incorporato una serie di caratteristiche proprietarie e una nuova formula. Con un solo grafico è possibile leggere la forza delle valute per 28 coppie Forex! Immaginate come migliorerà il vostro trading perché sarete in grado di individuare l'esatto punto di innesco di una nuova tendenza o di un'opportunità
Segnale GoldRush Trend Arrow L'indicatore GoldRush Trend Arrow Signal fornisce un'analisi precisa e in tempo reale dei trend, pensata appositamente per gli scalper ad alta velocità e a breve termine nel mercato XAU/USD. Progettato specificamente per il timeframe di 1 minuto, questo strumento mostra frecce direzionali che indicano chiari punti di ingresso, consentendo agli scalper di navigare con sicurezza nelle condizioni di mercato volatili. L'indicatore è composto da frecce di avviso PRIMA
Market Structure Patterns MT4
Samuel Manoel De Souza
5 (18)
Market Structure Patterns   è un indicatore basato sui   Smart Money Concepts   che mostra gli   elementi SMC/ICT   che possono portare le tue decisioni di trading a un livello superiore. Approfitta di   alert ,   notifiche push   e   email   per essere avvisato quando si forma un elemento sul grafico, il prezzo supera un livello e/o entra in una zona. Gli sviluppatori possono accedere ai valori degli elementi dell’indicatore utilizzando le   variabili globali , consentendo l’automazione delle d
Advanced Supply Demand
Bernhard Schweigert
4.91 (300)
Speciale Trading- SCONTO DEL 40% La soluzione migliore per qualsiasi trader principiante o esperto! Questo indicatore è uno strumento di trading unico, di alta qualità e conveniente, perché abbiamo incorporato una serie di funzionalità proprietarie e una nuova formula. Con questo aggiornamento, potrai visualizzare doppie zone di timeframe. Non solo potrai visualizzare un TF più alto, ma anche entrambi, il TF del grafico e il TF più alto: MOSTRA ZONE ANNIDATE. Tutti i trader che operano con Of
PZ Turning Points MT4
PZ TRADING SLU
1 (1)
Identify key turning points with reliable fractal analysis This indicator examines the price structure of fractals of different periods to determine possible reversal points in the market, providing timing to positional traders that already have a fundamental or technical valuation model. Unlike its younger brother, Reversal Fractals , this indicator won't miss reversals because of the period selected, and will find reversal fractals on a zig-zag fashion, ignoring those reversals which do not
L'indicatore " Dynamic Scalper System " è progettato per il metodo di scalping, ovvero per il trading all'interno di onde di trend. Testato sulle principali coppie di valute e sull'oro, è compatibile con altri strumenti di trading. Fornisce segnali per l'apertura di posizioni a breve termine lungo il trend, con ulteriore supporto al movimento dei prezzi. Il principio dell'indicatore. Le frecce grandi determinano la direzione del trend. Un algoritmo per generare segnali per lo scalping sotto fo
Se fai trading nel Forex, avere informazioni dettagliate sulla forza delle valute e sulla correlazione tra coppie di valute può portare il tuo trading a un livello superiore. La correlazione ti aiuterà a dimezzare il rischio, mentre l'analisi della forza ti permetterà di massimizzare i profitti. Questo indicatore offre un approccio ibrido per selezionare le coppie di valute più appropriate, combinando l'analisi della forza delle valute e la correlazione tra coppie di valute. Come utilizzare l'a
ATTUALMENTE SCONTATO DEL 26%!! Questo indicatore è una super combinazione di entrambi i nostri indicatori principali ( Advanced Currency Strength 28   &  Advanced Currency IMPULSE with ALERT  ). Mostra i valori di forza della valuta per unità di TICK e segnali di allerta per 28 coppie Forex. È possibile utilizzare 11 diverse unità di Tick. Si tratta di 1, 2, 3, 4, 5, 6, 10, 12, 15, 20 e 30 secondi. La barra dell'unità di tick nella finestra secondaria verrà mostrata e spostata a sinistra quand
Day Trader Master è un sistema di trading completo per i day trader. Le systeme se compose de due indicatori. Un indicar est un signal fléché pour acheter et vendre. C'est l'indicateur de fleche que vous obtenez. Je vous fournirai le deuxième indicaur gratuitement. Le deuxième indicaur è un indicaur de tendance spécialement conçu pour être utilisé conjointement avec ces flèches. GLI INDICATORI NON SI RIPETONO E NON RITARDANO! Usare questo sistema è molto semplice. Devi solo seguire i segnali del
KURAMA GOLD SIGNAL PRO (MT4) — Sistema di Trading XAUUSD Completo con Filtro a 7 Strati, TP/SL Automatico e Punteggio di Qualità NESSUN REPAINT. NESSUN RIDISEGNO. NESSUN RITARDO. Ogni segnale è permanente. Ciò che vedi è ciò che ottieni. BONUS: Acquista la licenza a vita e ricevi AI Zone Radar (valore $59) + manuale PDF completo GRATIS. Inviami un messaggio dopo l'acquisto. AI Zone Radar: https://www.mql5.com/en/market/product/175834 FIDUCIA DEI TRADER: Già utilizzato da una community attiva
Master head and shoulders patterns for better trading decisions A head and shoulders pattern is a chart formation that resembles a baseline with three peaks, the outside two are close in height and the middle is highest. It predicts a bullish-to-bearish trend reversal and is believed to be one of the most reliable trend reversal patterns. It is one of several top patterns that signal, with varying degrees of accuracy, that a trend is nearing its end. [ Installation Guide | Update Guide | Trouble
PZ Double Top Bottom
PZ TRADING SLU
5 (1)
Trade double tops and bottoms effectively The PZ Double Top/Bottom Indicator is a technical analysis tool that helps traders identify potential price reversal patterns in the market. These patterns, known as double tops and bottoms, are characterized by two consecutive peaks or valleys in the price of an asset. Double tops and bottoms are often seen as potential reversal patterns because they can signal a change in the direction of the current trend. [ Installation Guide | Update Guide | Troubl
Gold Scalper Super
Aleksandr Makarov
5 (2)
Gold Scalper Super is an easy-to-use trading system. The indicator can be used as a standalone scalping system on the M1 time frame, as well as part of your existing trading system. Bonus: when purchasing an indicator, Trend Arrow Super is provided free of charge, write to us after purchase. The indicator 100% does not repaint!!! If a signal appears, it does not disappear! Unlike indicators with redrawing, which lead to the loss of a deposit, because they can show a signal and then remove it.
Un indicatore tecnico che struttura i grafici e identifica i movimenti ciclici dei prezzi. Può funzionare su qualsiasi grafico. Diversi tipi di notifiche. Ci sono altre frecce sul grafico stesso. Senza ridisegnare la storia, lavora sulla chiusura della candela. TF consigliati da M5 in su. Parametri facili da usare e configurare. Se si utilizzano 2 indicatori con parametri diversi, è possibile utilizzarli senza altri indicatori. Ha 2 parametri di input Ciclicità e durata del segnale Questi 2 pa
KuKl
IGOR KIRIANEN
The indicator is built on a non-standard Zig Zag, it draws accumulations after which if the price leaves this zone and a test of this zone occurs, then a sound signal is given and an arrow appears - after the test candle closes.The indicator does not redraw its signals, it is very easy to use, there are only three settings 1- this is the zig zag parameter 2- this is the minimum price exit from the zone 3- this is the maximum price exit from the zone. The lower the parameter for Zig Zag, the more
Trend Screener
STE S.S.COMPANY
4.79 (95)
Indicatore di tendenza, soluzione unica rivoluzionaria per il trading di tendenze e il filtraggio con tutte le importanti funzionalità di tendenza integrate in un unico strumento! È un indicatore multi-timeframe e multi-valuta al 100% non ridipingibile che può essere utilizzato su tutti i simboli/strumenti: forex, materie prime, criptovalute, indici e azioni. OFFERTA A TEMPO LIMITATO: l'indicatore di screening di supporto e resistenza è disponibile a soli 65$ e a vita. (Prezzo originale 250$) (o
Filtro:
Nessuna recensione
Rispondi alla recensione