Average Levels
- Indicatori
-
Makarii Gubaydullin
 Assistente di Trading Multifunzionale
MT5: https://www.mql5.com/it/market/product/71145 - Versione: 1.35
- Aggiornato: 17 luglio 2023
- Attivazioni: 20
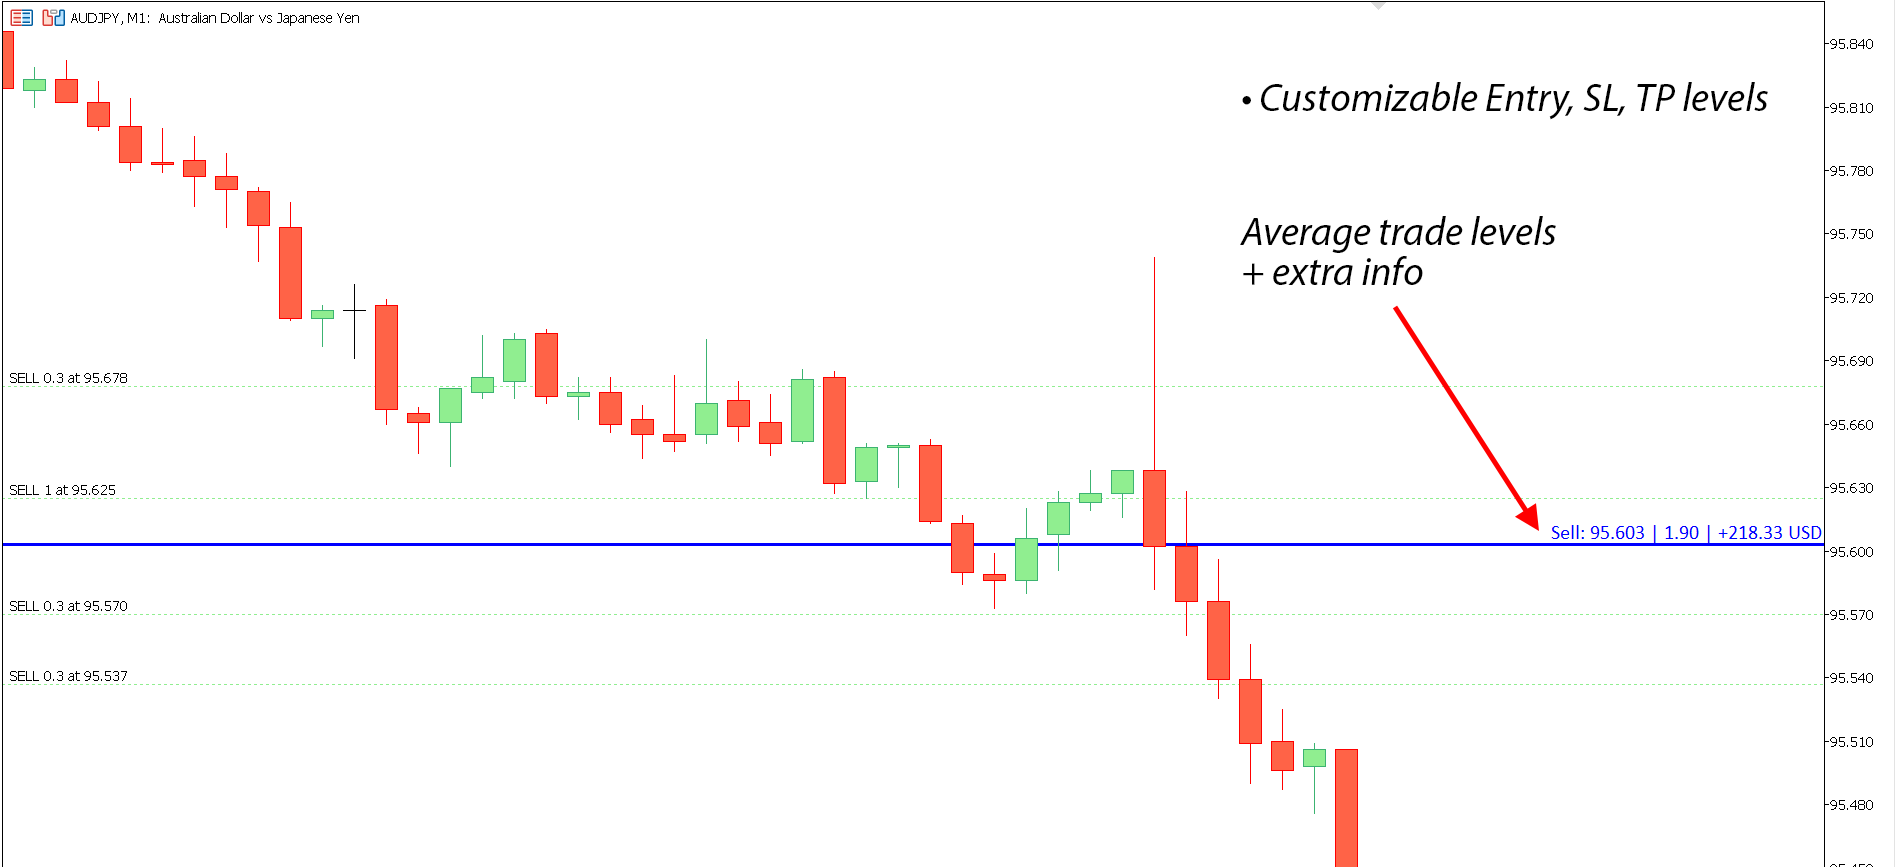
I livelli medi di Entry, SL e TP di tutte le operazioni sul simbolo.
I livelli possono essere calcolati insieme o separatamente per operazioni di acquisto e vendita.
Puoi opzionalmente visualizzare informazioni aggiuntive: prezzo del livello, dimensione totale dei lotti, P/L fluttuante.
Gli stili e i colori dei livelli sono personalizzabili.
Utilità multifunzionale: include 66+ funzionalità | Contattami se hai domande | Versione MT4
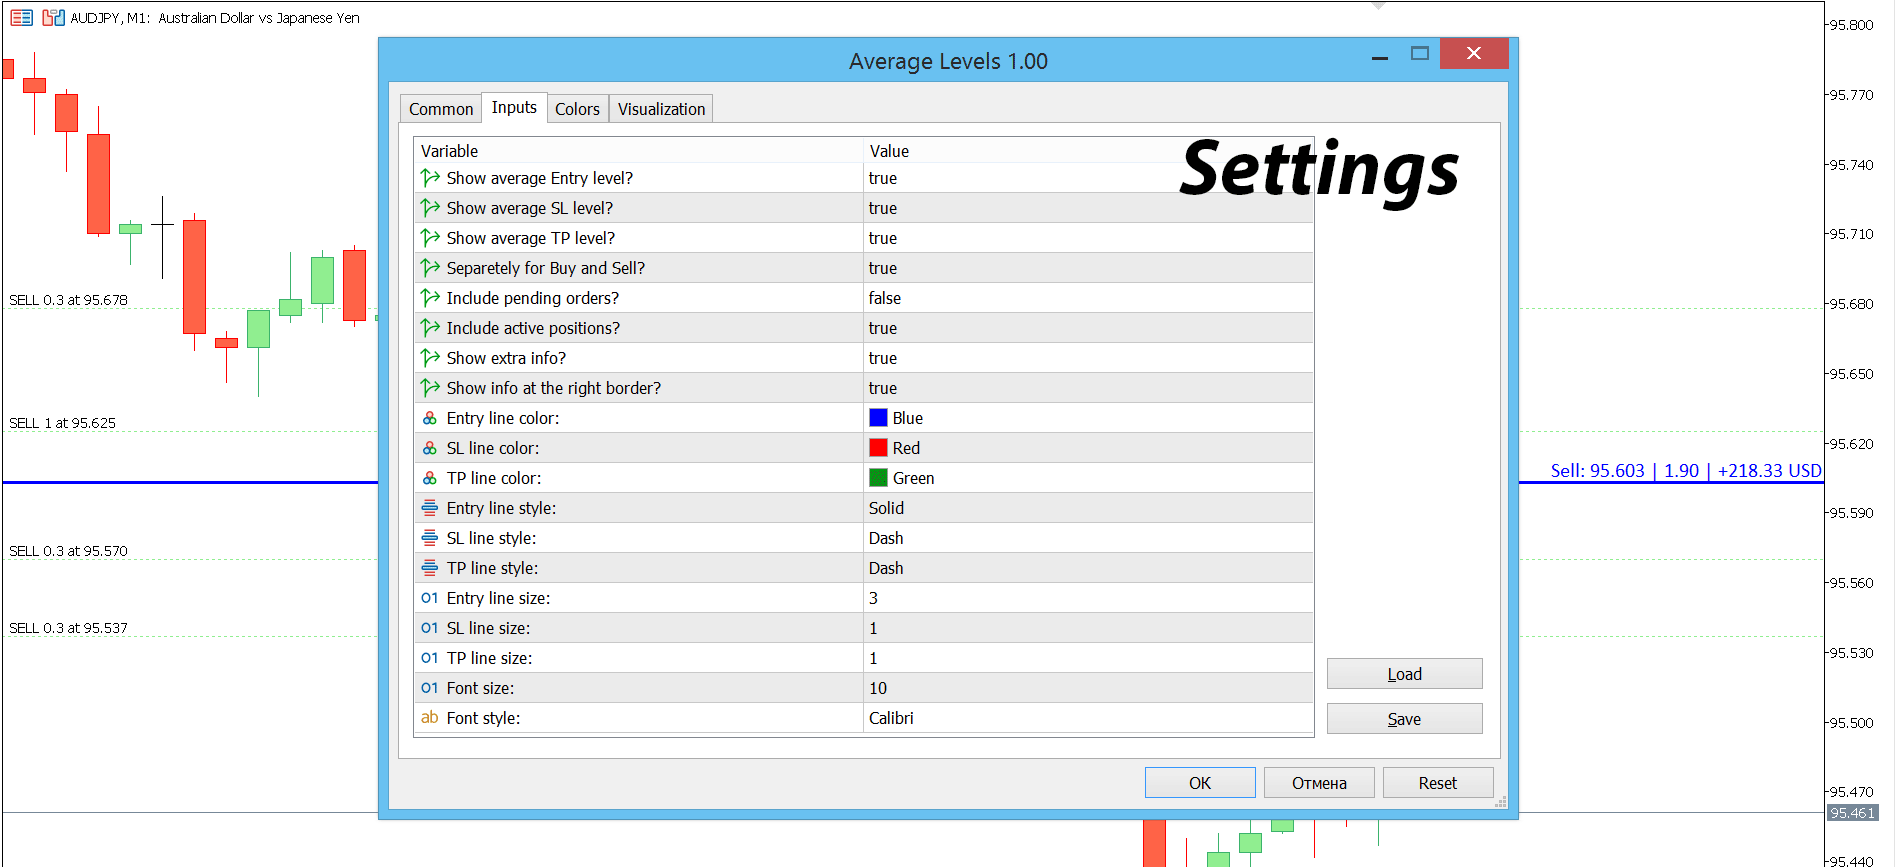
Nelle impostazioni dell'indicatore, puoi configurare:
- Livello di Entry medio: acceso/spento;
- Livello SL medio: acceso/spento;
- Livello TP medio: acceso/spento;
- Separatamente per acquisti e vendite: se 'false' è selezionato - i livelli saranno calcolati insieme per acquisti e vendite.
- Includi ordini pendenti: acceso/spento;
- Includi posizioni attive: acceso/spento;
- Mostra informazioni extra: acceso/spento;
- Mostra informazioni sul bordo destro? se 'false': le informazioni extra saranno mostrate sul bordo sinistro;
- Colore linee e testo: per Entry, SL e TP;
- Stile linea: per i livelli Entry, SL e TP;
- Dimensione linea: per i livelli Entry, SL e TP;
- 'Dimensione carattere' e 'Stile carattere': se 'Mostra informazioni extra' è abilitato.
Il file del programma deve essere collocato nella directory "Indicators"
Fantastic One.