Guarda i video tutorial del Market su YouTube
Come acquistare un Robot di Trading o un indicatore
Esegui il tuo EA
hosting virtuale
hosting virtuale
Prova un indicatore/robot di trading prima di acquistarlo
Vuoi guadagnare nel Market?
Come presentare un prodotto per venderlo con successo
Nuovi Expert Advisors e Indicatori per MetaTrader 5 - 168

Cycle Identifier Pro: Advanced Swing Highs & Lows Indicator Description: Unlock the full potential of your trading strategy with Cycle Identifier Pro , a cutting-edge indicator meticulously designed to pinpoint swing highs and swing lows with unparalleled precision. Whether you’re a seasoned trader or just starting out, Cycle Identifier Pro offers the tools you need to navigate any market condition across all timeframes with confidence. Key Features: Accurate Swing Detection : Swing Highs and Lo
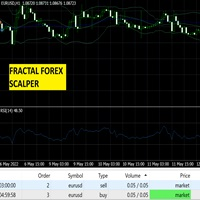
This is an expert advisor which uses FrAMA (Fractal Adaptive Moving Average), RSI (Relative Strength Index), and Bollinger Bands to scalp the market for bullish or bearish trades. The strategy focuses on the bullish and bearish crossover of the FrAMA line with respect to the middle Bollinger band. RSI is used to confirm the price movement momentum prior to reaching overbought or oversold territory.
Adjustable Stop Loss and Take Profit inputs are also included in the expert advisor.
This EA

Clicks is a tool to improve the execution , management and accuracy of your trading.
Features: Allows you to set trading limits and show your statistics right on the chart. Allows you to open, modify, delete/close orders from a panel and makes it easy to set takeprofit and stoploss levels. Helps you trade using the trendlines drawn on your chart. The algo executes your orders when price reaches your trendlines. It has an automatic trailing stops feature so you can milk the market as much as you

Road Runner utilizes the principles of stochastic trading signals and the reverse stochastic signal for entry depending on optimized preferences. To place a buy order in a support area, the stochastic reading must be below 20, and the %K line must cross the %D line upwards. Likewise, to place a sell order in a resistance area, the stochastic reading must be above 80, and the %K line must cross the %D line downwards. Reverse stochastic places opposite orders under convention stochastic conditions

FX Levels: Supporti e Resistenze di Precisione Eccezionale per Tutti i Mercati Panoramica Rapida
Cercate un modo affidabile per individuare livelli di supporto e resistenza in ogni mercato—coppie di valute, indici, azioni o materie prime? FX Levels fonde il metodo tradizionale “Lighthouse” con un approccio dinamico all’avanguardia, offrendo una precisione quasi universale. Basato sulla nostra esperienza reale con i broker e su aggiornamenti automatici giornalieri più quelli in tempo reale, FX

SuperTrend Strategy EA MT5 è uno strumento avanzato progettato esclusivamente per MetaTrader 5, che semplifica le attività di trading sfruttando l’indicatore SuperTrend per automatizzare le entrate delle operazioni basate su segnali di acquisto o vendita. L’EA supporta configurazioni di trading inverso all’interno di zone chiave, offrendo versatilità nella gestione delle operazioni. Ampiamente testato, offre metodi di ingresso precisi, regole di uscita flessibili e una gestione avanzata del risc

Presentiamo il Quantum Quotient per trader e aspiranti PropFirms. Questo sistema di trading automatico implementa una strategia priva di tattiche MARTINGALE e GRID, costruita meticolosamente utilizzando indicatori tecnici e fondamentali proprietari. Queste metodologie sono state sottoposte a rigorosi test e affinamenti per oltre un anno.
La strategia Quantum Quotient comprende quattro passaggi chiave:
1. Analisi dell'Offerta e della Domanda: Inizialmente, il sistema calcola i livelli di offerta

Donchian Channel Strategy EA MT5 è uno strumento avanzato progettato esclusivamente per MetaTrader 5, che semplifica le attività di trading sfruttando l’indicatore dei Canali di Donchian per automatizzare le entrate e le uscite delle operazioni basate su condizioni di ipercomprato e ipervenduto. L’EA supporta configurazioni di trading inverso all’interno di queste zone, offrendo versatilità nella gestione delle operazioni. Ampiamente testato, offre metodi di ingresso precisi, regole di uscita fl

Ichimoku Cloud Strategy EA MT5 est un outil avancé conçu exclusivement pour MetaTrader 5, simplifiant les activités de trading en exploitant l’indicateur Ichimoku Cloud pour automatiser les entrées et sorties de trades basées sur six stratégies distinctes. L’EA prend en charge les configurations de trading inversé dans des zones clés, offrant une polyvalence dans la gestion des trades. Largement testé, il propose des méthodes d’entrée précises, des règles de sortie flexibles et une gestion avanc
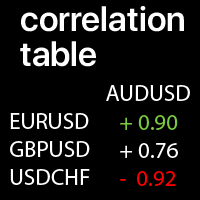
Valori di correlazione tra i simboli selezionati: confronta le tendenze attuali del mercato Un valore di +1: indica una correlazione positiva completa; Un valore di -1: indica una correlazione inversa completa; Un valore di 0: indica che non c'è una correlazione esplicita (i prezzi non dipendono l'uno dall'altro, o la correlazione è casuale ); Utility Multifunzionale #1: 66+ funzioni | Contattami per qualsiasi domanda | Versione MT4 Ogni Simbolo può essere pe

The "Power of Three" (PO3) is a concept developed by the Inner Circle Trader (ICT) to illustrate a three-stage approach used by smart money in the markets: Accumulation, Manipulation, and Distribution . ICT traders view this as a foundational pattern that can explain the formation of any candle on a price chart. In simple terms, this concept is effective for any time frame, as long as there's a defined start, highest point, lowest point, and end. MT4 - https://www.mql5.com/en/market/product/1
FREE

ProVolaBot è un robot di trading algoritmico progettato per operare su indici sintetici.
Mostra prestazioni particolarmente solide sui seguenti mercati: Mercati principali e più efficaci • Boom 900 e Crash 1000 (Deriv)
• GainX 999 e PainX 999 (WellTrade) Questi mercati hanno dimostrato la maggiore stabilità, comportamento statistico affidabile e migliore potenziale di redditività. Mercato aggiuntivo compatibile • Volatility 100 (1s) Index (Deriv) ProVolaBot può operare anche su V100 (1s), ma la
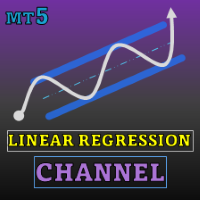
Special offer : ALL TOOLS , just $35 each! New tools will be $30 for the first week or the first 3 purchases ! Trading Tools Channel on MQL5 : Join my MQL5 channel to update the latest news from me Indicatore di Canale di Regressione Lineare è un potente strumento di analisi tecnica che aiuta i trader a identificare trend di prezzo e potenziali punti di inversione. Calcolando e visualizzando canali di regressione lineare, bande e proiezioni future, questo indicatore offre una prosp
Ciao trader, ho progettato questo strumento con risultati reali in modo rigoroso, strumento basato su diverse delle mie precedenti strategie, adattandolo al mercato Forex, Tyr AI, con il potere del Dio dell'ordine, un sistema neurale di apprendimento automatico basato sull'intelligenza artificiale per effettuare un'analisi approfondita del mercato dello scalping un solido EA per gestire bene il mercato ufficiale EURUSD, analizzando il mercato per effettuare voci a livelli professionali senza co

SUBIRA TREND TRADER
Introduzione
Il seguente software non si basa su alcun indicatore e funziona come uno strumento per automatizzare completamente il tuo trading. Non utilizza HFT o strategie rischiose. Le negoziazioni possono essere impilate ma il rischio risultante è minimo. Questo strumento è un cumulo della mia esperienza di trading USD JPY utilizzando price action e candele. Il rilevamento dei pattern non è semplice per le macchine come lo è per gli umani e sono stati utilizzati algorit

Traccia automaticamente i livelli di Fibonacci, basati sui prezzi Massimo e Minimo del timeframe specificato Più barre possono essere unite: ad esempio, puoi ottenere un Fibonacci basato sui Massimi e Minimi di 10 giorni Il mio #1 Strumento : 66+ funzionalità, incluso questo indicatore | Contattami per qualsiasi domanda | Versione MT4 Aiuta a identificare potenziali livelli di inversione; I pattern formati ai livelli di Fibonacci tendono a essere più forti; Riduce notevolmente
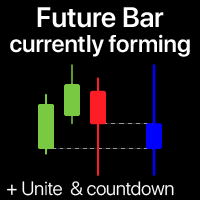
L'indicatore mostra la candela attualmente in formazione del timeframe selezionato Più barre possono essere opzionalmente unite in una singola candela: aiuta a vedere il quadro generale. Utility Multifunzione #1 : 65+ funzioni, incluso questo indicatore | Contattami per qualsiasi domanda | Versione MT4 Nelle impostazioni di input, seleziona il timeframe che verrà utilizzato per la barra futura: A destra del prezzo corrente, vedrai una barra in formazione nell'intervallo specific
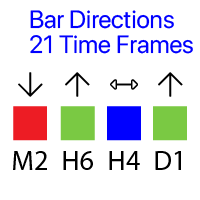
Mostra la direzione delle barre su tutti i 21 timeframe. Utilità multifunzione : 65+ funzioni, incluso questo strumento | Contattami per qualsiasi domanda | versione per MT4
Significato dei segnali visivi ( quadrati):
Rosso : Il prezzo di chiusura è inferiore al prezzo di apertura: Close < Open; Verde : Il prezzo di chiusura è superiore al prezzo di apertura: Close > Open; Blu : Il prezzo di chiusura è uguale al prezzo di apertura: Close = Open; Puoi impostare lo Scost

Potente EA pullback per negoziare qualsiasi coppia di valute.
Esibizione live: https://www.mql5.com/en/signals/2267756 - invia un messaggio privato per richiedere i file del set
Avvio rapido - Imposta l'EA sul grafico M15 di EURGBP (solo vendita), EURCHF (solo acquisto), USDCAD (solo acquisto), EURUSD (solo vendita). - Il rischio una tantum è di circa 300 usd al paio per un lotto minimo. Assicurati che i rischi siano comodi per te. - Assicurati che le impostazioni del fuso orario siano corrett

Questo bot di trading per lo scalping è progettato per un trading altamente preciso ed efficiente, utilizzando l'intelligenza artificiale per individuare i punti di ingresso più favorevoli sul mercato. Il bot dispone di una strategia avanzata di autoapprendimento, che gli consente di adattarsi alle condizioni di mercato in continua evoluzione e di ottimizzare il suo approccio in tempo reale. Ogni operazione è protetta da uno stop-loss rigoroso, riducendo al minimo le perdite potenziali e garante
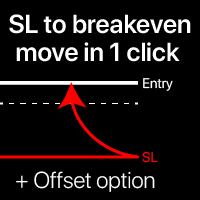
Livelli di breakeven: sposta SL con 1 clic. Evita di perdere profitti esistenti Con questo strumento, puoi proteggere rapidamente il tuo profitto con un solo clic. Particolarmente importante per il trading a breve termine. Disponibile anche l'opzione offset. Utility multifunzione : 66+ funzioni, incluso questo strumento | Contattami per qualsiasi domanda | Versione MT4 Come spostare i livelli SL: 1. Specifica un [Simbolo] particolare, o seleziona [TUTTI] i simboli. 2. Seleziona il tipo di trade

<<< Dai un'occhiata ai miei altri prodotti - >>>
Crazy Pirate, un Expert Advisor progettato per la piattaforma MetaTrader, si pone come un faro di semplicità nel complesso mondo del trading forex. Focalizzato su una gamma di sterline e dollari, offre un approccio nuovo e diretto al mercato. A differenza di molti strumenti di trading contemporanei influenzati da complessi algoritmi di intelligenza artificiale, Pirate ritorna alle origini, utilizzando strategie che hanno dimostrato il loro valor
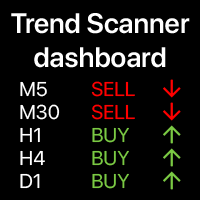
Cruscotto delle tendenze: indicatore multi-timeframe, mostra il riepilogo della tendenza attuale Questo strumento si basa su 3 indicatori principali: RSI, Stocastico e Commodity Channel Index. L'opzione avvisi ti aiuterà a non perdere l'inizio della tendenza. Utility multifunzione : include 66+ funzioni | Contattami se hai domande | Versione MT4 Una varietà di opzioni ti permetterà di personalizzare l'indicatore in base alle tue esigenze. Impostazioni: Barra calcolata

Ciao trader, ho progettato questo strumento con risultati reali in modo rigoroso, strumento basato su diverse delle mie precedenti strategie AI,
Crypto AI Pro si basa sull'esecuzione di operazioni di acquisto e vendita di asset finanziari in periodi di tempo molto brevi, cercando di ottenere profitti da piccole fluttuazioni nei prezzi. Quando applicato a Bitcoin, uno scalper utilizza algoritmi di intelligenza artificiale e apprendimento automatico per analizzare grandi quantità di dati di merc
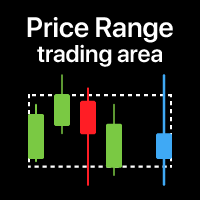
Zona di prezzo: visualizzazione del range di trading per il periodo selezionato Particolarmente utile per il trading su timeframe bassi , per vedere il range da un TF superiore . Il mio #1 Strumento : 66+ funzioni, incluso questo indicatore | Contattami per domande | Versione MT4 Quando può essere utile: Quando si usano più timeframe Per vedere il quadro generale da un altro periodo Per vedere l'intero range del periodo selezionato Impostazioni: Colore della zona Riempimento zona: se
The Ninja Turtle Scalper uses the Donchian Channel EA to find entry signals – just like the famous turtle trades did back then. The indicator is simple but yet effective. It is used by professional traders for many years and now also part of the MT5 framework. If you ever wanted to use the indicator's signals for scalping entries, this is the right EA for you. No AI, Martingale or Grid needed. This is NOT the holy grail of trading. It will not make you rich over night and it is not risk free. Ju
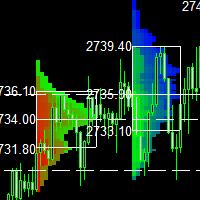
This indicator is a classic implementation of the Market Profile (Volume Profile Visible Range), allowing for the display of price density over time while highlighting the most significant price levels, the value area, and the control price within a specific trading session. MT4-version: https://www.mql5.com/en/market/product/125261
The indicator can be applied across timeframes from M1 to D1, enabling the analysis of market profiles for daily, weekly, monthly, or intraday trading. Utilizing

Hey!. Welcome to my board, some explanation below: IC Markets XAUUSD M30 Low Risk Scalper system for M30 XAUUSD . Default file is ready to use and it has a very interesting working mechanism based on the indicator Tyr-Bands XAU. The indicator already points the way with an arrow, what this trading system does is to activate a buy/sell of 0.05 Lots (Yes, it has to be above 0.01 lots), because the system has partial closures depending on configuration, A1 50%/25%; A2 100%; A3 75%/25%. So the fi
FREE

Overview The Smart Money Structure Markup Indicator for MetaTrader 5 is a powerful tool designed to help traders identify key market structures based on popular Smart Money Concepts (SMC) strategies. This indicator detects micro-market structures, providing insights into price movements and potential trend changes. It highlights important elements such as valid Break of Structure (BOS), Change of Character (CHoCH), and Inducement (IDM), helping traders to make informed decisions. Key Features Ma
FREE
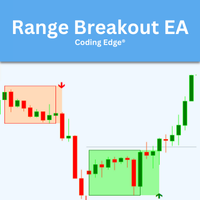
Range Breakout EA – Catch the Moves in the Asian Session! Hey there! Our Range Breakout EA is built to help you take advantage of those early moves in the Asian session. Here’s how it works: during a specific time window, it marks the highest and lowest points to create a range. Then, it sets up buy and sell limit orders just outside that range, so you’re ready to catch a breakout in either direction! :) For safety, the stop loss goes at the opposite end of the range, but you can customize it i

MT5 Send To Telegram – Trade Notifications to Telegram MT5 Send To Telegram EA is a professional-grade notification and monitoring utility for MetaTrader 5. It delivers clean, real-time trade activity from your MT5 account to Telegram , so you can stay informed from anywhere (mobile / desktop). Safe by design: this EA is read-only and does not open, close, or modify trades . It only monitors your account and sends notifications. Receive alerts for entries, exits, pending orders, SL/TP changes, s

Real Spread Monitor is a powerful indicator that is designed to accurately measure and analyze real spreads, giving traders the ability to compare trading conditions of different brokers. This product is also available for MetaTrader 4 => https://www.mql5.com/en/market/product/125769 Key Features of Real Spread Monitor:
1. Two modes of operation: Write mode : In this mode the indicator collects data on real spreads of the selected trading instrument and records them in a file. The spread is r

Coulter_Precision — Enhance Your Market Potential with Precision and Control Coulter_Precision is a professional trading advisor designed for traders who seek to control every aspect of their strategy on the market. By working exclusively with pending orders, this EA allows you to focus on planning entry points and managing risks, leaving the mechanical part of the work to an automated assistant. The unique feature of Coulter_Precision is that it does not make decisions on its own about the trad

Test Trade Saver Script
Application Type: Script
Application Functions: Saves test results cache file data into text files
About the Application The script extracts trading results from a test system cache file and saves them into text files for further analysis. How to Use Parameters: LOG_LEVEL - Logging level in the Experts terminal section. DEBUG provides the most detailed information, while ERROR gives the minimum. CUSTOM_MAGIC_NUMBER - The system identifier (Magic Number) used to save resu
FREE

Overview Bot Name : Plan Xchange Version : 1.00 Default Setting : XAUUSD/Gold Timeframe: M15 Time Zone: UTC+3 Plan Xchange: The Ultimate Multi-Symbol Breakout EA A Simple Breakout Expert Advisor designed for traders who demand precision, control, and robust risk management. Plan Xchange is a fully automated trading robot that specializes in a time-based breakout strategy. It uses key trading ranges during specific market hours, placing pending orders to capitalize on breakouts with precision.

The script calculates the rate of price change and its deviation. Displays a typical price movement channel. Transfer the script to the chart and it will automatically mark up the channels through which the price can move in the near future. Place orders according to the channel boundaries.
The script uses statistical methods to determine the rate and amplitude of the price. It calculates and displays channels and limits of further movement based on them.
Parameters
PLACEMENT - channel place

# Indicador Daily High - Danilo Monteiro - MT5
## Descrição O Daily High/Low Labels é um indicador personalizado para MetaTrader 5 que exibe automaticamente as máximas e mínimas diárias no gráfico, facilitando a identificação rápida dos níveis importantes de preço. O indicador marca os preços com etiquetas e linhas horizontais, permitindo uma visualização clara dos níveis críticos do dia atual e anterior.
## Principais Características
### 1. Marcação Automática - Exibe automaticamente as máxi
FREE

THE BEST! yet easy-to-use MT5 to Telegram Trade Copier [MANUAL HERE]
Overview: This powerful tool allows traders to send real-time trade notifications directly to their Telegram channels and group, ensuring they never miss an important market move. TeleBot5 is an innovative MQL5 program designed to seamlessly bridge your MetaTrader 5 trading experience with Telegram.
**Key Features:**
- **Real-Time Trade Alerts:** Instantly receive notifications for every trade executed on your MT5 accoun

This indicator is the mql version of the Smoothed Heiken Ashi Candles. Find out more here: https://www.mql5.com/en/users/rashedsamir/seller Heikin-Ashi charts resemble candlestick charts , but have a smoother appearance as they track a range of price movements, rather than tracking every price movement as with candlesticks.
Because the Heikin Ashi candlesticks are calculated based on averages, the candlesticks will have smaller shadows than a regular Japanese candlestick. Just like with
FREE

Range Bar Pro Indicator for MetaTrader 5
Visualize market trends, levels and other features with Range Bar Pro, an innovative indicator that draws a unique, standalone candle on the right side of any MT5 chart. This single candle is generated from an analysis of price over a specified range, providing you with a powerful snapshot of the market. Key Features: Single-Candle Visualization: Gain quick insights with a single, specially derived candle that reflects comprehensive price movement over a

The Predator system is a fully automated trading robot. The robot can open trades automatically,the user can turn this option off or on in the inputs. The robot generates signals, the signals have an entry price indicated by the blue line, Take profit represented by a lemon horizontal line, Stop loss is represented by the red horizontal line. The Robot has a trend filter. The robot has a trading session filter. The robot shows the reversal candlestick patterns. The user can choose to open a bul

Introducing the Forex Trading EA on Elliott Waves – Optimizing Profit with Minimal Capital The Elliott Wave Theory is one of the foundational principles of technical analysis in any market. Most traders aim to trade within the primary market trend. However, through AI-powered analysis, I have tested and validated that predicting exactly when a main trend begins and ends is virtually impossible. My machine-learning algorithms revealed an intriguing insight during research: there are specific wave
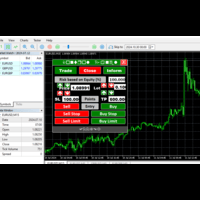
Quick and Easy to use Manual Trader and Risk Management Assistant Gives you a trading environment where you can do forward Testing both on Active Account and Strategy Tester. Suited for Live Trading, Risk Management and also gives you the same Market Capabilities on Strategy tester Provides you with easy editing capabilities and exit strategies that you can Test. ON PROMOTION
FREE

Automatic Advisor for the Bitcoin instrument. Timeframe H1. Terminal MT5 I created this Advisor specifically for a prop company. All the efforts of five years went into creating a safe product. The Advisor consists of 8 small Advisors and is a ready-made Portfolio.
Attention: The Advisor uses two large trading strategies (!): Trend Trading; Trading by Seasonal Patterns (time cycles) The Advisor DOES NOT use toxic strategies: Strategy Availability
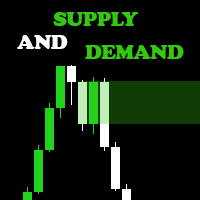
Are you ready to elevate your Forex trading game? Introducing the Supply and Demand Indicator , a powerful tool designed to help traders identify key market zones and make informed decisions with confidence! Key Features: Accurate Zone Identification : Our indicator pinpoints critical supply and demand zones, allowing you to spot potential reversal points and areas of price consolidation. User-Friendly Interface : With an intuitive design, you'll easily navigate through the settings and customiz

SmartTradeEURUSD is an Expert Advisor designed specifically for trading the EURUSD pair on daily candles only , ensuring high accuracy and stability. Leveraging the latest machine learning technologies, the advisor analyzes market data to make optimal trading decisions. Key settings are extremely simple : stop-loss and take-profit levels (in points) as well as position size, allowing for flexible risk and volume management. If the stop-loss or take-profit values are set to 0 , they are not used

Short Description:
FTMO Protector PRO MT5 is an EA designed to protect your funded account by managing risk and ensuring compliance with the Prop Firm's trading rules. This EA automatically monitors equity levels, closes trades when profit targets or drawdown limits are reached, and provides a visual display of key account metrics. EA w orks with all different Prop Firm service providers.
Overview:
FTMO Protector PRO MT5 is an Drawdown Safeguard Expert Advisor meticulously crafted for trade

EuroGuard EA – The Ultimate Trading Solution Introducing EuroGuard EA , a state-of-the-art trading tool designed by professional traders with over 7 years of experience in the forex market. This Expert Advisor leverages a unique and adaptive algorithm that excels in navigating through all market conditions, from extreme volatility to stable trends. EuroGuard EA has been tested rigorously in various scenarios and has consistently delivered impressive results. Its innovative design and unma
FREE

The Expert Advisor "TimeLeft Display" shows the remaining time until the close of the current candle in a digital display. The time is displayed in days, hours, minutes, and seconds. Features: Time Calculation: Calculates the remaining time until the close of the current candle based on the current timeframe of the chart. Digital Display: Shows the remaining time in a digital format. Customizable Font and Size: Allows selection of the font (Arial, Arial Black, Aptos Display, Tahoma,
FREE

This indicator will help you track performance of your trades, even scalping trades. You can use it with the Arab, and many other traders.
This indicator displays essential trading account information directly on your chart. It positions itself in one of the four corners of the screen and showcases details such as: Symbol: The symbol of the asset currently displayed on the chart. Profit/Loss: The total profit or loss in dollars for the current symbol. Pips: The total number of pips gained or
FREE

EuroBlade is an expert advisor using the martingale method.
This expert advisor works under the following conditions
Currency Pair: EURUSD Minimum deposit: 800 USD Minimum leverage: 1:100 Operating time frame: 1H
It achieved an interest rate of 1,922% in the back test from the beginning of 2018 to November 2024. The martingale method is a risky trading technique, but EuroBlade hedges the risk by holding both the sell and buy positions at the same time.
In addition, because of the long-ter
FREE

SuperTrend Indicator Code Description This code defines a custom indicator for the MetaTrader 5 platform called SuperTrend. The indicator is based on the Average True Range (ATR) to identify upward and downward trends in the market. Code Sections: Indicator Information: Defines the indicator's name, copyright, link, version, etc. Configures the indicator to be displayed in a separate window and have 9 internal buffers and 2 visible plots. Sets the properties of the plots (name, drawing type, col
FREE

Introducing Your Ultimate Trading Edge: Dynamic Support & Resistance, Advance Entry Levels Light Indicator for MT5 platform Unlock the power of precision trading with our cutting-edge Dynamic Support & Resistance Indicator. Designed to give traders unparalleled clarity, this indicator is your roadmap to identifying exactly where to buy and sell, maximizing your potential for consistent, sustainable profits. Why Choose Our Indicator? Crystal Clear Entry and Exit Points : No more guesswork. Our

Alligator Window Indicator : Potencialize suas análises no MetaTrader com o Alligator Window. Este indicador coloca o clássico Alligator de Bill Williams em uma janela separada, permitindo uma visualização mais clara e organizada. Ideal para traders que buscam precisão e eficiência em suas operações, o Alligator Window proporciona insights nítidos e facilita a identificação de tendências sem poluir o gráfico principal. Experimente agora e leve suas estratégias de trading a um novo patamar!
FREE
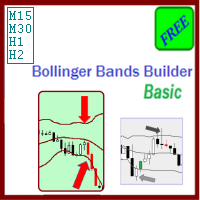
The Bollinger Bands Builder Basic expert advisor is a free and configurable trading strategy using the Bollinger Bands indicator as its primary signal provider technique.
Like its sibling products from the expert advisors group, this systems aims to ensure low drawdown and avoiding exposure to high risks through:
usage of automatically placed stop loss orders for all launched trades; allowing maximum 1 managed open trade at a given time, avoiding pressure on margin/deposit load; minimization o
FREE

Macro Sniper EA follows a scalping breakout strategy. The trades are placed at a specified time of the day, when the most trading activity is recorded each day (on average). This time range is calculated automatically and it adjusts itself in the case of Daylight saving time changes. T he only thing is that for backtesting the first 2 parameters have to be set relative to the server-time offset relavitve to GMT, example: if your server is set to GMT+3, you should set winter to 3 and summer to 4

TrendFusionXplorer consists of three powerful trend-analyzing indicators — TRP , PMax and OTT — developed by Kivanc Ozbilgic. Each indicator displays the trend's support and resistance levels based on its unique properties and methodology. TrendFusionXplorer assists in determining entry and exit points for markets and can also be used for setting trailing stop-loss (SL) and take-profit (TP) levels on open positions.
Specifications
1. Trend Reversal Predictor (TRP): TRP follows Thomas R. DeMar
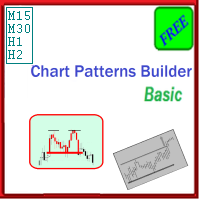
The Chart Patterns Builder Basic expert advisor is a new addition to the automated trading strategies product family, which already contains the Price Action Builder Basic and the Bollinger Bands Builder Basic . While sharing general functionality with the other experts, this expert relies on the detection of some well-known trading chart patterns for identifying its buy/sell signals.
Technical details:
The following chart patterns are currently supported:
- double top and double bottom patter
FREE

Overview
This Expert Advisor (EA) for MetaTrader 5 is a robust tool designed to optimize money and risk management. It allows users to calculate position sizes based on account balance, desired risk percentage, and trade parameters like stop loss and entry points. Additionally, it offers a clear view of reward-to-risk ratios and allows for the inclusion of broker commission, recalculating data accordingly.
Key Features
1. Risk-Based Position Sizing
The EA calculates position sizes by taking
FREE

This Program will not execute any trades!
Works on any chart and any time frame!
This is the MT5 version.
MT4 version: https://www.mql5.com/en/market/product/125496?source=Site+Market+My+Products+Page#description
This Program will produce a comment box at the top left of the chart and show you your equity % difference throughout the day. Updating constantly in real time.
The daily resets back to zero on open of a new market open day. Using new current equity at start of day as reference for
FREE

# Indicador MultiZigZag Pro para MetaTrader 5
O MultiZigZag Pro é um poderoso indicador técnico para a plataforma MetaTrader 5 que identifica, de forma inteligente e flexível, os principais pontos de inflexão e tendências nos gráficos de preços.
## Características principais: - Algoritmo avançado que filtra ruídos e movimentos irrelevantes do mercado - Múltiplos timeframes para análise de tendências de curto a longo prazo - Parâmetros de profundidade e desvio personalizáveis para adaptação a

Functionalities - Open an order After closing the candlestick - Open buy and sell orders simultaneously - Customizable break-even AND TP SL - Implements Martingale and Hedging features
Recommendations - Currency pairs: Major currency pairs - Currency pairs recommend : EURUSD - Not recommended : XAUUSD - Timeframe: 5M / 15M / 1H - Minimum deposit: $2000 per currency pair *Recommend $10000 - Leverage: Minimum 1:100, recommended 1:500 - Account type: ECN, Raw, or Razor with very low spreads. - U

# Indicador MultiZigZag Pro para MetaTrader 5
O MultiZigZag Pro é um poderoso indicador técnico para a plataforma MetaTrader 5 que identifica, de forma inteligente e flexível, os principais pontos de inflexão e tendências nos gráficos de preços.
## Características principais: - Algoritmo avançado que filtra ruídos e movimentos irrelevantes do mercado - Múltiplos timeframes para análise de tendências de curto a longo prazo - Parâmetros de profundidade e desvio personalizáveis para adaptação a

This Program will not execute any trades!
Works on any chart and any time frame!
This is the MT5 version.
MT4 version : https://www.mql5.com/en/market/product/125500?source=Site+Market+My+Products+Page#description
This EA will produce a comment box at the top left of the chart and show you your equity % difference throughout the day, week, month and year. Updating constantly in real time.
The daily resets back to zero on open of a new market open day.
The weekly resests back to zero at open

GOLD SAFE LOTS V 1.1 is an Expert Advisor designed specifically for trading gold. The operation is based on opening orders using the GOLD SAFE LOTS indicator, thus the EA works according to the "Trend Follow" strategy, which means following the trend.
TIME FRAME 15 MINUTES
EACH LOT HAS STOP LOSS AND TAKE PROFIT YOU CAN CHANGE LOT SIZE FROM THE PARAMETERS Stop Loss and Take Profit
Different Entry and Exit conditions
No Martingale or Grid Systems
NO NEED TO DO ANY SETTINGS ON THE

Hey there! If you are using Moving Average indicator into RSI indicator's window and always wondering if there could be a way to get alerts on your smartphone when those two indicators get a crossover that would be great, right!? Then you have found the right tool for that. This indicator is nothing but a mix of MA indicator and RSI indicator into one indicator window as well as it will give you alerts for crossovers on your smartphone app, email and also on your trading terminal's (desktop) cha
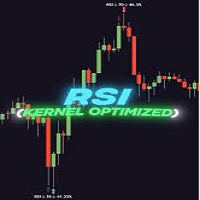
GENERAL OVERVIEW
Introducing our new KDE Optimized RSI Indicator! This indicator adds a new aspect to the well-known RSI indicator, with the help of the KDE (Kernel Density Estimation) algorithm, estimates the probability of a candlestick will be a pivot or not. For more information about the process, please check the "HOW DOES IT WORK ?" section. Features of the new KDE Optimized RSI Indicator :
A New Approach To Pivot Detection
Customizable KDE Algorithm
Realtime RSI & KDE Dashboard
Alert
OVERVIEW
A Lorentzian Distance Classifier (LDC) is a Machine Learning classification algorithm capable of categorizing historical data from a multi-dimensional feature space. This indicator demonstrates how Lorentzian Classification can also be used to predict the direction of future price movements when used as the distance metric for a novel implementation of an Approximate Nearest Neighbors (ANN) algorithm. This indicator provide signal as buffer, so very easy for create EA from this indi
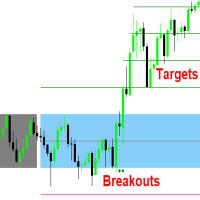
This indicator measures and displays the price range created from the first period within a new trading session, along with price breakouts from that range and targets associated with the range width. The Opening Range can be a powerful tool for making a clear distinction between ranging and trending trading days. Using a rigid structure for drawing a range, provides a consistent basis to make judgments and comparisons that will better assist the user in determining a hypothesis for the day's pr
Il MetaTrader Market è un negozio online unico di robot di trading e indicatori tecnici.
Leggi il promemoria utente di MQL5.community per saperne di più sui servizi unici che offriamo ai trader: copia dei segnali di trading, applicazioni personalizzate sviluppate da freelance, pagamenti automatici tramite il Sistema di Pagamento e il MQL5 Cloud Network.
Ti stai perdendo delle opportunità di trading:
- App di trading gratuite
- Oltre 8.000 segnali per il copy trading
- Notizie economiche per esplorare i mercati finanziari
Registrazione
Accedi
Se non hai un account, registrati
Consenti l'uso dei cookie per accedere al sito MQL5.com.
Abilita le impostazioni necessarie nel browser, altrimenti non sarà possibile accedere.