 MetaTrader 5
 Sistemi Esperti
 Indicatori
 Script
 Librerie
 Archiviazione
Unisciti alla nostra fan page

MeanReversion: Ornstein-Uhlenbeck fit and optimal trading bands - libreria per MetaTrader 5

- Prop Risk Guard: limiti di perdita giornaliera e drawdown per conti di prop firm
- TradeMirror: copiatore locale di operazioni tra conti MT5
- Visualizzazioni:
- 114
- Valutazioni:
- Pubblicato:
-
 Ti stai perdendo delle opportunità di trading:
- App di trading gratuite
- Oltre 8.000 segnali per il copy trading
- Notizie economiche per esplorare i mercati finanziari
Registrazione AccediAccetti la politica del sito e le condizioni d’uso
Se non hai un account, registrati -
 Hai bisogno di un robot o indicatore basato su questo codice? Ordinalo su Freelance
Vai a Freelance
MeanReversion.mqh models a spread that comes back to its mean (the residual of a cointegrated pair, a basis, a z-score) as an Ornstein-Uhlenbeck process, and finds where to enter and exit. The fit is the exact maximum likelihood on equally spaced bars, with standard errors, half-life and long-run standard deviation. The trading levels are those of Bertram (2010): for a given cost per round trip, the entry and exit that give the highest expected return per unit of time, with the expected time of a trade cycle. No DLL.
Usage
#include <MeanReversion\MeanReversion.mqh>

vector spread;                             // for example log(y) - beta log(x), in %
// ... fill spread ...
COrnsteinUhlenbeck ou;
if(ou.Fit(spread))                         // exact maximum likelihood, one bar = 1
  {
   double half = ou.HalfLife();            // bars
   double z = ou.ZScore(spread[spread.Size() - 1]);
   double a, m, rate;
   ou.OptimalSymmetric(0.05, a, m, rate);  // cost 0.05 per round trip: enter at mean + a, exit at mean + m
   double bars = ou.ExpectedCycle(a, m);   // expected bars from one entry to the next
  }
What is in it
- Fit(x, dt): kappa (speed of return), theta (mean), sigma, from the exact transition density of the process (it is a regression of each value on the one before, read in the right units); standard errors from the Hessian of the exact likelihood. LogLikelihoodAt() evaluates it for any parameters.
- ExpectedCycle(a, m): expected time from the entry level a to the exit level m and back to a, pi / kappa (erfi(m sqrt(kappa) / sigma) - erfi(a sqrt(kappa) / sigma)), levels measured from the mean.
- ReturnPerTime(a, m, c) = (m - a - c) / ExpectedCycle(a, m); OptimalSymmetric(c) maximizes it with m = -a, Optimal(c) without that constraint (the optimum is symmetric, as Bertram shows; the function lets you check it).
- Erfi: the imaginary error function, by its series.
In units of the long-run standard deviation the best levels depend only on the cost: with no cost, trade at the mean; a cost of 0.1 sd gives levels at about +/-0.54 sd, 0.5 sd at +/-0.96 sd, 1 sd at +/-1.26 sd.
Example
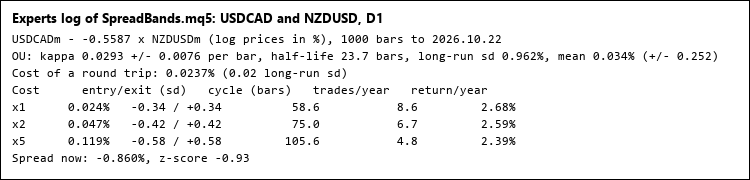
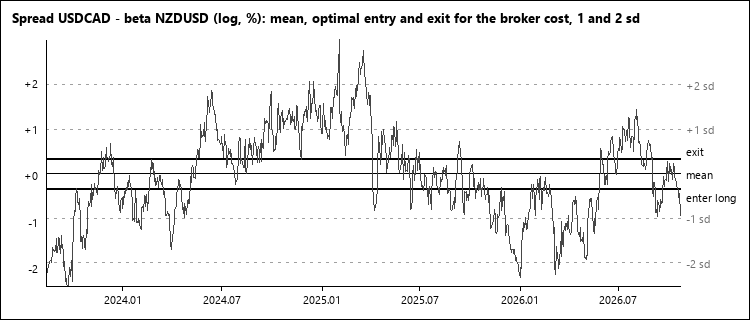
The script SpreadBands.mq5 builds the spread of two symbols (log prices, hedge ratio by least squares), fits the process, takes the cost of a round trip from the bid-ask spreads of both legs (plus a commission you set), and prints the optimal levels, the expected number of trades and return per year for 1, 2 and 5 times that cost, and the z-score now (picture 1). It can write the spread and the levels to a CSV file (picture 2).
Checked
- the fit on 3 simulated processes (one with dt = 1/252) and a real spread against scipy maximizing the exact likelihood: parameters within 4e-7, the same likelihood, standard errors within 1e-5 of a numerical Hessian (statsmodels);
- erfi against scipy on [-6, 6]: within 8e-16; cycle lengths within 1e-15; optimal levels against scipy's bounded search within 5e-8 sd, the free optimum within 3e-8 sd;
- the cycle formula itself against a simulation of the process (60 million steps, about 5 000 and 1 800 cycles): within 2.2% and 0.9%, the size of the simulation error.
Files
MeanReversion.mqh goes to MQL5\Include\MeanReversion, SpreadBands.mq5 to MQL5\Scripts\MeanReversion.
 Trade Excursion Report - MAE and MFE of your closed trades (script)
For every closed position the script measures how far the price went against it (MAE) and in its favour (MFE), and shows what that says about your stops and exits. Table, summary on the chart and a CSV file. Read-only, it never trades.
 Spread Heatmap - typical spread for every hour and weekday, in server time or New York time
A table on the chart: the typical spread of the symbol for every hour and weekday, read from the history of your broker. Green is cheap, red is expensive. Hours in server time, UTC or a city with the right summer time. Read-only.
ChangePoint: Bayesian online change point detection
Online detection of changes in the mean or volatility (Adams-MacKay): probability of a change in the last k bars, current segment length, forecast, and an indicator.
Copula: Gaussian, Student t, Clayton, Gumbel and Frank copulas with tail dependence
Fits five bivariate copulas on ranks, with Kendall's tau, tail dependence, the probability of joint extreme days, AIC and the conditional probabilities of pairs trading.