 MetaTrader 5
 Sistemi Esperti
 Indicatori
 Script
 Librerie
 Archiviazione
Unisciti alla nostra fan page

ChangePoint: Bayesian online change point detection - libreria per MetaTrader 5

- Prop Risk Guard: limiti di perdita giornaliera e drawdown per conti di prop firm
- TradeMirror: copiatore locale di operazioni tra conti MT5
- Visualizzazioni:
- 134
- Pubblicato:
-
 Ti stai perdendo delle opportunità di trading:
- App di trading gratuite
- Oltre 8.000 segnali per il copy trading
- Notizie economiche per esplorare i mercati finanziari
Registrazione AccediAccetti la politica del sito e le condizioni d’uso
Se non hai un account, registrati -
 Hai bisogno di un robot o indicatore basato su questo codice? Ordinalo su Freelance
Vai a Freelance
ChangePoint.mqh detects changes in the mean or the volatility of a series as they happen, with the Bayesian online change point detection of Adams and MacKay (2007). The series is seen as segments, each with its own mean and variance, and a new segment can start at any bar. After each value the class gives the probability of every run length (the bars since the last change), so the probability that a change happened in the last k bars, the most likely start of the current segment, and the forecast of the next value. It works bar by bar (Update), so an Expert Advisor or an indicator can call it on each new bar. No DLL.
Usage
#include <ChangePoint\ChangePoint.mqh>

CChangePoint cp;
cp.Prior(0.0, 0.1, 2.0, 1.0);              // segment mean around 0, variance around 1 (beta / (alpha - 1))
cp.Hazard(250.0, 1e-12);                   // a change every 250 bars on average; drop run lengths below 1e-12
// at each new closed bar:
double ret = 0.0;                          // for example 100 * log(close[1] / close[2])
cp.Update(ret);
double p = cp.ChangeWithin(10);            // probability that the current segment is younger than 10 bars
int run = cp.MostLikelyRun();              // bars since the most likely last change
double next = cp.PredictiveStd();          // standard deviation of the next value
How it works
- Each segment has a normal-inverse-gamma prior on its mean and variance, so the forecast of a value given a run length is a Student t, and the posterior of each run length is updated in closed form.
- At each bar every run length grows by one, with probability 1 - 1/lambda, or a new segment starts; the run length probabilities are normalized by the forecast density of the value.
- The exact recursion keeps every run length (the work grows with the bars); Hazard(lambda, prune) drops the run lengths whose probability falls below prune: with 1e-12 the results move by less than 1e-6 and the work stays small.
- Also: ExpectedRun(), RunLength(r), PredictiveMean(), LogLikelihood() of the data (to compare priors or lambdas), and SegmentLogLikelihood() of any segment.
Examples
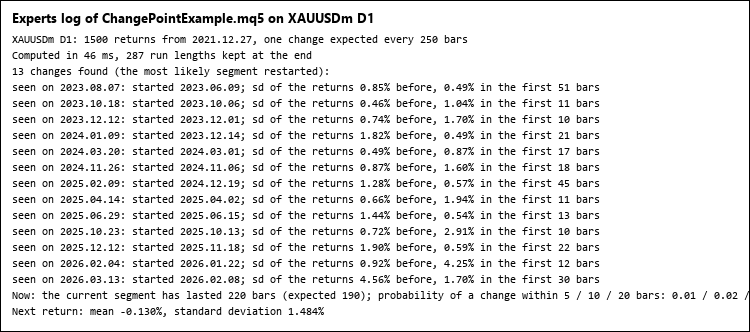
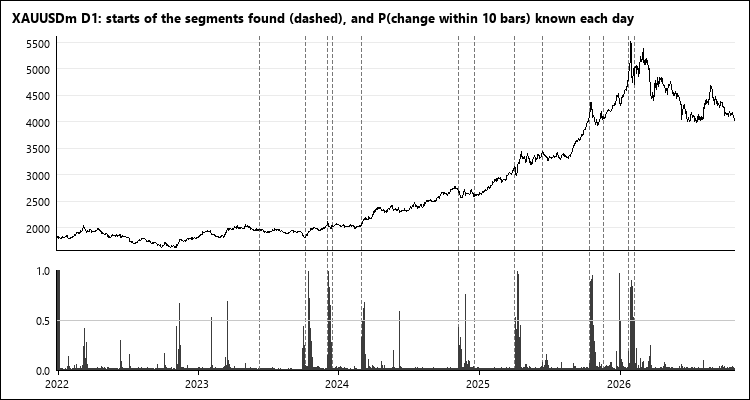
The indicator ChangePointProbability.mq5 draws, in a separate window, the probability of a change within the last k bars, computed once per closed bar from the returns up to that bar. The script ChangePointExample.mq5 runs the detector on the returns of a symbol and lists the changes it found (a change is reported once the new segment has lasted a few bars), with the volatility before and after, and the state now (picture 1). On gold D1 it finds the jump of volatility of April 2025 and the swings of early 2026 (picture 2).
Checked
- on a series of 9 values, after each value, the whole run length distribution and the likelihood against the enumeration of every segmentation (up to 512) with the closed-form likelihood of each segment: within 9e-16;
- on a simulated series of 3 segments (600 values) and on 2 454 daily returns of BTCUSDT, against an independent Python version computed in logarithms: the same most likely run length at every bar, every other output within 3e-13. On the simulated series the changes at 200 and 350 were found at 205 and 351;
- 2 454 values take 0.2 s exact, 0.09 s with pruning at 1e-12.
Files
ChangePoint.mqh goes to MQL5\Include\ChangePoint, ChangePointExample.mq5 to MQL5\Scripts\ChangePoint, ChangePointProbability.mq5 to MQL5\Indicators\ChangePoint.
MeanReversion: Ornstein-Uhlenbeck fit and optimal trading bands
Exact maximum likelihood of an Ornstein-Uhlenbeck spread and Bertram's optimal entry and exit levels for a given cost, with the expected length of a trade cycle.
 Trade Excursion Report - MAE and MFE of your closed trades (script)
For every closed position the script measures how far the price went against it (MAE) and in its favour (MFE), and shows what that says about your stops and exits. Table, summary on the chart and a CSV file. Read-only, it never trades.
Copula: Gaussian, Student t, Clayton, Gumbel and Frank copulas with tail dependence
Fits five bivariate copulas on ranks, with Kendall's tau, tail dependence, the probability of joint extreme days, AIC and the conditional probabilities of pairs trading.
 Supply Demand Zones
Supply and demand zones for Gold (XAUUSD), EURUSD and any symbol: zones from swing highs and lows sized by ATR, fresh or tested, merged, broken ones removed, alerts and 5 buffers for EAs. Open source code.