 MetaTrader 5
 Sistemi Esperti
 Indicatori
 Script
 Librerie
 Archiviazione
Unisciti alla nostra fan page

Donchian Breakout channel with arrows - indicatore per MetaTrader 5

- Visualizzazioni:
- 8
- Pubblicato:
-
 Ti stai perdendo delle opportunità di trading:
- App di trading gratuite
- Oltre 8.000 segnali per il copy trading
- Notizie economiche per esplorare i mercati finanziari
Registrazione AccediAccetti la politica del sito e le condizioni d’uso
Se non hai un account, registrati -
 Hai bisogno di un robot o indicatore basato su questo codice? Ordinalo su Freelance
Vai a Freelance
Hai bisogno di un robot o indicatore basato su questo codice? Ordinalo su Freelance
Vai a Freelance

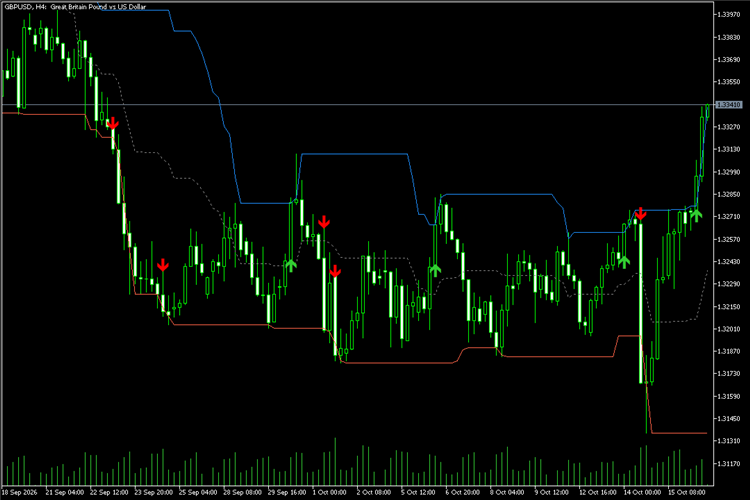
DonchianBreakout draws the highest high and the lowest low of the previous N bars (the current bar is not included) and their midline. An arrow appears when a candle closes outside the channel for the first time.
What it draws:
- Upper and lower channel lines and the dotted midline
- A green arrow when a closed candle breaks above the channel
- A red arrow when a closed candle breaks below the channel
Inputs: channel length, popup alert, bars to calculate.
Notes:
- Arrows are drawn only on closed candles, so they do not repaint
- Works on any symbol and timeframe. Breakout channels suit trending markets such as commodities and crypto
- It is an information tool, not a trading system: it does not promise any profit. Test it on history and on a demo account before relying on it
How to use: copy DonchianBreakout.mq5 into MQL5\Indicators (File - Open Data Folder), compile it in MetaEditor and drag it onto a chart.
Squeeze Momentum - Bollinger Bands inside Keltner Channels
Volatility squeeze dots with a linear regression momentum histogram, in a separate window.
Energy Report Marker - EIA crude oil and gas storage releases
Marks the weekly EIA crude oil and natural gas storage releases and the range that follows.
Auto Fib Swing - Fibonacci levels on the last swing
Detects the last confirmed swing leg and draws its Fibonacci retracement and extension levels.
Relative Volume - intraday volume against the same time of day
Tick volume of each bar divided by its average at the same time of day over the last days.