 MetaTrader 5
 Sistemi Esperti
 Indicatori
 Script
 Librerie
 Archiviazione
Unisciti alla nostra fan page

Daily Pivot Points - Classic, Fibonacci and Camarilla - indicatore per MetaTrader 5

- Visualizzazioni:
- 18
- Pubblicato:
-
 Ti stai perdendo delle opportunità di trading:
- App di trading gratuite
- Oltre 8.000 segnali per il copy trading
- Notizie economiche per esplorare i mercati finanziari
Registrazione AccediAccetti la politica del sito e le condizioni d’uso
Se non hai un account, registrati -
 Hai bisogno di un robot o indicatore basato su questo codice? Ordinalo su Freelance
Vai a Freelance
Hai bisogno di un robot o indicatore basato su questo codice? Ordinalo su Freelance
Vai a Freelance

PivotPoints draws the daily pivot point and three levels of resistance and support, calculated from the high, low and close of the previous day. Pivot levels are a classic reference for intraday traders because many market participants watch the same prices.
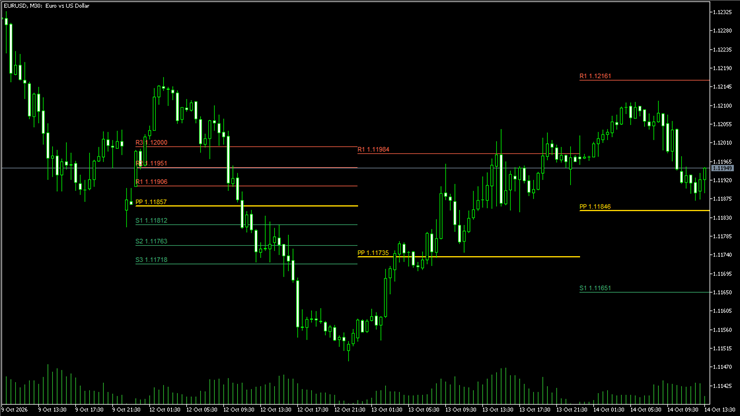
What it draws:
- PP: the pivot point (gold)
- R1, R2, R3: resistances (red)
- S1, S2, S3: supports (green)
- The levels of the last days, each one valid for its own day
Formulas available:
- Classic: PP = (High + Low + Close) / 3, R1 = 2 x PP - Low, S1 = 2 x PP - High, R2/S2 = PP +/- range, R3/S3 extended
- Fibonacci: PP plus and minus 0.382, 0.618 and 1.000 of the previous day range
- Camarilla: close plus and minus 1.1 x range / 12, / 6 and / 4
Inputs:
- Formula, number of days to draw
- Text labels on/off, colour of pivot, resistances and supports
Notes:
- Works on any symbol and any timeframe, the levels come from the daily candles
- Levels of the day are fixed at the open of the day and do not repaint
- It is an information tool, not a trading system: it does not promise any profit
How to use:
1. Copy PivotPoints.mq5 into the MQL5\Indicators folder of your terminal (File - Open Data Folder) and compile it in MetaEditor.
2. Drag PivotPoints from the Navigator window onto a chart.
3. Choose the formula you prefer in the inputs tab.
Tips:
- Watch how price reacts when it reaches PP, R1 or S1 before looking at the outer levels.
- Combine the pivots with the previous day high and low to find areas where several levels meet.
Daily VWAP with standard deviation bands
Volume weighted average price that restarts every day, with 1 and 2 standard deviation bands.
NY Opening Range - 15:30 breakout levels for stock indices
Draws the first-15-minute range of the US cash open on stock indices with extensions, R targets and the first breakout arrow.
Round Numbers - automatic psychological levels
Horizontal lines on round numbers around the visible price, with a step that adapts to the zoom.
 USDX Trader EA - Trade the US Dollar Index even if your broker does not include the USDX among their symbols.
USDX Trader v1.33 — Synthetic Dollar Index chart and basket trading for MetaTrader 5 Version 1.33 · MetaTrader 5 · Any broker that offers the major USD pairs