 MetaTrader 5
 Sistemi Esperti
 Indicatori
 Script
 Librerie
 Archiviazione
Unisciti alla nostra fan page

NY Opening Range - 15:30 breakout levels for stock indices - indicatore per MetaTrader 5

- Visualizzazioni:
- 16
- Pubblicato:
-
 Ti stai perdendo delle opportunità di trading:
- App di trading gratuite
- Oltre 8.000 segnali per il copy trading
- Notizie economiche per esplorare i mercati finanziari
Registrazione AccediAccetti la politica del sito e le condizioni d’uso
Se non hai un account, registrati -
 Hai bisogno di un robot o indicatore basato su questo codice? Ordinalo su Freelance
Vai a Freelance
Hai bisogno di un robot o indicatore basato su questo codice? Ordinalo su Freelance
Vai a Freelance

NYOpeningRange draws the opening range of the US cash session on stock index CFDs such as Nasdaq 100, S&P 500 or Dow Jones. By default the range is made of the first 15 minutes after the 9:30 New York open, which is 15:30 on a broker server running on European time.
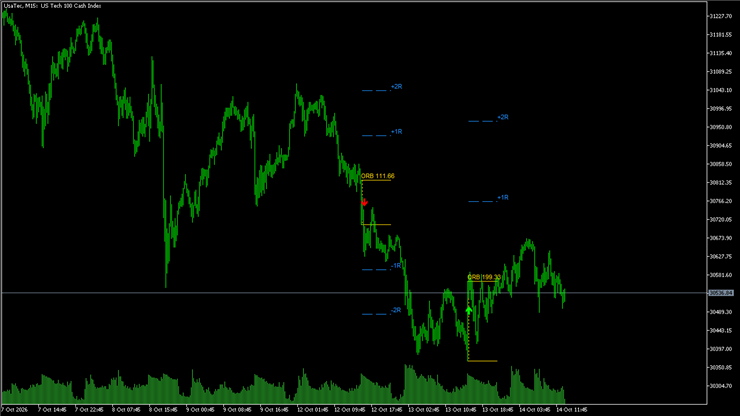
What it draws:
- A box with the high and low of the opening range and its size in price points
- High and low of the range extended to the end of the session
- Targets at 1R and 2R above and below the range, where R is the height of the range
- A green arrow when a candle closes above the range and a red arrow when it closes below it (only the first breakout of each day)
Inputs:
- Number of days to draw
- Auto DST: the open follows the US and EU daylight saving changes, or a manual open time
- Length of the range, length of the session, last time for a breakout arrow
- Number of R targets, arrows and labels on/off, colours
Notes:
- Made for the M1 to M15 timeframes, M5 is a good choice
- It needs M1 history to build the range
- Auto DST assumes that the broker server follows European time (CET/CEST). With another server time switch it off and enter the open time by hand
- Arrows use closed candles and do not repaint
- It is an information tool, not a trading system: it does not promise any profit. Test it on history and on a demo account before relying on it
How to use:
1. Copy NYOpeningRange.mq5 into the MQL5\Indicators folder of your terminal (File - Open Data Folder) and compile it in MetaEditor.
2. Drag NYOpeningRange from the Navigator window onto an index chart (M5 suggested).
3. If your server does not follow European time, disable Auto DST and set the open hour and minute.
Tips:
- The width of the range gives a quick idea of how volatile the open is compared with previous days.
- The extended high and low are common reference levels for the rest of the session.
GDS Renko Canvas
GDS Renko Canvas è un indicatore didattico compatto che mostra come un classico grafico Renko a dimensione fissa possa essere visualizzato direttamente in MetaTrader 5 utilizzando la classe standard CCanvas. L'indicatore costruisce i mattoncini Renko a partire dai tick BID in arrivo e visualizza solo i mattoncini completati. La continuazione richiede un solo blocco, mentre un'inversione segue la classica regola dei due blocchi. A differenza delle sovrapposizioni Renko basate su oggetti, il grafico visibile viene disegnato su un unico livello bitmap Canvas. Ciò mantiene ridotto l'elenco degli oggetti del grafico e semplifica il ridisegno in caso di ridimensionamento.
 GDS Renko ADX Demo EA
Un piccolo Expert Advisor didattico che mostra come l'ADX di Wilder e il Directional Movement possano essere calcolati direttamente dai mattoncini Renko classici completati. L'Expert Advisor costruisce internamente blocchi Renko di dimensioni fisse a partire dai tick BID. Non sono necessari grafici offline, simboli personalizzati, DLL o indicatori esterni. +DI, -DI e ADX vengono aggiornati solo dopo il completamento di un blocco Renko.
Daily VWAP with standard deviation bands
Volume weighted average price that restarts every day, with 1 and 2 standard deviation bands.
Daily Pivot Points - Classic, Fibonacci and Camarilla
Daily pivot point with three resistances and three supports, Classic, Fibonacci or Camarilla formulas.