 MetaTrader 5
 Sistemi Esperti
 Indicatori
 Script
 Librerie
 Archiviazione
Unisciti alla nostra fan page

Daily VWAP with standard deviation bands - indicatore per MetaTrader 5

- Visualizzazioni:
- 21
- Pubblicato:
-
 Ti stai perdendo delle opportunità di trading:
- App di trading gratuite
- Oltre 8.000 segnali per il copy trading
- Notizie economiche per esplorare i mercati finanziari
Registrazione AccediAccetti la politica del sito e le condizioni d’uso
Se non hai un account, registrati -
 Hai bisogno di un robot o indicatore basato su questo codice? Ordinalo su Freelance
Vai a Freelance
Hai bisogno di un robot o indicatore basato su questo codice? Ordinalo su Freelance
Vai a Freelance

DailyVWAP plots the volume weighted average price (VWAP) of the current day and two pairs of standard deviation bands around it. The VWAP is the average price of the day weighted by volume and is widely used as a fair value reference on stock indices, futures and CFDs.
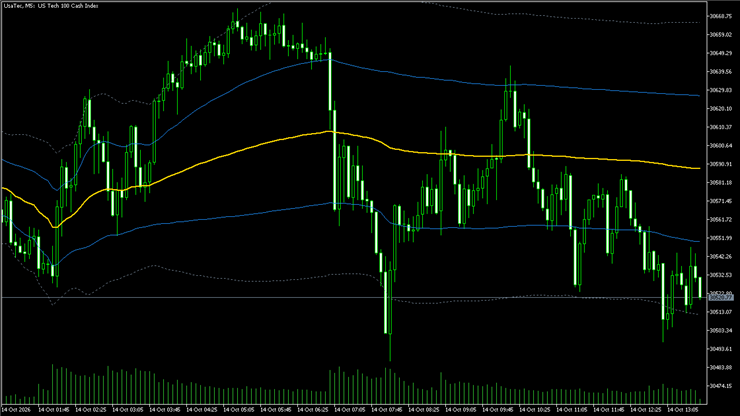
What it draws:
- VWAP: the golden line, restarted every day
- First bands: VWAP plus and minus 1 standard deviation
- Second bands: VWAP plus and minus 2 standard deviations (dotted)
Inputs:
- Hour of the day (server time) when the VWAP restarts
- Bands on/off and the multiplier of each band
- Maximum number of bars to calculate
Notes:
- Works on any symbol and any timeframe up to H4
- The calculation uses tick volume, which is the only volume available on most CFD brokers
- The line is calculated on closed and current bars and the past values do not change
- It is an information tool, not a trading system: it does not promise any profit
How to use:
1. Copy DailyVWAP.mq5 into the MQL5\Indicators folder of your terminal (File - Open Data Folder) and compile it in MetaEditor.
2. Drag DailyVWAP from the Navigator window onto a chart.
3. To restart the VWAP at the US open instead of midnight, set the reset hour to the server hour of the open (for example 15 on a European server).
Tips:
- Price far from the VWAP, beyond the second band, shows an extended move compared with the average of the day.
- Compare the slope of the VWAP with the slope of the price to see which side is in control.
NY Opening Range - 15:30 breakout levels for stock indices
Draws the first-15-minute range of the US cash open on stock indices with extensions, R targets and the first breakout arrow.
GDS Renko Canvas
GDS Renko Canvas è un indicatore didattico compatto che mostra come un classico grafico Renko a dimensione fissa possa essere visualizzato direttamente in MetaTrader 5 utilizzando la classe standard CCanvas. L'indicatore costruisce i mattoncini Renko a partire dai tick BID in arrivo e visualizza solo i mattoncini completati. La continuazione richiede un solo blocco, mentre un'inversione segue la classica regola dei due blocchi. A differenza delle sovrapposizioni Renko basate su oggetti, il grafico visibile viene disegnato su un unico livello bitmap Canvas. Ciò mantiene ridotto l'elenco degli oggetti del grafico e semplifica il ridisegno in caso di ridimensionamento.
Daily Pivot Points - Classic, Fibonacci and Camarilla
Daily pivot point with three resistances and three supports, Classic, Fibonacci or Camarilla formulas.
Round Numbers - automatic psychological levels
Horizontal lines on round numbers around the visible price, with a step that adapts to the zoom.