Unisciti alla nostra fan page
- Visualizzazioni:
- 163
- Valutazioni:
- Pubblicato:
-
Hai bisogno di un robot o indicatore basato su questo codice? Ordinalo su Freelance Vai a Freelance
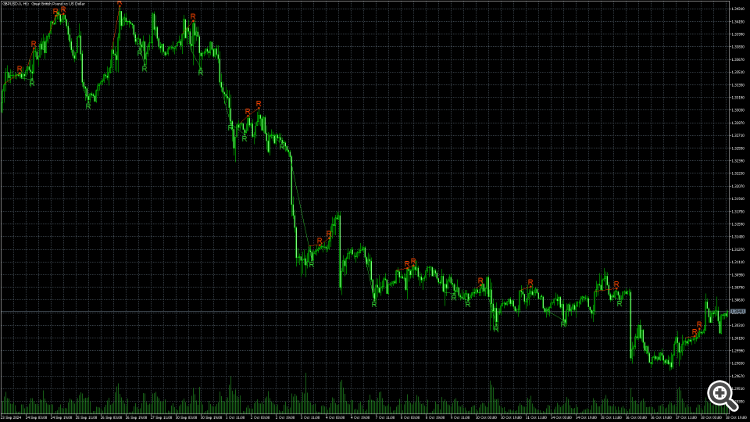
Lo scopo di questo codice è di trasmettere un'idea alle persone che cercano un approccio semplice e funzionale alla conversione di pine script in MQL5.
Ecco il codice di pine script:
//@versione=5

indicator(title='sample stochastic divergence', overlay=true)
stoch_len = input.int(title='stoch_len', defval=5)

f_top_fractal(_src) =>
    _src[4] < _src[2] and _src[3] < _src[2] and _src[2] > _src[1] and
       _src[2] > _src[0]
f_bot_fractal(_src) =>
    _src[4] > _src[2] and _src[3] > _src[2] and _src[2] < _src[1] and
       _src[2] < _src[0]
f_fractalize(_src) =>
    f_bot_fractal__1 = f_bot_fractal(_src)
    f_top_fractal(_src) ? 1 : f_bot_fractal__1 ? -1 : 0

stoch = ta.stoch(close, high, low, stoch_len)

fractal_top = f_fractalize(stoch) > 0 ? stoch[2] : na
fractal_bot = f_fractalize(stoch) < 0 ? stoch[2] : na

high_prev = ta.valuewhen(fractal_top, stoch[2], 1)
high_price = ta.valuewhen(fractal_top, high[2], 1)
low_prev = ta.valuewhen(fractal_bot, stoch[2], 1)
low_price = ta.valuewhen(fractal_bot, low[2], 1)

regular_bearish_div = fractal_top and high[2] > high_price and stoch[2] < high_prev
regular_bullish_div = fractal_bot and low[2] < low_price and stoch[2] > low_prev

plot(title='H F', series=fractal_top ? high[2] : na, color=regular_bearish_div ? color.maroon : na, offset=-2)
plot(title='L F', series=fractal_bot ? low[2] : na, color=regular_bullish_div ? color.green : na, offset=-2)
plot(title='H D', series=fractal_top ? high[2] : na, style=plot.style_circles, color=regular_bearish_div ? color.maroon  : na , linewidth=3, offset=-2)
plot(title='L D', series=fractal_bot ? low[2] : na, style=plot.style_circles, color=regular_bullish_div ? color.green : na , linewidth=3, offset=-2)

plotshape(title='+RBD', series=regular_bearish_div ? high[2] : na, text='R', style=shape.labeldown, location=location.absolute, color=color.maroon, textcolor=color.white, offset=-2)
plotshape(title='-RBD', series=regular_bullish_div ? low[2] : na, text='R', style=shape.labelup, location=location.absolute, color=color.green, textcolor=color.white, offset=-2)
Tradotto dall’inglese da MetaQuotes Ltd.
Codice originale https://www.mql5.com/en/code/52935
 Economic Calendar CSV
Questo script salva in un file CSV un insieme predefinito di eventi economici dal calendario economico integrato della MetaTrader.
 Oscillatore CG Fisher
Il Fisher CG Oscillator è un oscillatore i cui valori sono ottenuti mediante la Trasformata di Fisher inversa dei valori dell'indicatore CG Oscillator personalizzato.
 Fisher RVI
L'RVI di Fisher è un oscillatore i cui valori sono ottenuti mediante la Trasformata Inversa di Fisher dei valori dell'indicatore RVI (Relative Vigor Index).
 Colore Parabolica
SAR parabolico ergonomico. L'indicatore proposto aggiunge grandi punti colorati che appaiono a ogni cambio di tendenza, mentre l'indicatore stesso è realizzato in bicromia.
