Unisciti alla nostra fan page

3TF_RSI_Average - indicatore per MetaTrader 5
- Visualizzazioni:
- 7568
- Valutazioni:
- Pubblicato:
-
 Ti stai perdendo delle opportunità di trading:
- App di trading gratuite
- Oltre 8.000 segnali per il copy trading
- Notizie economiche per esplorare i mercati finanziari
Registrazione AccediAccetti la politica del sito e le condizioni d’uso
Se non hai un account, registrati -
 Hai bisogno di un robot o indicatore basato su questo codice? Ordinalo su Freelance
Vai a Freelance
Hai bisogno di un robot o indicatore basato su questo codice? Ordinalo su Freelance
Vai a Freelance
'Three timeframes RSI Average' displays in a separate window three Relative Strength Index indicator of the specified timeframes, as well as their average value.
It has ten input parameters:
- RSI period - RSI calculation period
- Overbought - overbought level
- Oversold - oversold level
- Drawing mode - indicator drawing type
- Steps - as a ladder
- Slope - sloping lines
- First RSI timeframe - the timeframe of the first RSI
- Second RSI timeframe - the timeframe of the second RSI
- Third RSI timeframe - the timeframe of the third RSI
- Show first RSI - show the first RSI indicator
- Show second RSI - show the second RSI indicator
- Show third RSI - show the third RSI indicator
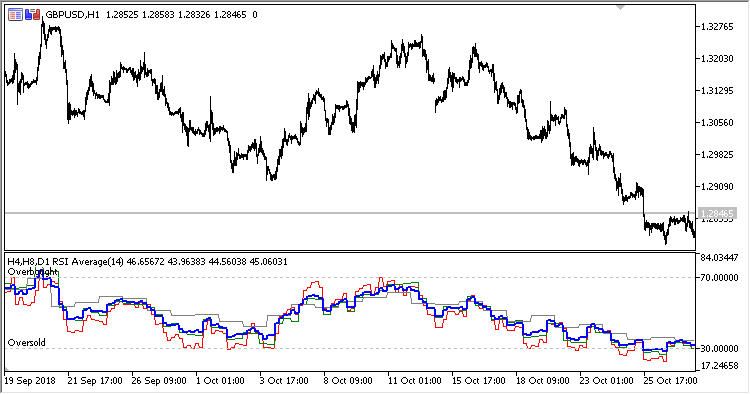
Fig.1. Three timeframes RSI Average, H4, H8 and D1 data on the H1 chart, Drawing mode = Steps
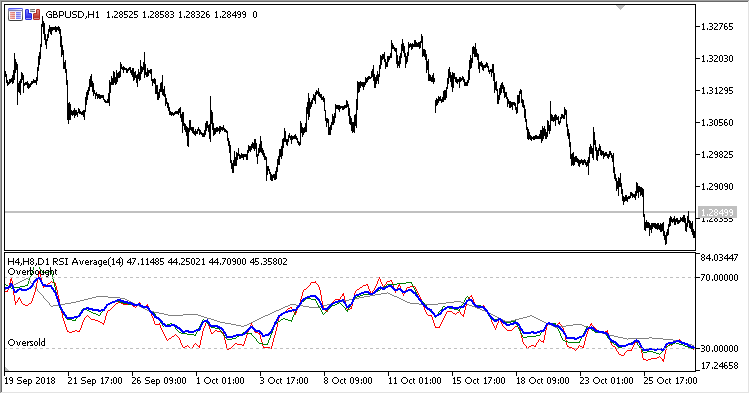
Fig. 2. Three timeframes RSI Average, H4, H8 and D1 data on the H1 chart, Drawing mode = Slope
Tradotto dal russo da MetaQuotes Ltd.
Codice originale https://www.mql5.com/ru/code/23317
3TF_Stochastic_Average
The Three timeframes Stochastic Average indicator
Tymen_STARC_Bands
The Tymen STARC Bands indicator
 Dynamic averaging
The EA implements averaging of positions. The average iStdDev is calculated in a sliding window.
ColorRSI_X20_Cloud_HTF
The ColorRSI_X20_Cloud indicator with the possibility to change the indicator timeframe using input parameters