 MetaTrader 5
 Sistemi Esperti
 Indicatori
 Script
 Librerie
 Archiviazione
Guarda come scaricare robot di trading gratuitamente
Ci trovi su Facebook!
Unisciti alla nostra fan page
Unisciti alla nostra fan page
Ti è piaciuto lo script? Provalo nel Terminale MetaTrader 5

LBR_Paint_Bars - indicatore per MetaTrader 5

- Visualizzazioni:
- 8077
- Valutazioni:
- Pubblicato:
- Aggiornato:
-
 Ti stai perdendo delle opportunità di trading:
- App di trading gratuite
- Oltre 8.000 segnali per il copy trading
- Notizie economiche per esplorare i mercati finanziari
Registrazione AccediAccetti la politica del sito e le condizioni d’uso
Se non hai un account, registrati -
 Hai bisogno di un robot o indicatore basato su questo codice? Ordinalo su Freelance
Vai a Freelance
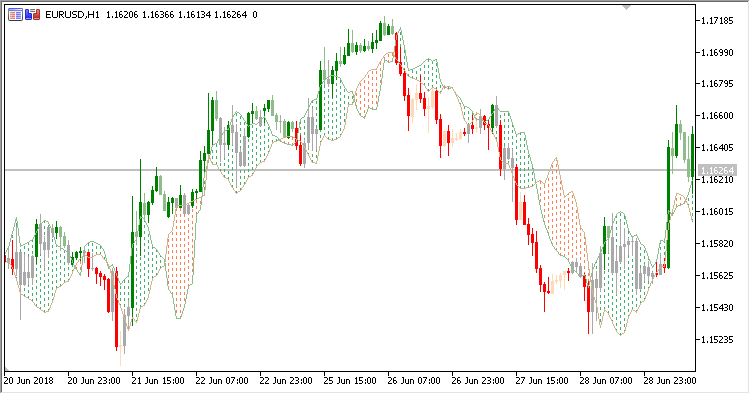
LBR Paint Bars indicator draws color candles depending on a trend direction. The trend is defined by the location of two volatility lines. A color cloud histogram is displayed along these two lines.
It has four inputs:
- Factor - ATR share in the cloud width calculation
- ATR period - ATR calculation period
- HL period - cloud borders calculation period
- Color Candles - display color candles (Yes/No)
Calculation:
Edge1 = Min(Lowest(Low, HL period) + Delta;
Edge2 = Max(Highest(High, HL period) - Delta;
where:
Delta = ATR(ATR period) * Factor
If color candles display is enabled (Color Candles = Yes):
- if the bullish candle is closed above the cloud, a green candle is displayed
- if the bearish candle is closed above the cloud, a light-green candle is displayed
- if the bearish candle is closed below the cloud, a red candle is displayed
- if the bullish candle is closed below the cloud, an orange candle is displayed
Tradotto dal russo da MetaQuotes Ltd.
Codice originale https://www.mql5.com/ru/code/22200
Rahul_Mohindar_Osc
Rahul Mohindar oscillator
Standard_Deviation_Moving_Average_Ratio
Standard Deviations/Moving Average Ratio indicator
Hurst_Oscillator
Hurst oscillator indicator
XHullTrend_Digit_System
The indicator implements a breakout system using the XHullTrend_Digit indicator cloud