TickCounter
- Indicateurs
-
Evgeniy Zhdan
 ➖➖➖➖➖➖➖➖➖➖➖➖➖➖➖➖➖➖➖➖➖➖
Products: https://www.mql5.com/en/users/trendhunter/seller
➖➖➖➖➖➖➖➖➖➖➖➖➖➖➖➖➖➖➖➖➖➖ - Version: 1.0
- Activations: 5
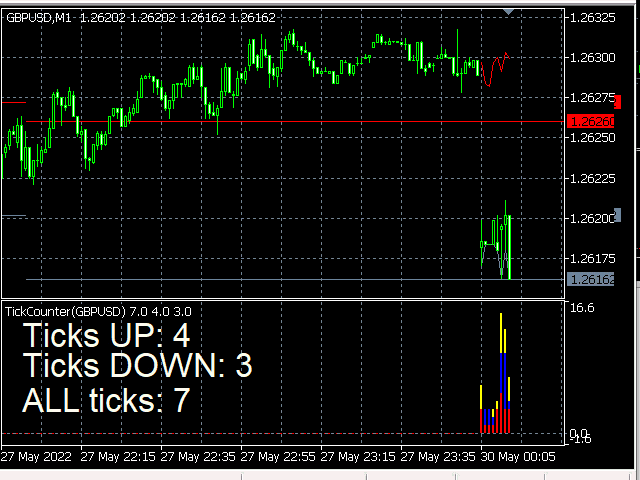
L'indicateur TickCounter compte les ticks de haut en bas sur chaque nouvelle barre.
Le calcul commence à partir du moment où l'indicateur est placé sur le graphique.
Les barres d'histogramme représentent :
- Barres jaunes - nombre total de ticks ;
- Barres bleues - ticks UP ;
- Barres rouges - coches vers le BAS.
Si la barre bleue n'est pas visible, il y a plus de graduations vers le bas et la barre rouge s'affiche au-dessus de la bleue (la couche rouge est au-dessus de la bleue).
MT5 version: https://www.mql5.com/en/market/product/82625
Chaque réinitialisation de l'indicateur provoque la remise à zéro des buffers et le comptage des ticks recommence depuis le début. Par conséquent, vous ne devez pas modifier inutilement la période du graphique et modifier les paramètres de l'indicateur.
L'EA utilise des tampons et les données des indicateurs peuvent être utilisées dans l'EA.