BeST RevEngEmaRsi Strategy MT5
- Indicateurs
- Version: 1.20
- Mise à jour: 21 octobre 2020
- Activations: 10

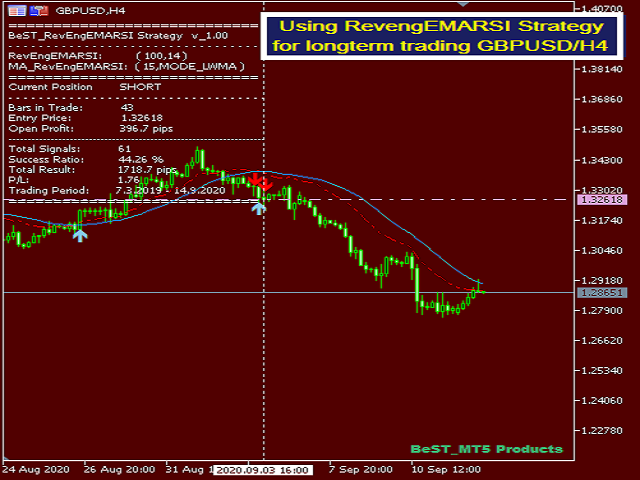
BeST_RevEngEMARSI Strategy is an MT5 Indicator that is based on the indicator RevEngEMARSI by Giorgos Siligardos that was presented in his article "Reverse Engineering RSI (II)" (TASC_Aug 2003) as a new variation of his inverse-RSI indicator and which transforms the Exponential moving average of RSI into a curve in the price graph, simplifying the price projection method and improving its visual representation.
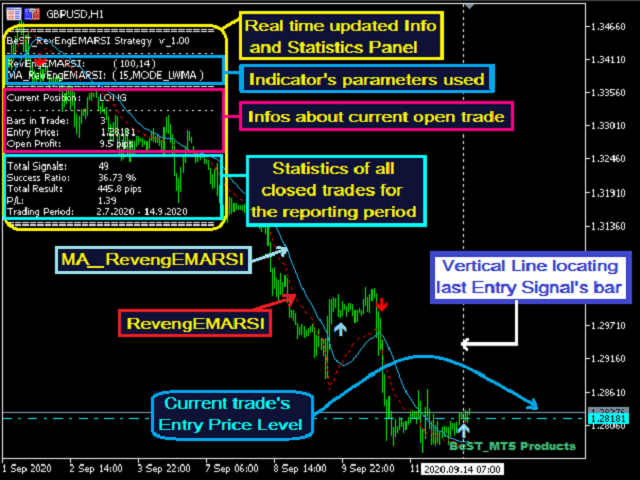
BeST_RevEngEMARSI Strategy while implementing the crossings with its Moving Average produces a complete and standalone trading system of impressive results.
The Indicator comes with a new enhanced Real Time Updated Info and Statistics Panel that can improve its overall performance.
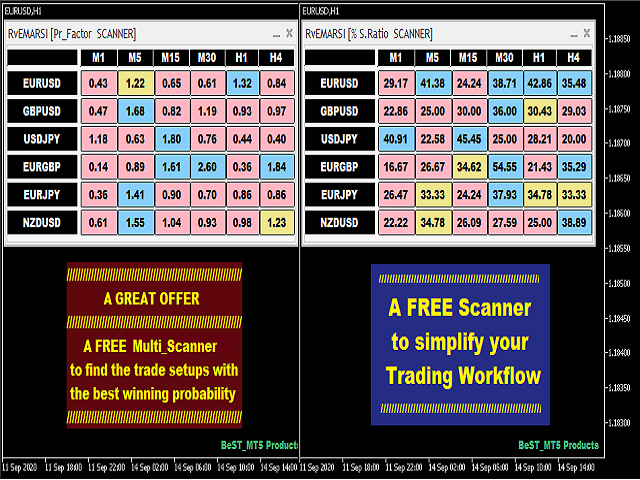
You can Maximize its potentiality by using our FREE OFFER for everyone who purchased the product that is a very useful Multi-Scanner Indicator displaying
% Success Ratio and Profit Factor (P/L) in order to find the most promising trading setups (Symbols and Timeframes).
% Success Ratio and Profit Factor (P/L) in order to find the most promising trading setups (Symbols and Timeframes).
BeST_RevEngEMARSI Strategy Indicator
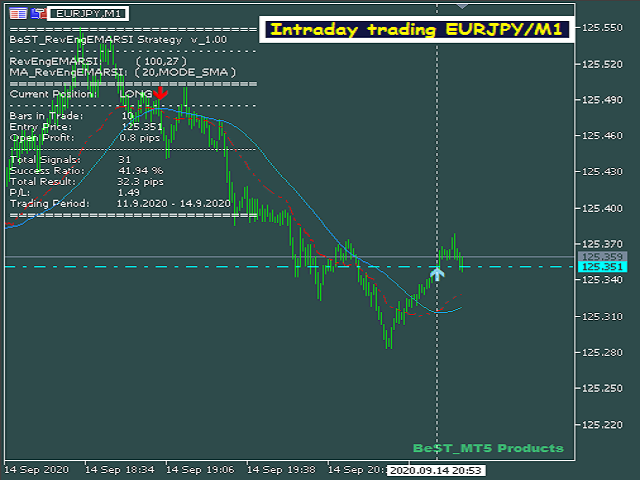
- Draws definite Buy and Sell Arrows after each valid cross of RevEngEMARSI and its MA
- Draws always only after the bar closing and so is non-repainting and non- backpainting
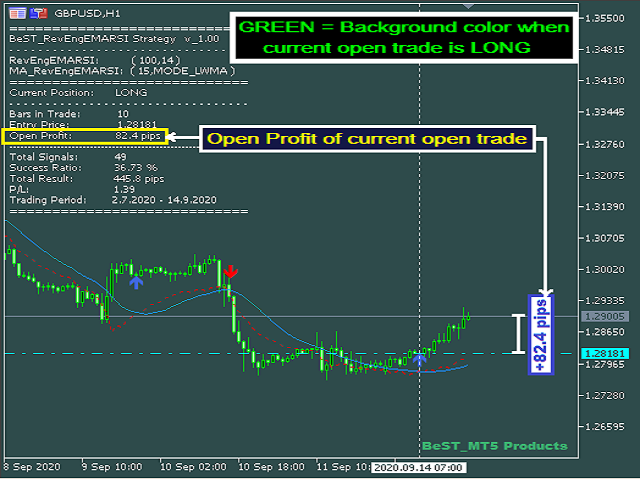
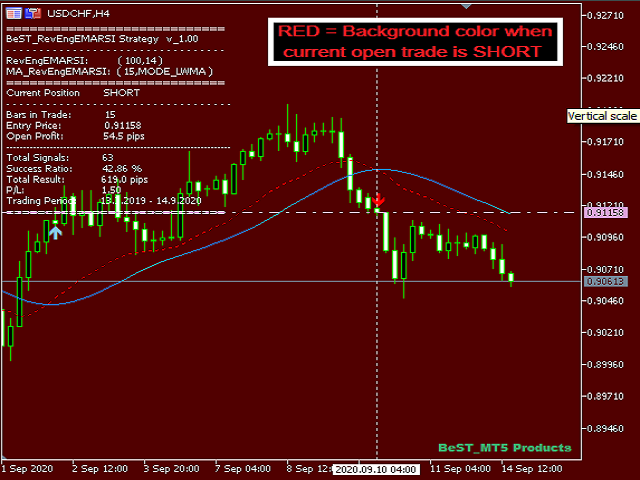
- Displays a real-time updated Info and Statistics Panel
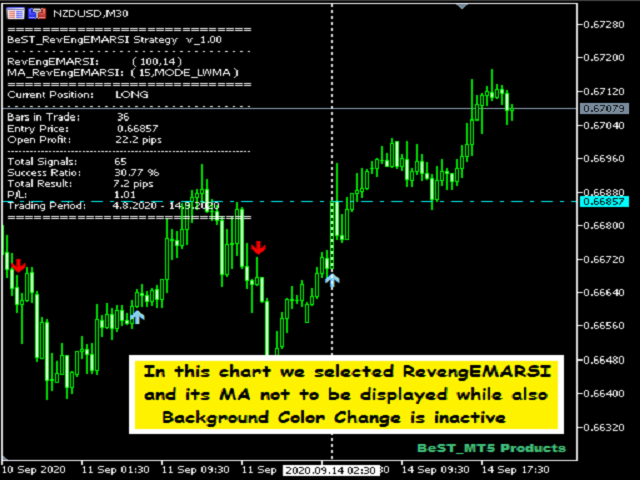
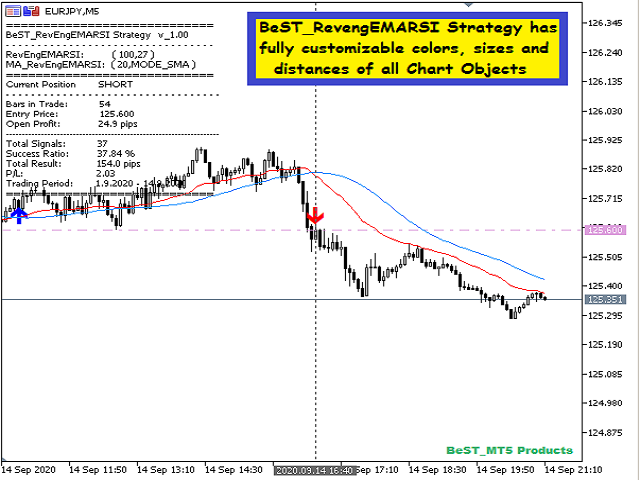
- Has fully customizable colors, sizes & distances of all Chart objects
- Implements all MT5 Alerts for the Entry Signals
Inputs
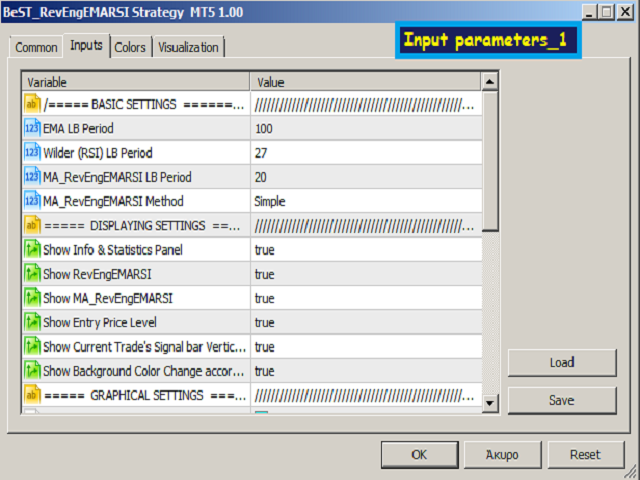
Basic Settings
- EMA LB Period
- Wilder (RSI) LB Period
- MA_RevEngEMARSI LB Period
- MA_RevEngEMARSI Method
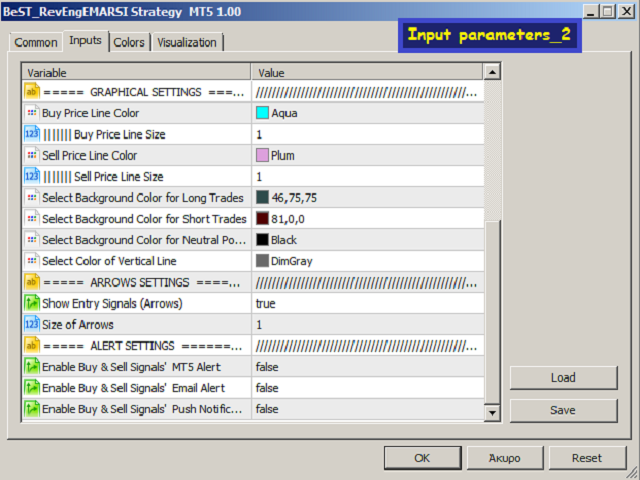
- Line features of RevengEMARSI – Style, Width, Color
- Line features of MA_RevengEMARSI – Style, Width, Color
Displaying Settings - for selecting which chart objects and features to show/activate (all false by default)
Graphical Settings - for selecting the color, size and distances of drawn objects
Arrows Settings – for controlling Entry arrows’ features
Alert Settings - for controlling the use of Entry points MT5 Alerts
For EA Developers
- Buy Arrows: Buffer = 2
- Sell Arrows: Buffer = 3