BDB First Wiseman for MT4

5

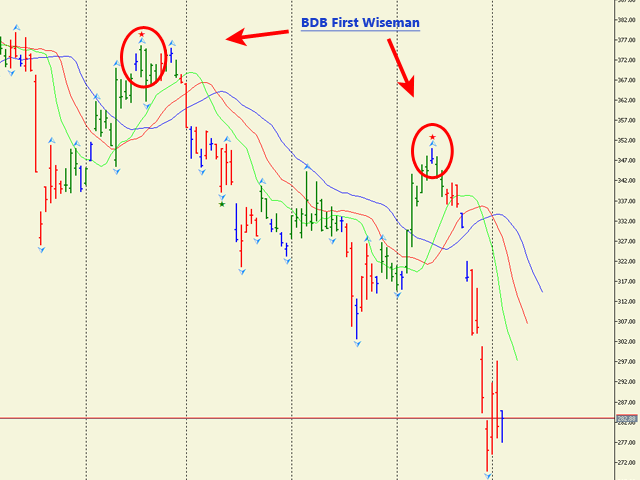
Bearish/Bullish divergent bar.

One of the signals of the "Trade Chaos" system of Bill Williams. (First wiseman)
When bar moving away from the  "Alligator" indicator and there is divergence on the Awesome Oscillator indicator, it shows a potential point of movement change.
It is based on the opening/closing of the bar, the position relative to the previous ones, the Alligator and AO.
When trading, the entrance is at the breakthrough of the bar(short trade - low of bar, long trade high of bar), and stop loss is placed at the extreme point of the bar.
For more effective development of the system, read and see the materials of Bill Williams.

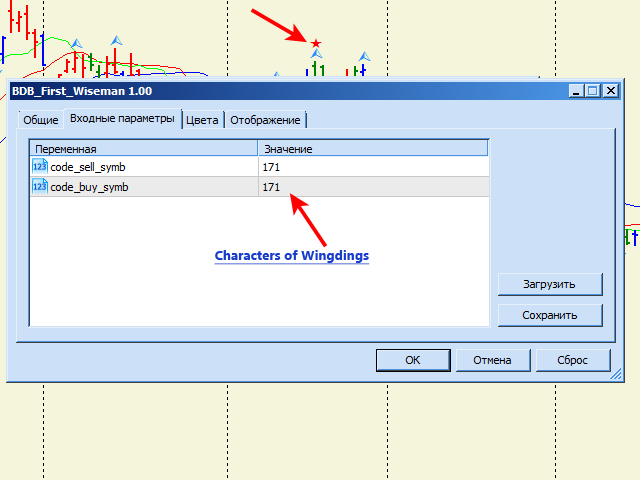
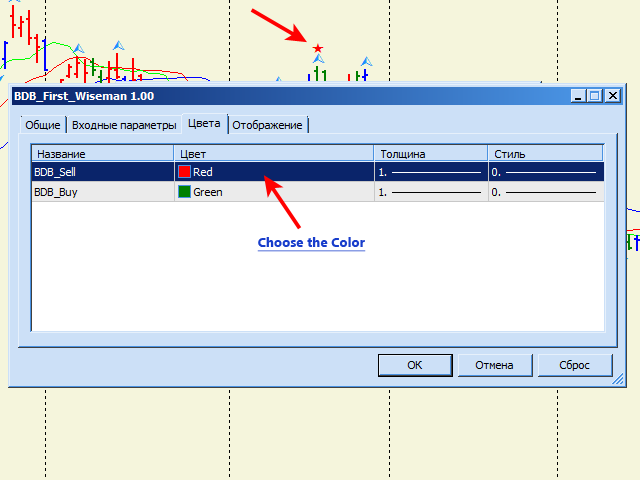
In the settings you can choose the color and Characters of Wingdings.


Avis 1
1akbj7
84
1akbj7 2020.09.20 06:32 
 

💯😎😎😎

Produits recommandés
KT DMA is a modified and advanced version of the classic Displaced Moving Averages with buy/sell crossover alerts and a Multi-Timeframe scanner that shows DMA's direction across each real-time time frame. A Displaced Moving Average is a simple moving average that moves ahead or backward in a time frame (either short-term or long-term). It also allows you to predict price movement more accurately. Features Depicts the trend direction using the alignment of three moving averages. Buy/Sell signals
The First Red MT4
Krzysztof Janusz Stankiewic
L'indicateur "The First Red", basé sur la stratégie créée par Dariusz Dargo, est conçu pour identifier et marquer les chandeliers sur le graphique qui répondent aux conditions de la stratégie "The First Red" et de ses extensions, telles que "Second Red", "First Green" et "Second Green". La stratégie se concentre sur l'analyse des extrêmes locaux et les signaux de l'oscillateur MACD. Premier chandelier rouge (First Red Candle):   Un chandelier est marqué comme "First Red" lorsqu'il établit un max
To access the TD sequential Scanner for MT5, please check https://www.mql5.com/en/market/product/123369?source=Site +Market+My+Products+Page. One of the MT5 versions includes additional timeframes such as M1, M2, M3,H2,H6,H8 and so on.( https://www.mql5.com/en/market/product/123367?source=Site +Market+My+Products+Page) TD Sequential Scanner: An Overview The TD Sequential scanner is a powerful technical analysis tool designed to identify potential price exhaustion points and trend reversals in fi
This indicator is based on the standard MACD indicator, but showing the changes up and down colored. It is a nice assistance to visualize our Expert MAGIC MACD. MAGIC MACD MT4: https://www.mql5.com/en/accounting/buy/market/41144?period=0 MAGIC MACD MT5: https://www.mql5.com/en/accounting/buy/market/41151?period=0 Inputs in the Indicator: Fast EMA: standard is 12 Slow EMA: standard is 26 Signal: depending on what you want to see. For the MAGIC MACD the standard is 1 in common settings: Fixed M
BeST_Profit Taker Exits is a Metatrader Indicator based on the corresponding vital part of Jim Berg's Trading System.It timely locates the most likely points/bars of significant Profit Taking and can be easily used as an add-on to any Trading System/Method . The Indicator consists of 2 Take Profit lines deriving as (MA ± times the ATR) usually the upper one above the prices (for Long Trades) and the lower one below prices (for Short Trades). When the Close (or High by choice) of a bar is above
ExtremeFinder
Matous Bartl
5 (1)
Description: ExtremeFinder analyze chart and find local extremes - maximum and minimum. Searched extreme is always of opposite type then previous. Local extreme is confirmed when price difference is higher then set price difference, but not sooner then after set number of candles. Two different types of Local extreme confirmation are performed: Normal for common Price changes, Quick for steep Price changes. Price difference to confirm local extreme can be set as absolute value, in percent of lo
Stop relying on a single oscillator for your reversals!   Divergence Pro is a professional-grade analytical tool designed to spot high-probability market reversal points by finding   confluence across 11 powerful oscillators . Instead of getting fake signals from just one RSI or MACD, Divergence Pro scans the market and only alerts you when multiple indicators agree on a divergence at the exact same time. It filters out the noise and leaves you with only the strongest setups.   KEY FEATURES:
This indicator is designed to find the difference in MACD price and indicator.  This indicator shows the price and indicator difference on the screen. The user is alerted with the alert sending feature. Our Popular Products Super Oscillator HC Cross Signal Super Cross Trend Strong Trend Super Signal Parameters divergenceDepth -  Depth of 2nd ref. point search Fast ema -  Fast ema setting Slow ema - slow ema setting MACD sma - macd sma setting indAppliedPrice -  Applied price of indicator indMAM
Arrow indicator, to determine adjustments and local trends The arrow appears on the current bar and after closing the bar will not disappear. Allows you to enter the transaction at the very beginning of the movement Thanks to the flexible settings you can use on any currency pairs, metals and cryptocurrency Can be used when working with binary options Distinctive features Does not redraw. Additional parameters for fine tuning. Works on all timeframes and symbols. Suitable for trading curren
Unlock the Power of Trend Dynamics with ATR Bands Midline Trend Indicator! The ATR Bands Midline Trend Indicator is a meticulously crafted tool designed to help traders identify trends with precision using the Average True Range (ATR) as a foundation. This indicator focuses on calculating a midline derived from ATR bands, providing a unique perspective for traders to detect trend direction and strength effectively. Important: This indicator is not optimized, leaving the door open for you to tai
Indicateur Crypto_Forex « Histogramme d'entrée de tendance » pour MT4, sans refonte. - L'indicateur Histogramme d'entrée de tendance permet de rechercher des signaux d'entrée dans la direction de la tendance une fois la barre d'entrée affichée. - Cet indicateur possède une fonctionnalité unique : il prend en compte le prix et le volume pour ses calculs. - L'histogramme d'entrée de tendance peut être de deux couleurs : rouge pour une tendance baissière et bleu pour une tendance haussière. - Dès
Trend Filter MT4
KEENBASE SOFTWARE SOLUTIONS
"The trend is your friend" is one of the oldest and best-known sayings in financial markets. However, this message only represents half of the picture. The correct saying should be, "The trend is your friend only until it ends." KT Trend Filter solves this problem by clearly indicating the start of an Uptrend and Downtrend using an averaging equation on the price series. If the trend direction is not clear, it shows the trend as sideways showing the uncertainty in the market. Features Get a big
KT De Munyuk MT4
KEENBASE SOFTWARE SOLUTIONS
The KT De Munyuk is a trend-based indicator that uses   Parabolic SAR   to identify the market direction. The indicator shows the PSAR in the form of green/red dots using a separate window. Buy Signal:   When a green dot appears after a series of at least three red dots. Buy Exit:   When a red dot appears on the current or next higher time frame. Sell Signal:   When a red dot appears after a series of at least three green dots. Sell Exit:   When a green dot appears on the current or next higher
A top-quality from the famous XSuper Trend indicator. It is completely loyal to the original algorithm, and implements many useful features Which includes Trend Indicators as Filters like MACD,CCI and Alligator. The Chefs Super Trend Plus Indicator is a great way to identify the current market trend. The indicator shows a clear distinction between uptrends and downtrends. The indicators has optional filters for sound signal. Suitable for the following trending pairs: EUR/USD, GBP/USD, USD/JPY,
Price Magnet — Price Density and Attraction Levels Indicator Price Magnet is a professional analytical tool designed to identify key support and resistance levels based on statistical Price Density. The indicator analyzes a specified historical period and detects price levels where the market spent the most time. These zones act as “magnets,” attracting price action or forming a structural base for potential reversals. Unlike traditional Volume Profile tools, Price Magnet focuses on price-time d
This is an indicator that helps you to scan the whole timeframe then informs you about the last candle position Engulfing Candlestick pattern was formed. The indicator also send alert to your mobile when a new engulfing candle is formed.  For the visual; 1. Green up arrow indicates a bullish engulfing candlestick pattern  2. Red down arrow indicates a bearish engulfing candlestick pattern
FREE
EngulfingPattern is a common candlestick chart form, often used as a reversal signal. This indicator will be marked with double arrow at the EngulfingPattern position after its formation. Supports any time period. At present, this indicator is only calculated and judged based on the upper and lower shadows of the K-line and the values of the entity. In the future, intelligent judgment based on other factors of the market will be added. I have added a quick control panel in the bottom left corn
PrecisionCore Arrows
Cosmas Akamadu Nwachukwu
This indicator gives fewer signals but precise when it does. Its a little scaled down version of ControlEdge Fx indicator , that gives less number of signal with less precise. If you want one the gives more signals and more accurate in catching larger trends you might want to check out ControlEdge Fx in this link  https://www.mql5.com/en/market/product/175731 Enter Buy when the Blue Arrow appears  Exit Buy when the Red X sign appears Enter Sell when the Red Arrow Appears    Exit Sell when the
FREE
MultiPair RSI Dashboard MultiPair RSI Dashboard est un indicateur puissant qui analyse plusieurs symboles sur différents horizons de temps et affiche les valeurs du RSI dans un tableau clair et lisible. Plus besoin de changer constamment de graphiques et de timeframes – obtenez une vue complète du RSI du marché en un seul coup d’œil ! Fonctionnalités principales Suivi multi-paires – Surveillez les niveaux de RSI pour toutes les paires de devises, indices, métaux ou cryptomonnaies. Vue multi
Trend MagicX
Hafis Mohamed Yacine
A trending market is one in which price is generally moving in one direction. ... When trading a trend-based strategy, traders usually pick the major currencies as well as any other currency utilizing the dollar because these pairs tend to trend and be more liquid than other pairs.  Best Trend Indicator That Tells You the Direction of the Trend   Trend MagicX_v1.1 displays the trend direction, duration, intensity and the resulting trend rating for all time frames in real time. You'll see at a
This indicator combines double bottom and double top reversal chart patterns together with detection of divergences between the price chart and the Momentum oscillator. Features Easily detect strong reversal signals Allows to use double top/bottom and Momentum divergence signals combined or independently Get email and/or push notification alerts when a signal is detected Custom colors can be used The indicator is not repainting Can easily be used in an EA (see below) Inputs ENABLE Double Top -
Wolfe Wave Scanner MT4
Reza Aghajanpour
4.64 (11)
**  All Symbols  x  All Timeframes  scan just by pressing scanner button ** *** Contact me  to send you instruction and add you in "Wolfe Wave Scanner group" for sharing or seeing experiences with other users. Introduction: A Wolfe Wave is created with five-wave patterns in price. It shows supply and demand and a fight towards a balance price. T hese waves of price actions can help traders identify the boundaries of   the trend . Also  It helps forecast how the price will move in the near future
Présentation du Moving Average Crossover Scanner Pro, un multi-symbole puissant et polyvalent,       Multi-période       indicateur conçu pour améliorer vos décisions de trading. Cet indicateur avancé intègre des croisements de moyenne mobile (MA) et offre des fonctionnalités supplémentaires pour fournir des alertes rapides et fiables. Avec le Moving Average Crossover Scanner Pro, vous pouvez bénéficier des caractéristiques uniques des croisements MA sur plusieurs paires de devises et périodes
Real Trade
Thomas Bradley Butler
Real Trade négocie sur des délais inférieurs à 1 heure. Tradez dans les directions haussières et baissières. Négociez avec les directions de tendance temporelle les plus élevées et négociez la première bougie. Utilisez le contraire pour sortir ou utilisez le ratio pour sortir 1:1 ou plus avec des arrêts de fuite. Négociez les tendances réelles pendant les heures actives et avec une direction de tendance plus élevée pour obtenir les meilleurs résultats. Indicateur de charge dans le testeur pour
Trend Map
Maryna Shulzhenko
The Trend Map indicator is designed to detect trends in price movement and allows you to quickly determine not only the direction of the trend, but also to understand the levels of interaction between buyers and sellers. It has no settings and therefore can be perceived as it signals. It contains only three lines, each of which is designed to unambiguously perceive the present moment. Line # 2 characterizes the global direction of the price movement. If we see that the other two lines are above
Multi-timeframe Parabolic SAR dashboard allows you to add and monitor PSAR trends. The multi-timeframe Parabolic SAR dashboard will save you a lot of time and gives you a single view of the markets using PSAR. In short, you can just view one window and get a snapshot of up to 21 instruments on your MT4 platform. The indicator opens in a sub-window. Below are the features of the PSAR Dashboard Indicator Modify PSAR Settings: The PSAR Dashboard comes with default PSAR settings of 0.02 (Step) and 0
KT Volatility Oscillator
KEENBASE SOFTWARE SOLUTIONS
L'oscillateur de volatilité KT analyse les données de marché passées et actuelles à l'aide d'une formule mathématique pour afficher le résultat sous forme d'oscillateur. Les vagues croissantes et décroissantes correspondent respectivement à une volatilité élevée et faible de l'actif.  En résumé, la volatilité est simplement une mesure des fluctuations du prix d'un actif sur une certaine période de temps. Sans volatilité, il y aurait peu de mouvement sur le marché et les traders ne pourraient pas
" Valiant Strong Trend " - Your Ultimate MT4 Signal Indicator Are you ready to elevate your trading game to new heights? Look no further than the "Valiant Strong Trend" MT4 signal indicator, your indispensable tool for navigating the complex world of financial markets. Key Features: Precise Trend Identification : "Valiant Strong Trend" employs advanced algorithms to accurately identify market trends, whether they are bullish or bearish. Say goodbye to guesswork and hello to informed trading deci
Holy Trinity Volatility Indicator This indicator reflects the peak time of the day wherein there's is expected to be sharp price actions. It also presents the markets as just waking up from the dull and less volatile Asian (and or London) trading sessions into a bustling time of highly liquid price flows. NOTE: This indicator informs the trader ahead of peak price movements - one bar just before the real actions starts. Enter when the volatility line falls below the Tripple Exponential Moving Av
Buying the dips
Steffen Reinhold Noll
5 (4)
Buying the Dips Buying the Dips is a professional oscillator designed to identify market extremes and trend-based pullbacks across all markets and timeframes. Two adaptive quotient lines, visual trend clouds, and optional swing and scalping signals provide clear, non-repainting trading impulses for traders who want to identify oversold dips and overbought zones with precision. How It Works The indicator is built on an advanced quotient engine using high-pass filtering and adaptive normalization
FREE
Les acheteurs de ce produit ont également acheté
Gann Made Easy
Oleg Rodin
4.83 (162)
Gann Made Easy est un système de trading Forex professionnel et facile à utiliser qui est basé sur les meilleurs principes de trading en utilisant la théorie de mr. WD Gann. L'indicateur fournit des signaux d'ACHAT et de VENTE précis, y compris les niveaux Stop Loss et Take Profit. Vous pouvez échanger même en déplacement en utilisant les notifications PUSH. VEUILLEZ ME CONTACTER APRÈS L'ACHAT POUR RECEVOIR GRATUITEMENT DES INSTRUCTIONS DE TRADING ET D'EXCELLENTS INDICATEURS SUPPLÉMENTAIRES! Vou
M1 Sniper
Oleg Rodin
5 (22)
M1 SNIPER est un système d'indicateurs de trading facile à utiliser. Il s'agit d'un indicateur à flèche conçu pour l'unité de temps M1. Cet indicateur peut être utilisé seul pour le scalping sur l'unité de temps M1 ou intégré à votre système de trading existant. Bien que conçu spécifiquement pour le trading sur l'unité de temps M1, ce système peut également être utilisé avec d'autres unités de temps. Initialement, j'avais conçu cette méthode pour le trading du XAUUSD et du BTCUSD. Cependant, je
Scalper Inside PRO
Alexey Minkov
4.74 (69)
Scalper Inside PRO – Since 2020. An exclusive indicator that utilizes an innovative algorithm to swiftly and accurately determine the market trend. The indicator automatically calculates opening, closing, and profit levels, providing detailed trading statistics. With these features, you can choose the most appropriate trading instrument for the current market conditions. Additionally, you can easily integrate your own arrow indicators into Scalper Inside Pro to quickly evaluate their statistics
Le système PRO Renko est un système de trading très précis spécialement conçu pour le trading de graphiques RENKO. Il s'agit d'un système universel qui peut être appliqué à divers instruments de négociation. Le système neutralise efficacement ce qu'on appelle le bruit du marché en vous donnant accès à des signaux d'inversion précis. L'indicateur est très facile à utiliser et n'a qu'un seul paramètre responsable de la génération du signal. Vous pouvez facilement adapter l'outil à n'importe que
Auto Optimized Parabolic RSI : Moteur de Momentum 3D Avancé La plupart des indicateurs pour les particuliers échouent car ils s'appuient sur des paramètres statiques qui se brisent dès que la volatilité du marché change. L'Auto Optimized Parabolic RSI résout le problème de l'« obsolescence des indicateurs » en recalculant continuellement son propre avantage mathématique, apportant une adaptation quantitative de niveau institutionnel directement sur votre terminal MT5. L'Avantage Principal : Opti
Quantum Breakout Indicator PRO
Bogdan Ion Puscasu
4.96 (26)
Présentation       Quantum Breakout PRO   , l'indicateur révolutionnaire MQL5 qui transforme la façon dont vous négociez les zones d'évasion ! Développé par une équipe de traders expérimentés avec une expérience de trading de plus de 13 ans,   Quantum Breakout PRO   est conçu pour propulser votre parcours de trading vers de nouveaux sommets grâce à sa stratégie de zone de discussion innovante et dynamique. Quantum Breakout Indicator vous donnera des flèches de signalisation sur les zones d'év
Market Makers
Mohamed Hassan
5 (4)
After purchase, contact me privately to receive 1 month of free testing with EA Forex Proton! This advanced MT4 trading robot automatically executes signals from any MT4 indicator, including Market Makers. The latest version also includes AI integration, allowing each trade signal to be analyzed using Artificial Intelligence. Live Signal with EA Forex Proton: Click here Market Makers is a powerful price action trading system designed to identify high-probability Buy and Sell opportunities based
Apex Edge No Repaint Indicateur de trading professionnel sans repeint pour MT4 Apex Edge No Repaint est un outil de trading haut de gamme, clair et fiable, conçu pour les traders forex et cryptomonnaies exigeants qui recherchent des signaux précis sans la frustration des flèches qui se repeignent constamment. Caractéristiques principales : Aucun repeint – Les signaux restent fixes une fois affichés sur le graphique Système de double signal : Signaux bruts pour les opportunités précoces et
Si vous achetez cet indicateur, vous recevrez mon Gestionnaire de Trading Professionnel   + EA  GRATUITEMENT. Tout d'abord, il convient de souligner que ce système de trading est un indicateur non repeint, non redessiné et non retardé, ce qui le rend idéal pour le trading manuel et automatisé. Cours en ligne, manuel et téléchargement de préréglages. Le "Système de Trading Smart Trend MT5" est une solution de trading complète conçue pour les traders débutants et expérimentés. Il combine plus de
Cet indicateur fonctionne en conjonction avec la théorie des vagues d'Elliott de deux manières : Mode automatique : Dans ce mode, l'indicateur détectera automatiquement les cinq vagues motrices sur le graphique conformément à la théorie des vagues d'Elliott. Il fournira des prédictions et identifiera les zones potentielles de retournement. De plus, il a la capacité de générer des alertes et des messages push pour informer les traders des développements importants. Cette fonctionnalité automatiqu
PZ Harmonacci Patterns
PZ TRADING SLU
3.17 (6)
Trade smarter, not harder: Empower your trading with Harmonacci Patterns This is arguably the most complete harmonic price formation auto-recognition indicator you can find for the MetaTrader Platform. It detects 19 different patterns, takes fibonacci projections as seriously as you do, displays the Potential Reversal Zone (PRZ) and finds suitable stop-loss and take-profit levels. [ Installation Guide | Update Guide | Troubleshooting | FAQ | All Products  ] It detects 19 different harmonic pric
Please send me Direct message on MQL5 CHAT after purchasing the Indicator for Training and Installation Support There are some additional files that is important to use with the Indicator . So be sure to contact me after purchasing the Indicator So that I can add you for training and support . If you find any difficulty with installation then send me Direct message here So that I can connect with you via Anydesk or Teamview for the product installation. " Smart Order Block Indicator " to find m
Signal GoldRush Trend Arrow L'indicateur GoldRush Trend Arrow Signal fournit une analyse précise et en temps réel des tendances, spécialement conçue pour les scalpers à haute vitesse et à court terme sur la paire XAU/USD. Conçu spécialement pour les intervalles de temps d'une minute, cet outil affiche des flèches directionnelles indiquant clairement les points d'entrée, ce qui permet aux scalpers de naviguer en toute confiance dans des conditions de marché volatiles. L'indicateur se compose
L'indicateur « Dynamic Scalper System » est conçu pour la méthode de scalping, permettant de trader au sein des vagues de tendance. Testé sur les principales paires de devises et l'or, il est compatible avec d'autres instruments de trading. Fournit des signaux pour l'ouverture de positions à court terme le long de la tendance, avec un support supplémentaire pour les fluctuations de prix. Principe de l'indicateur : De grandes flèches déterminent la direction de la tendance. Un algorithme de gén
PZ Trend Trading
PZ TRADING SLU
4.8 (5)
Capture every opportunity: your go-to indicator for profitable trend trading Trend Trading is an indicator designed to profit as much as possible from trends taking place in the market, by timing pullbacks and breakouts. It finds trading opportunities by analyzing what the price is doing during established trends. [ Installation Guide | Update Guide | Troubleshooting | FAQ | All Products ] Trade financial markets with confidence and efficiency Profit from established trends without getting whips
GOLD Impulse with Alert
Bernhard Schweigert
4.67 (12)
Cet indicateur est une super combinaison de nos 2 produits Advanced Currency IMPULSE with ALERT  +   Currency Strength Exotics . Il fonctionne pour tous les cadres temporels et montre graphiquement l'impulsion de force ou de faiblesse pour les 8 principales devises plus un symbole ! Cet indicateur est spécialisé pour montrer l'accélération de la force des devises pour tout symbole comme l'or, les paires exotiques, les matières premières, les indices ou les contrats à terme. C'est le premier
Advanced Supply Demand
Bernhard Schweigert
4.91 (300)
Offre spéciale : 40 % de réduction La solution idéale pour les traders débutants comme experts ! Cet indicateur est un outil de trading unique, performant et abordable grâce à l’intégration de nombreuses fonctionnalités exclusives et d’une nouvelle formule. Cette mise à jour vous permet d’afficher des zones sur deux unités de temps. Vous pourrez ainsi visualiser non seulement une unité de temps supérieure, mais aussi l’unité de temps du graphique, ainsi que l’unité de temps supérieure : des z
Gold Scalper Super
Aleksandr Makarov
5 (2)
Gold Scalper Super is an easy-to-use trading system. The indicator can be used as a standalone scalping system on the M1 time frame, as well as part of your existing trading system. Bonus: when purchasing an indicator, Trend Arrow Super is provided free of charge, write to us after purchase. The indicator 100% does not repaint!!! If a signal appears, it does not disappear! Unlike indicators with redrawing, which lead to the loss of a deposit, because they can show a signal and then remove it.
CRT Candle Range Theory HTF MT4.   Ultimate CRT Indicator: Advanced ICT Concepts and Malaysian SnR Trading System Discounted   Price   $50  !!     Secure your lifetime access   now   before it switches to   subscription-only ! Master the Market Maker's Footprints with the Most Advanced Candle Range Theory Indicator Unlock the true power of   Smart Money Concepts (SMC)   and trade precisely like the institutions with the   Ultimate CRT Indicator . Built exclusively for serious traders, this indic
Identify key turning points with reliable fractal analysis This indicator examines the price structure of fractals of different periods to determine possible reversal points in the market, providing timing to positional traders that already have a fundamental or technical valuation model. Unlike its younger brother, Reversal Fractals , this indicator won't miss reversals because of the period selected, and will find reversal fractals on a zig-zag fashion, ignoring those reversals which do not
PZ Support Resistance
PZ TRADING SLU
3.33 (3)
Unlock key market insights with automated support and resistance lines Tired of plotting support and resistance lines? This is a multi-timeframe indicator that detects and plots supports and resistance lines in the chart with the same precision as a human eye would. As price levels are tested over time and its importance increases, the lines become thicker and darker, making price leves easy to glance and evaluate. [ Installation Guide | Update Guide | Troubleshooting | FAQ | All Products ] Boos
They say history repeats itself. What if you could prove it in real-time? The Propfolio Ghost Pattern is an advanced algorithmic pattern-matching engine. It empowers you to select any current price action structure on your chart and instantly scan thousands of historical candles to find the exact moment in the past where the market did the exact same thing. Once it finds the highest probability match, it projects the historical outcome into the future as "Ghost Candles"—giving you a highly calcu
ACTUELLEMENT 26% DE RÉDUCTION ! !! Cet indicateur est une super combinaison de nos deux indicateurs principaux ( Advanced Currency Strength 28   &  Advanced Currency IMPULSE with ALERT ). Il montre les valeurs de force de la devise pour les TICK-UNITS et les signaux d'alerte pour 28 paires Forex. 11 unités de tic-tac différentes peuvent être utilisées. Ce sont 1, 2, 3, 4, 5, 6, 10, 12, 15, 20 et 30 secondes. La barre de Tick-Unit dans la sous-fenêtre sera affichée et déplacée vers la gauche lo
Atomic Analyst
Issam Kassas
5 (5)
Tout d'abord, il convient de souligner que cet indicateur de trading n'est ni repainting, ni redrawing et ne présente aucun délai, ce qui le rend idéal à la fois pour le trading manuel et automatisé. Manuel de l'utilisateur : réglages, entrées et stratégie. L'Analyste Atomique est un indicateur d'action sur les prix PA qui utilise la force et le momentum du prix pour trouver un meilleur avantage sur le marché. Équipé de filtres avancés qui aident à éliminer les bruits et les faux signaux, et à
Contactez-moi après l'achat pour obtenir un EA en bonus basé sur cet indicateur. La Self Optimizing Double MA Strategy est un outil de trading de niveau professionnel conçu pour éliminer les approximations de paramètres. Propulsé par un moteur d'auto-optimisation intégré, il s'adapte continuellement aux conditions changeantes du marché en simulant des milliers de combinaisons de paramètres en arrière-plan afin de maintenir un avantage statistique. Au lieu de s'appuyer sur des paramètres statiqu
ACTUELLEMENT 40% DE RÉDUCTION La meilleure solution pour tout débutant ou trader expert ! Cet indicateur est un outil de trading unique, de haute qualité et abordable car nous avons incorporé un certain nombre de caractéristiques exclusives et une nouvelle formule. Avec seulement UN graphique, vous pouvez lire la force de la devise pour 28 paires Forex ! Imaginez comment votre trading va s'améliorer parce que vous êtes capable de repérer le point de déclenchement exact d'une nouvelle tendance
Un indicateur technique qui structure les graphiques et identifie les mouvements de prix cycliques. Peut fonctionner sur n'importe quel graphique. Plusieurs types de notifications. Il y a des flèches supplémentaires sur le graphique lui-même. Sans revenir sur l'histoire, fonctionne sur la fermeture de la bougie. TF recommandé à partir de M5 et plus. Facile à utiliser et à configurer les paramètres. Lorsque vous utilisez 2 indicateurs avec des paramètres différents, vous pouvez les utiliser sans
KuKl
IGOR KIRIANEN
The indicator is built on a non-standard Zig Zag, it draws accumulations after which if the price leaves this zone and a test of this zone occurs, then a sound signal is given and an arrow appears - after the test candle closes.The indicator does not redraw its signals, it is very easy to use, there are only three settings 1- this is the zig zag parameter 2- this is the minimum price exit from the zone 3- this is the maximum price exit from the zone. The lower the parameter for Zig Zag, the more
Day Trader Master est un système de trading complet pour les day traders. Le système se compose de deux indicateurs. Un indicateur est un signal fléché pour acheter et vendre. C'est l'indicateur de flèche que vous obtenez. Je vous fournirai le deuxième indicateur gratuitement. Le deuxième indicateur est un indicateur de tendance spécialement conçu pour être utilisé conjointement avec ces flèches. LES INDICATEURS NE RÉPÉTENT PAS ET NE TARDENT PAS! L'utilisation de ce système est très simple. Il v
ZigZag Lines MTF
Taras Slobodyanik
4.38 (13)
Multi timeframe ZigZag indicator. It displays the support/resistance horizontal lines and their breakouts, as well as draws the current targets of the market. It can also display lines of the Fractals indicator and candles from other periods (up to Quarterly). So, you can actually see the supply and demand levels. Indicator – connects key lows and highs to show trend lines. You can also use it as indicator for the Break of Structure(BOS) & Market Structure Shift(MSS). The indicator redraws the
Plus de l'auteur
Bearish/Bullish divergent bar . One of the signals of the "Trade Chaos" system of Bill Williams. (First wiseman) When bar moving away from the  "Alligator" indicator and there is divergence on the Awesome Oscillator indicator, it shows a potential point of movement change. It is based on the opening/closing of the bar, the position relative to the previous ones, the Alligator and AO. When trading, the entrance is at the breakthrough of the bar(short trade - low of bar, long trade high of bar), a
SQUAT Bar BW
Sergey Chepurnykh
Squat bar. One of the signals of the "Trade Chaos" system of Bill Williams. It is calculated based on the difference in price changes and tick volume. Strengthens the signal of the "Bearish/Bullish Divergent Bar (First Wiseman)" if it coincides with it or is nearby. Tested in comparison with the original program "Investor's Dream". For more effective development of the system, read and see the materials of Bill Williams. In the settings you can choose the color of bar.
Swap Spread Time
Sergey Chepurnykh
4 (2)
Convenient information line on the chart. Displays the cost of the point depending on the selected volume (selection in the settings) Displays a swap of short and long trades depending on the selected volume. Shows a triple swap and indicates the day of the week on which it is charged Displays the current spread for the current instrument Displays the remaining time until the next bar on the current timeframe.       In the settings you can choose the color, font size, placement and volume.
FREE
Shows the full name of the symbol on the chart. Especially relevant for Stocks, CFDs, Indices and Futures. Also, when you press "right"(cifre 6) on the NumPad, an "Alert" is issued, from which you can copy the name in the "Experts" column and use, for example, to search for additional information about the company. In the settings you can select the color, placement and font size.
FREE
Squat bar. One of the signals of the "Trade Chaos" system of Bill Williams. It is calculated based on the difference in price changes and tick volume. Strengthens the signal of the "Bearish/Bullish Divergent Bar (First Wiseman)" if it coincides with it or is nearby. Tested in comparison with the original program "Investor's Dream". For more effective development of the system, read and see the materials of Bill Williams. In the settings you can choose the color and width of bar. (Width: 3-if
Filtrer:
1akbj7
84
1akbj7 2020.09.20 06:32 
 

💯😎😎😎

Répondre à l'avis