GraphMACD

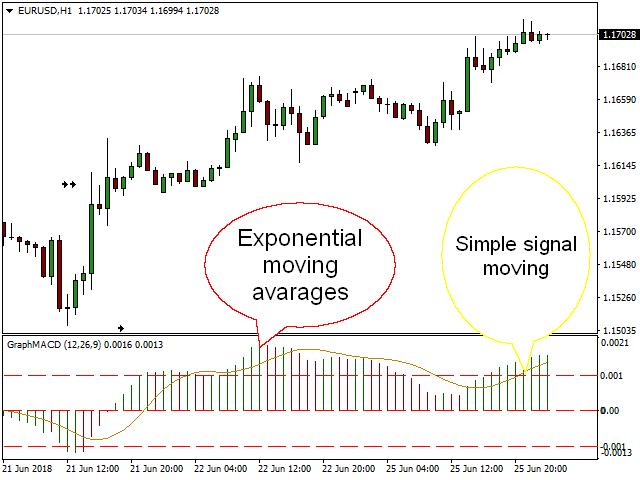
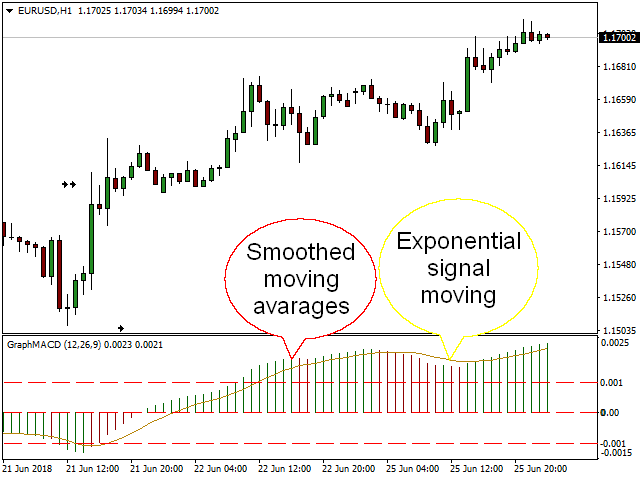
The indicator is a modified version of the MACD indicator. It is provided with additional options for setting the types of moving averages used in the calculation of the MACD indicator, similarly with a signaling moving average. New settings are available for using different MA calculation methods.

The product was developed to fully reveal and enhance the information provided by the signals generated by the MACD indicator.

Definition of global variables:

  • FastPeriod - fast MA period
  • SlowPeriod - slow MA period
  • SignalPeriod - signal MA period
  • FastMethod - fast MA method
  • FastAppliedTo - fast MA price type
  • SlowMethod - slow MA method
  • SlowAppliedTo - slow MA price type
  • SignalMethod - signal MA method
  • SignalShift - signal MA shift
  • Levels
Produits recommandés
Осциллятор   Чайкина   ( Chaikin   Oscillator ) — это индикатор импульса, созданный Марком   Чайкиным , и, очевидно, индикатор назван в честь своего создателя. Он измеряет импульс линии распределения и накопления, используя формулу схождения-расхождения скользящих средних (MACD). На основе данных об этом импульсе мы можем получить представление о направленных изменениях в линии распределения и накопления.
Il s'agit d'une combinaison de plusieurs oscillateurs en un seul système de divergence qui donne l'impression d'un indicateur de divergence plus fiable. Il est basé sur plusieurs devises et fonctionne mieux sur une période de 15 minutes et plus. Chaque fois qu'un signal est généré, il affiche une alerte à l'utilisateur. Il est plus idéal s'il est combiné avec d'autres indicateurs d'action des prix ou systèmes de négociation.
PABT Pattern Indicator - it's classical system one of the signal patterns. Indicator logic - the Hi & Lo of the bar is fully within the range of the preceding bar, look to trade them as pullback in trend. In the way if indicator found PABT pattern it's drawing two lines and arrow what showing trend way.  - First line - it's entry point and drawing at: 1. On the high of signal bar or on middle of the signal bar (depending from indicator mode) for buy; 2. On the low of signal bar or on middle of t
Trend Cutter
Oleg Rodin
5 (2)
Trend Cutter est un indicateur de tendance qui peut être utilisé avec n'importe quelle période, y compris les périodes inférieures comme M1 et M5. L'indicateur est idéal pour les traders qui préfèrent le trading intrajournalier et sera également utile à ceux qui préfèrent le trading à long terme. Vous pouvez utiliser cet indicateur comme base pour votre système de trading ou comme solution de trading autonome. L'indicateur fournit tous les types d'alertes, y compris les notifications PUSH. L'ind
Wave Wolf MT4
Andrei Salanevich
L'indicateur Forex Wave Wold MT4 est conçu pour rechercher les vagues de Woolf et les afficher dans la fenêtre actuelle du terminal de trading. Un excellent indicateur pour les traders utilisant les vagues de Wolf dans le commerce. Son application dans les stratégies de trading augmentera considérablement leur efficacité et leur rentabilité. INFORMATIONS SUR L'INDICATEUR Contrairement à d'autres indicateurs de vague Wold, l'indicateur Forex Wave Wold MT4 a un certain nombre de caractéristiques
FXC iDeM-DivergencE MT4 Indicator This is an advanced DeMarker indicator that finds trend-turn divergences on the current symbol. The indicator detects divergence between the DeMarker and the price movements as a strong trend-turn pattern. Main features: Advanced divergence settings Price based on Close, Open or High/Low prices Give Buy/Sell open signals PUSH notifications E-mail sending Pop-up alert Customizeable Information panel Input parameters: DeM Period: The Period size of the DeMarker in
Heiken Ashi Smoothed Strategy is a very simple but powerful system to get forex market trend direction. This indicator is actually 2 indicators in 1 pack, Heiken Ashi and Heiken Ashi Smoothed Moving Average both included. Because HA (Heiken Ashi) and HAS (Heiken Ashi Smoothed) are calculated in the same one system event with necessary buffers and loop only, so it is the FAST, OPTIMIZED and EFFICIENT HA having the combined indicator of MetaTrader 4. You can choose to display HA and HAS in the sam
Indicateur Crypto_Forex « RVI et 2 moyennes mobiles » pour MT4. Sans modification. - L'indice de vigueur relative (RVI) est un indicateur de momentum technique très utile sur les marchés en tendance. - L'indicateur « RVI et 2 moyennes mobiles » vous permet de visualiser les moyennes mobiles rapides et lentes de l'oscillateur RVI.   PC and Mobile Alerts. - L'indicateur est idéal pour le trading de momentum, en particulier sur les grandes unités de temps : J1, H4, H1, M30. - Il est très facile à
The indicator detects and displays Shark harmonic pattern (see the screenshot). The pattern is plotted by the extreme values of the ZigZag indicator (included in the resources, no need to install). After detecting the pattern, the indicator notifies of that by a pop-up window, a mobile notification and an email. The indicator highlights the process of the pattern formation and not just the complete pattern. In the former case, it is displayed in the contour triangles. After the pattern is comple
FXC iMACD-DivergencE MT4 Indicator This is an advanced MACD indicator that finds trend-turn divergences on the current symbol. The indicator detects divergence between the MACD and the price movements as a strong trend-turn pattern. Main features: Advanced divergence settings Price based on Close, Open or High/Low prices Give Buy/Sell open signals PUSH notifications E-mail sending Pop-up alert Customizeable Information panel Input parameters: MACD Fast-EMA: The Fast-EMA variable of the MACD indi
Infinity Trend Pro
Yaroslav Varankin
1 (1)
This is a trend indicator without redrawing Developed instead of the binary options strategy (by the color of the Martingale candlestick) Also works well in forex trading When to open trades (binary options) A signal will appear in the place with a candle signaling the current candle It is recommended to open a deal for one candle of the current timeframe M1 and M5 When a blue dot appears, open a deal up When a red dot appears, open a trade down. How to open trades on Forex. When a signal is rec
Stochastic Divergence
Oleksii Pidlubnyi
3 (2)
The indicator displays divergence and convergence on all instruments. It works on all timeframes. After finding divergence/convergence, the indicator draws a Buy or a Sell arrow according to the detected signal.  Settings Buy - show buy signals Sell - show sell signals Divergence - show divergence on the chart Convergence - show convergence on the chart KPeriod, DPeriod, Slowing - Stochastic settings drawPriceTrendLines - draw a line (of divergence/covergence) on a price chart drawIndicatorTren
The MACD CloseBars indicator is a trading system based on the MACD indicator popular among many traders, which is built on the principle of bars closing above the moving averages selected in the indicator settings. The signal for entering/exiting the market is the frame of the bars colors according to the trend: in case the bars in the main window of the chart are closed above/below the Fast Moving Average, Slow Moving Average individually or both together. Indicator Parameters Fast Moving Aver
The input parameter  counted_bars  determines on how many bars the indicator lines will be visible. The input parameter  barsNum is the period for bands calculation. When PriceClose for previous bar is above upper band a Long position may be opened. When PriceClose for previous bar is under lower band a Short position may be opened. If the current Price is between bands it is time to wait.
MACDivergence MTF
Pavel Zamoshnikov
4.29 (7)
Advanced ideas of the popular MACD indicator: It detects and displays classic and reverse divergences (three methods of detecting divergences). It uses different color to highlight an uptrend and a downtrend. Two methods of determining a trend: а) MACD crosses the 0 level (classic signal); б) MACD crosses its own average (early signal). This is a multi-timeframe indicator: it can display MACD data from other timeframes. Two methods of drawing: classic histogram and line. It generates sound and v
This indicator places a moving average of the specified type over the standard RSI indicator. This is an extremely useful tool for spotting reversal points and RSI divergences. This indicator provides buffers, allowing you to use it in your expert advisor. I like to make the RSI period the same as the moving average period, but it is up to you to set it up however you would like.
G99 GRAVITY G99 Gravity is a channel indicator for the MetaTrader 4 terminal. This indicator allows finding the most probable trend reversal points. Unlike most channel indicators, G99 Gravity does not redraw. Attach the indicator to a chart, and the alert will trigger once a signal emerges. With our alerting system, you will never miss a single position opening signal! Advantages of the indicator Perfect for scalping. Excellent for identifying trend reversals. Suitable for beginners and exper
Lyne
Maksim Kalachev
About the Lyne indicator Lyne is a Metatrader 4 (MT4) indicator, the essence of which is to transform the accumulated historical data. The Lyne indicator makes it possible to detect various features and patterns in price dynamics that are invisible to the naked eye. Based on this information, traders can anticipate further price movement and adjust their strategy accordingly. This indicator has proven itself in the scalping strategy. The indicator works without repainting.
EZZ Zig Zag MT4
Paulo Rocha
5 (1)
EZZ Elite Zig Zag is an indicator for the MetaTrader 4 terminal. This indicator traces the peak of the trend based on the market reversal, thus showing various opportunities in the financial market. EZZ Elite Zig Zag is a visual tool, intuitive, and easy to understand and use.  Test it Yourself by Downloading it for Free. Author Paulo Rocha all rights reserved
Trend Oscillator - est un indicateur Crypto_Forex personnalisé avancé, un outil de trading efficace ! - Une nouvelle méthode de calcul avancée est utilisée - 20 options pour le paramètre « Prix pour le calcul ». - L'oscillateur le plus fluide jamais développé. - Couleur verte pour les tendances à la hausse, couleur rouge pour les tendances à la baisse. - Valeurs de survente : inférieures à 5, Valeurs de surachat : supérieures à 95. - Il existe de nombreuses possibilités de mettre à niveau même
SPECIAL PRICE  Great offers on all products. Great opportunities. Three overlapping Bollinger. This indicator is ready for use with three overlapping bollinger bands. Ideal for traders who love bollinger bands who in this way can see directly from a graph how the bollinger bands move in a higher Timeframe without having to change the graph and timeframe. This indicator identifies the real squeezes that start on three different timeframes. The signal thus becomes more valid and certain.
[ZhiBiCCI] indicators are suitable for all cycle use, and are also suitable for all market varieties. [ZhiBiCCI] Green solid line is a reversal of bullish divergence. The green dotted line is a classic bullish divergence. [ZhiBiCCI] The solid line to the red is a reverse bearish divergence. The red dotted line is a classical bearish divergence. [ZhiBiCCI] can be set in the parameters (Alert, Send mail, Send notification), set to (true) to send instant signals to the alarm window, email, insta
Voles Indicator Operation Principles It is based on the standard indicators of the MetaTrader 4 terminal. It shows the market entry points. How to trade When a bar is complete and an arrow is shown, place a BuyStop order at the High of the bar is the arrow is green, or a SellStop order at the Low of the bar if the arrow is red. StopLoss should be set at the level of the last downwards fractal below the entry point at a green arrow or at the level of the last upwards fractal above the entry poi
Le MACD Multicurrency Scanner MT4 est un indicateur de trading avancé conçu pour analyser plusieurs paires de devises en utilisant la stratégie de Convergence Divergence de Moyenne Mobile (MACD). Cet outil est parfait pour les traders cherchant à optimiser leur performance de trading en identifiant des signaux d'achat et de vente potentiels à travers divers intervalles de temps. Avec son interface conviviale, le MACD Multicurrency Scanner MT4 permet aux traders de prendre des décisions éclairées
Bollinger trading is an indicator for mt4 that uses Bollinger bands and other trend following strategies To detect the direction of the market. Just as attached in the screenshot the light blue line shows areas The market is rising. This means opening positions here is in the direction of the trend. The dark blue lines cane be used for sell trades when the market moves in the opposing direction. Using this tactics you can have a clear sense of where the market is headed.
The   Trend Duration Forecast MT4   indicator is designed to estimate the probable lifespan of a bullish or bearish trend. Using a Hull Moving Average (HMA) to detect directional shifts, it tracks the duration of each historical trend and calculates an average to forecast how long the current trend is statistically likely to continue. This allows traders to visualize both real-time trend strength and potential exhaustion zones with exceptional clarity. KEY FEATURES Dynamic Trend Detection:   Uti
Wolfe Wave Scanner MT4
Reza Aghajanpour
4.64 (11)
**  All Symbols  x  All Timeframes  scan just by pressing scanner button ** *** Contact me  to send you instruction and add you in "Wolfe Wave Scanner group" for sharing or seeing experiences with other users. Introduction: A Wolfe Wave is created with five-wave patterns in price. It shows supply and demand and a fight towards a balance price. T hese waves of price actions can help traders identify the boundaries of   the trend . Also  It helps forecast how the price will move in the near future
MACD Divergence with arrows complements the MACD indicator. It scans for divergence within the MACD oscillator then draws arrows on the entry points in the chart window. NB:The indicator does not bring up the MACD window nor does it draw lines on the MACD window. The screenshots are a mere description of how they work. The user will become alerted whenever a divergence is in progress and should WAIT for the perfect moment to make an entry. Perfect entries can be anything basic such as support an
Bandes de Bollinger Auto-Optimisées – Outil de volatilité adaptatif basé sur le comportement réel du marché Cet indicateur avancé pour MT4 trouve automatiquement les meilleures périodes et écarts-types en simulant les trades sur les données historiques. Au lieu de paramètres fixes, il s’adapte dynamiquement aux changements du marché et à la structure des prix pour créer des bandes qui reflètent plus précisément la volatilité en temps réel. Pas besoin d’ajustements manuels. Fonctionnalités princi
The Stochastic Oscillator is a momentum indicator that uses support and resistance levels. The term "stochastic" refers to the point of a current price in relation to its price range over a period of time. You can use a New Stochastic in the same way as classical one: Overbought and Oversold areas to make a Buy or Sell orders. This new indicator shows all variety of Fibonacci Levels (from 23.6 to 76.4) which can be used as Overbought and Oversold levels as well as points to close an open positio
Les acheteurs de ce produit ont également acheté
Gann Made Easy
Oleg Rodin
4.83 (163)
Gann Made Easy est un système de trading Forex professionnel et facile à utiliser qui est basé sur les meilleurs principes de trading en utilisant la théorie de mr. WD Gann. L'indicateur fournit des signaux d'ACHAT et de VENTE précis, y compris les niveaux Stop Loss et Take Profit. Vous pouvez échanger même en déplacement en utilisant les notifications PUSH. VEUILLEZ ME CONTACTER APRÈS L'ACHAT POUR RECEVOIR GRATUITEMENT DES INSTRUCTIONS DE TRADING ET D'EXCELLENTS INDICATEURS SUPPLÉMENTAIRES! Vou
Genesis Matrix Pro is a professional multi-timeframe trend detection indicator designed to help traders identify high-quality market alignment with clarity and structure. It combines 12 different technical indicators into one visual alignment matrix, allowing traders to quickly see when market conditions are bullish, bearish, or neutral. A signal is generated only when the selected strategies are aligned, helping reduce noise and improve decision-making. PLEASE CONTACT ME AFTER PURCHASE TO GET
The Propfolio Master Suite is the ultimate all-in-one analytical workstation for professional traders. Combining the power of the Beat The Market Maker (BTMM) methodology, Smart Money Concepts (SND/Liquidity), and Advanced Volume Profile, this suite replaces multiple different indicators with one optimized engine. Monitor up to 14 pairs simultaneously from a single chart, instantly identify market cycles, and seamlessly map institutional footprints with the click of a button. The Command Center
Scalper Inside PRO
Alexey Minkov
4.74 (69)
Scalper Inside PRO Scalper Inside PRO is an intraday trend and scalping indicator for MetaTrader 4 that uses an exclusive algorithm to quickly detect market direction and key target levels. It automatically calculates entry, exit and multiple profit targets, and shows detailed performance statistics so you can see how different instruments and strategies performed. This helps you choose the most suitable trading instruments for the current market conditions. Additionally, you can easily integrat
M1 Sniper
Oleg Rodin
5 (23)
M1 SNIPER est un système d'indicateurs de trading facile à utiliser. Il s'agit d'un indicateur à flèche conçu pour l'unité de temps M1. Cet indicateur peut être utilisé seul pour le scalping sur l'unité de temps M1 ou intégré à votre système de trading existant. Bien que conçu spécifiquement pour le trading sur l'unité de temps M1, ce système peut également être utilisé avec d'autres unités de temps. Initialement, j'avais conçu cette méthode pour le trading du XAUUSD et du BTCUSD. Cependant, je
PZ Harmonacci Patterns
PZ TRADING SLU
3.17 (6)
Trade smarter, not harder: Empower your trading with Harmonacci Patterns This is arguably the most complete harmonic price formation auto-recognition indicator you can find for the MetaTrader Platform. It detects 19 different patterns, takes fibonacci projections as seriously as you do, displays the Potential Reversal Zone (PRZ) and finds suitable stop-loss and take-profit levels. [ Installation Guide | Update Guide | Troubleshooting | FAQ | All Products  ] It detects 19 different harmonic pric
Le système PRO Renko est un système de trading très précis spécialement conçu pour le trading de graphiques RENKO. Il s'agit d'un système universel qui peut être appliqué à divers instruments de négociation. Le système neutralise efficacement ce qu'on appelle le bruit du marché en vous donnant accès à des signaux d'inversion précis. L'indicateur est très facile à utiliser et n'a qu'un seul paramètre responsable de la génération du signal. Vous pouvez facilement adapter l'outil à n'importe que
Auto Optimized Parabolic RSI : Moteur de Momentum 3D Avancé La plupart des indicateurs pour les particuliers échouent car ils s'appuient sur des paramètres statiques qui se brisent dès que la volatilité du marché change. L'Auto Optimized Parabolic RSI résout le problème de l'« obsolescence des indicateurs » en recalculant continuellement son propre avantage mathématique, apportant une adaptation quantitative de niveau institutionnel directement sur votre terminal MT5. L'Avantage Principal : Opti
NAM Order Blocks
NAM TECH GROUP, CORP.
3.67 (3)
MT4 Multi-timeframe Order Blocks detection indicator. Features - Fully customizable on chart control panel, provides complete interaction. - Hide and show control panel wherever you want. - Detect OBs on multiple timeframes. - Select OBs quantity to display. - Different OBs user interface. - Different filters on OBs. - OB proximity alert. - ADR High and Low lines. - Notification service (Screen alerts | Push notifications). Summary Order block is a market behavior that indicates order collection
Quants HL Break
Ferhat Mutlu
5 (2)
Calcul avancé effectué par l'action pure des prix pour trouver les cassures LH et HL. Cela vous donnera d'excellents points d'inversion sur le marché.Les signaux LH et HL peuvent également être utilisés pour les évasions de traingle. Une fois que la cassure se produit, cela indique un fort renversement.Beau filtre pour les moyennes mobiles.Je suggère fortement de l'utiliser avec des indicateurs de tendance. Peut être utilisé comme une confirmation supplémentaire pour le support et la résistanc
Dynamic Forex28 Navigator
Bernhard Schweigert
4.43 (7)
Dynamic Forex28 Navigator - L'outil de trading Forex de nouvelle génération. ACTUELLEMENT 49 % DE RÉDUCTION. Dynamic Forex28 Navigator est l'évolution de nos indicateurs populaires de longue date, combinant la puissance de trois en un : Advanced Currency Strength28 Indicator (695 avis) + Advanced Currency IMPULSE avec ALERT (520 avis) + CS28 Combo Signals (Bonus). Détails sur l'indicateur https://www.mql5.com/en/blogs/post/758844 Qu'offre l'indicateur de force de nouvelle génération ? Tout
RFI levels PRO
Roman Podpora
5 (1)
L'indicateur montre avec précision les points de retournement et les zones de retour des prix où le       Acteurs majeurs   . Vous repérez les nouvelles tendances et prenez des décisions avec une précision maximale, en gardant le contrôle de chaque transaction. VERSION MT5     -     Révèle son potentiel maximal lorsqu'il est combiné à l'indicateur   TREND LINES PRO Ce que l'indicateur montre : Structures et niveaux d'inversion avec activation au début d'une nouvelle tendance. Affichage des nive
Trend Catcher ind
Ramil Minniakhmetov
INDICATEUR DE DÉTECTEUR DE TENDANCE L'indicateur de détecteur de tendance analyse les mouvements de prix du marché grâce à une combinaison d'indicateurs d'analyse de tendance adaptatifs, propriétaires et personnalisés. Il identifie la véritable direction du marché en filtrant les fluctuations à court terme et en se concentrant sur la force de la dynamique sous-jacente, l'expansion de la volatilité et la structure des prix. Il utilise également une combinaison d'indicateurs personnalisés de lis
Apollo SR Master est un indicateur de support/résistance doté de fonctionnalités spéciales qui simplifient et fiabilisent le trading basé sur les zones de support/résistance. Cet indicateur calcule ces zones en temps réel, sans aucun décalage, en détectant les sommets et les creux locaux des prix. Pour confirmer la nouvelle zone de support/résistance, il affiche un signal spécifique indiquant que cette zone peut être prise en compte et utilisée comme un véritable signal d'achat ou de vente. Dans
Si vous achetez cet indicateur, vous recevrez mon Gestionnaire de Trading Professionnel   + EA  GRATUITEMENT. Tout d'abord, il convient de souligner que ce système de trading est un indicateur non repeint, non redessiné et non retardé, ce qui le rend idéal pour le trading manuel et automatisé. Cours en ligne, manuel et téléchargement de préréglages. Le "Système de Trading Smart Trend MT5" est une solution de trading complète conçue pour les traders débutants et expérimentés. Il combine plus de
Signal GoldRush Trend Arrow L'indicateur GoldRush Trend Arrow Signal fournit une analyse précise et en temps réel des tendances, spécialement conçue pour les scalpers à haute vitesse et à court terme sur la paire XAU/USD. Conçu spécialement pour les intervalles de temps d'une minute, cet outil affiche des flèches directionnelles indiquant clairement les points d'entrée, ce qui permet aux scalpers de naviguer en toute confiance dans des conditions de marché volatiles. L'indicateur se compose
Introduction to Fractal Pattern Scanner Fractal Indicator refers to the technical indicator that makes use of the fractal geometry found in the financial market. Fractal Pattern Scanner is the advanced Fractal Indicator that brings the latest trading technology after the extensive research and development work in the fractal geometry in the financial market. The most important feature in Fractal Pattern Scanner is the ability to measure the turning point probability as well as the trend probabi
ACTUELLEMENT 40% DE RÉDUCTION La meilleure solution pour tout débutant ou trader expert ! Cet indicateur est un outil de trading unique, de haute qualité et abordable car nous avons incorporé un certain nombre de caractéristiques exclusives et une nouvelle formule. Avec seulement UN graphique, vous pouvez lire la force de la devise pour 28 paires Forex ! Imaginez comment votre trading va s'améliorer parce que vous êtes capable de repérer le point de déclenchement exact d'une nouvelle tendance
Market Structure Patterns MT4
Samuel Manoel De Souza
5 (18)
Market Structure Patterns   est un indicateur basé sur les   Smart Money Concepts   qui affiche les   éléments SMC/ICT   pouvant améliorer vos décisions de trading. Profitez des   alertes ,   notifications push   et   emails   pour être informé lorsqu’un élément se forme sur le graphique, que le prix franchit un niveau et/ou entre dans une zone. Les développeurs peuvent accéder aux valeurs des éléments de l’indicateur via les   variables globales , permettant l’automatisation des décisions de tr
Advanced Supply Demand
Bernhard Schweigert
4.91 (300)
Offre spéciale : 40 % de réduction La solution idéale pour les traders débutants comme experts ! Cet indicateur est un outil de trading unique, performant et abordable grâce à l’intégration de nombreuses fonctionnalités exclusives et d’une nouvelle formule. Cette mise à jour vous permet d’afficher des zones sur deux unités de temps. Vous pourrez ainsi visualiser non seulement une unité de temps supérieure, mais aussi l’unité de temps du graphique, ainsi que l’unité de temps supérieure : des z
Advanced UT BOT ALERTS for MT4 Système professionnel de détection de tendance multi-filtres | Version améliorée du moteur UT BOT Nous proposons uniquement des indicateurs de haute qualité. Advanced UT BOT est conçu pour un usage professionnel, avec une logique de signal stable et un calcul sécurisé qui évite tout retard ou mise à jour erronée. Il ne redessine, ne supprime ni ne modifie aucun signal passé. Tous les signaux BUY et SELL sont générés uniquement après la clôture de la bougie , garant
Contactez-moi après l'achat pour obtenir un EA en bonus basé sur cet indicateur. La Self Optimizing Double MA Strategy est un outil de trading de niveau professionnel conçu pour éliminer les approximations de paramètres. Propulsé par un moteur d'auto-optimisation intégré, il s'adapte continuellement aux conditions changeantes du marché en simulant des milliers de combinaisons de paramètres en arrière-plan afin de maintenir un avantage statistique. Au lieu de s'appuyer sur des paramètres statiqu
Si vous tradez sur le marché du Forex, disposer d'informations détaillées sur la force des devises et la corrélation entre les paires de devises peut élever votre trading à un niveau supérieur. La corrélation vous aidera à réduire votre risque de moitié, tandis que l'analyse de la force maximisera vos profits. Cet indicateur propose une approche hybride pour sélectionner les paires de devises les plus appropriées en combinant l'analyse de la force des devises et la corrélation des paires. Comme
CRT Candle Range Theory HTF MT4.   Ultimate CRT Indicator: Advanced ICT Concepts and Malaysian SnR Trading System Discounted   Price   $50  !!     Secure your lifetime access   now   before it switches to   subscription-only ! Master the Market Maker's Footprints with the Most Advanced Candle Range Theory Indicator Unlock the true power of   Smart Money Concepts (SMC)   and trade precisely like the institutions with the   Ultimate CRT Indicator . Built exclusively for serious traders, this indic
Day Trader Master est un système de trading complet pour les day traders. Le système se compose de deux indicateurs. Un indicateur est un signal fléché pour acheter et vendre. C'est l'indicateur de flèche que vous obtenez. Je vous fournirai le deuxième indicateur gratuitement. Le deuxième indicateur est un indicateur de tendance spécialement conçu pour être utilisé conjointement avec ces flèches. LES INDICATEURS NE RÉPÉTENT PAS ET NE TARDENT PAS! L'utilisation de ce système est très simple. Il v
KURAMA GOLD SIGNAL PRO (MT4) — Système de Trading XAUUSD Complet avec Filtre à 7 Couches, TP/SL Automatique et Notation de Qualité PAS DE REPAINT. PAS DE REDESSIN. PAS DE RETARD. Chaque signal est permanent. Ce que vous voyez est ce que vous obtenez. BONUS : Achetez la licence à vie et recevez AI Zone Radar (valeur $59) + manuel PDF complet GRATUIT. Envoyez-moi un message après l'achat. AI Zone Radar : https://www.mql5.com/en/market/product/175834 CONFIANCE DES TRADERS : Déjà utilisé par une
L'indicateur « Dynamic Scalper System » est conçu pour la méthode de scalping, permettant de trader au sein des vagues de tendance. Testé sur les principales paires de devises et l'or, il est compatible avec d'autres instruments de trading. Fournit des signaux pour l'ouverture de positions à court terme le long de la tendance, avec un support supplémentaire pour les fluctuations de prix. Principe de l'indicateur : De grandes flèches déterminent la direction de la tendance. Un algorithme de gén
Master head and shoulders patterns for better trading decisions A head and shoulders pattern is a chart formation that resembles a baseline with three peaks, the outside two are close in height and the middle is highest. It predicts a bullish-to-bearish trend reversal and is believed to be one of the most reliable trend reversal patterns. It is one of several top patterns that signal, with varying degrees of accuracy, that a trend is nearing its end. [ Installation Guide | Update Guide | Trouble
PZ Double Top Bottom
PZ TRADING SLU
5 (1)
Trade double tops and bottoms effectively The PZ Double Top/Bottom Indicator is a technical analysis tool that helps traders identify potential price reversal patterns in the market. These patterns, known as double tops and bottoms, are characterized by two consecutive peaks or valleys in the price of an asset. Double tops and bottoms are often seen as potential reversal patterns because they can signal a change in the direction of the current trend. [ Installation Guide | Update Guide | Troubl
Apex Break PRO est un indicateur de rupture de lignes de tendance par pivots sans repeinture pour MetaTrader 4. Il détecte les hauts de pivot et les bas de pivot, trace des lignes de tendance dynamiques inclinées entre des pivots consécutifs et génère des signaux d'achat et de vente lorsque le prix franchit ces lignes de tendance lors de la clôture confirmée d'une bougie. Chaque signal est filtré à travers jusqu'à quatre couches de confluence indépendantes — tendance EMA, limites RSI, détection
Plus de l'auteur
DisconnectionSaver
Vladimir Liubchenko
This specific indicator is designed to solve one specific problem : In case the connection to the broker's server is lost, remember when the connection was lost, and at what time the connection was resumed. Thus, the user sees the time when there was no connection to the broker's server . An Alert box is displayed on the screen, which records when the connection was lost and resumed. Of course, the indicator will not react to slight losses of packets. For better visualization of the indicator op
Filtrer:
Aucun avis
Répondre à l'avis