Gaussian Trend Bands and Turns
- Indicateurs
- Version: 1.40

Gaussian Trend Bands and Turns
Gaussian Trend Bands and Turns is a MetaTrader 5 chart indicator combining a Gaussian-weighted smoothing line, symmetrical bands and closed-candle direction-change arrows.
How it works
The center line uses the selected price from the current bar and the preceding 499 bars, weighted by a Gaussian kernel. It changes color according to its slope.
Two band modes are available:
- Standard deviation: upper and lower bands use the Gaussian-weighted standard deviation of prices around the center line, scaled by BandMultiplier.
- Fixed points: upper and lower bands remain FixedBandPoints times the symbol's point size above and below the center line. The same distance applies to both sides. BandMultiplier is not used in this mode.
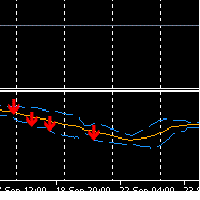
An upward arrow appears below a closed candle when the center-line slope turns positive after a non-positive slope. A downward arrow appears above a closed candle when the slope turns negative after a non-negative slope. Arrows are placed on the confirming candle, not on an earlier candle. The current unfinished candle does not display an arrow.
Calculation behavior
Only current and past prices are used. The current candle's line and bands can change with incoming ticks. Closed-bar values remain stable when settings and the underlying price history are unchanged. Changes in settings or broker history can cause recalculation. There is no repainting-mode option.
Inputs
Bandwidth: Gaussian weighting bandwidth; default 8.0, greater than zero.
Source: applied price; default Close.
UpColor / DownColor: center-line and arrow colors.
ShowBands: show or hide both bands.
BandMode: standard deviation or fixed points.
FixedBandPoints: distance from the center line to EACH band in broker points; default 100. A point is not necessarily a pip.
BandMultiplier: standard-deviation multiplier; default 2.0.
BandColor: color of both band lines.
Usage
Attach the indicator to a MetaTrader 5 chart. At least 500 bars are required for the first center-line and band value; direction-change arrows require additional completed bars. The oldest 499 bars do not have a complete calculation window.
This indicator is a visual analysis tool. It does not place trades or send alerts. Arrows indicate slope changes and do not guarantee profitable entries.
Technical integration
Buffer 0: center line.
Buffer 1: line color index.
Buffer 2: upward arrows.
Buffer 3: downward arrows.
Buffer 4: upper band.
Buffer 5: lower band.
Check for EMPTY_VALUE before using a buffer value. Use closed candles for confirmed readings.
The chart's internal indicator label remains Nadaraya-Watson. Published package version: 1.40.