TradeMasterPro
- Utilitaires
- Version: 4.18

TradeMaster Pro V4.18 TradeMasterPro
A lightweight chart-management utility that replaces three separate tools with one invisible indicator.
⚙️ PRECISE MOUSE-WHEEL ZOOM (X + Y Axes)
- Horizontal zoom — smooth, step-by-step bar scaling ( CHART_SCALE 0–5). Fractional sensitivity is accumulated internally, so even a 0.1× multiplier works reliably on any mouse (including free-spin wheels).
- Vertical zoom — when Scale Fix is active, the wheel zooms the price axis around its center instead of scrolling bars.
- Both sensitivities are fully adjustable: X: 0.1–2.0, Y: 0.01–0.5.
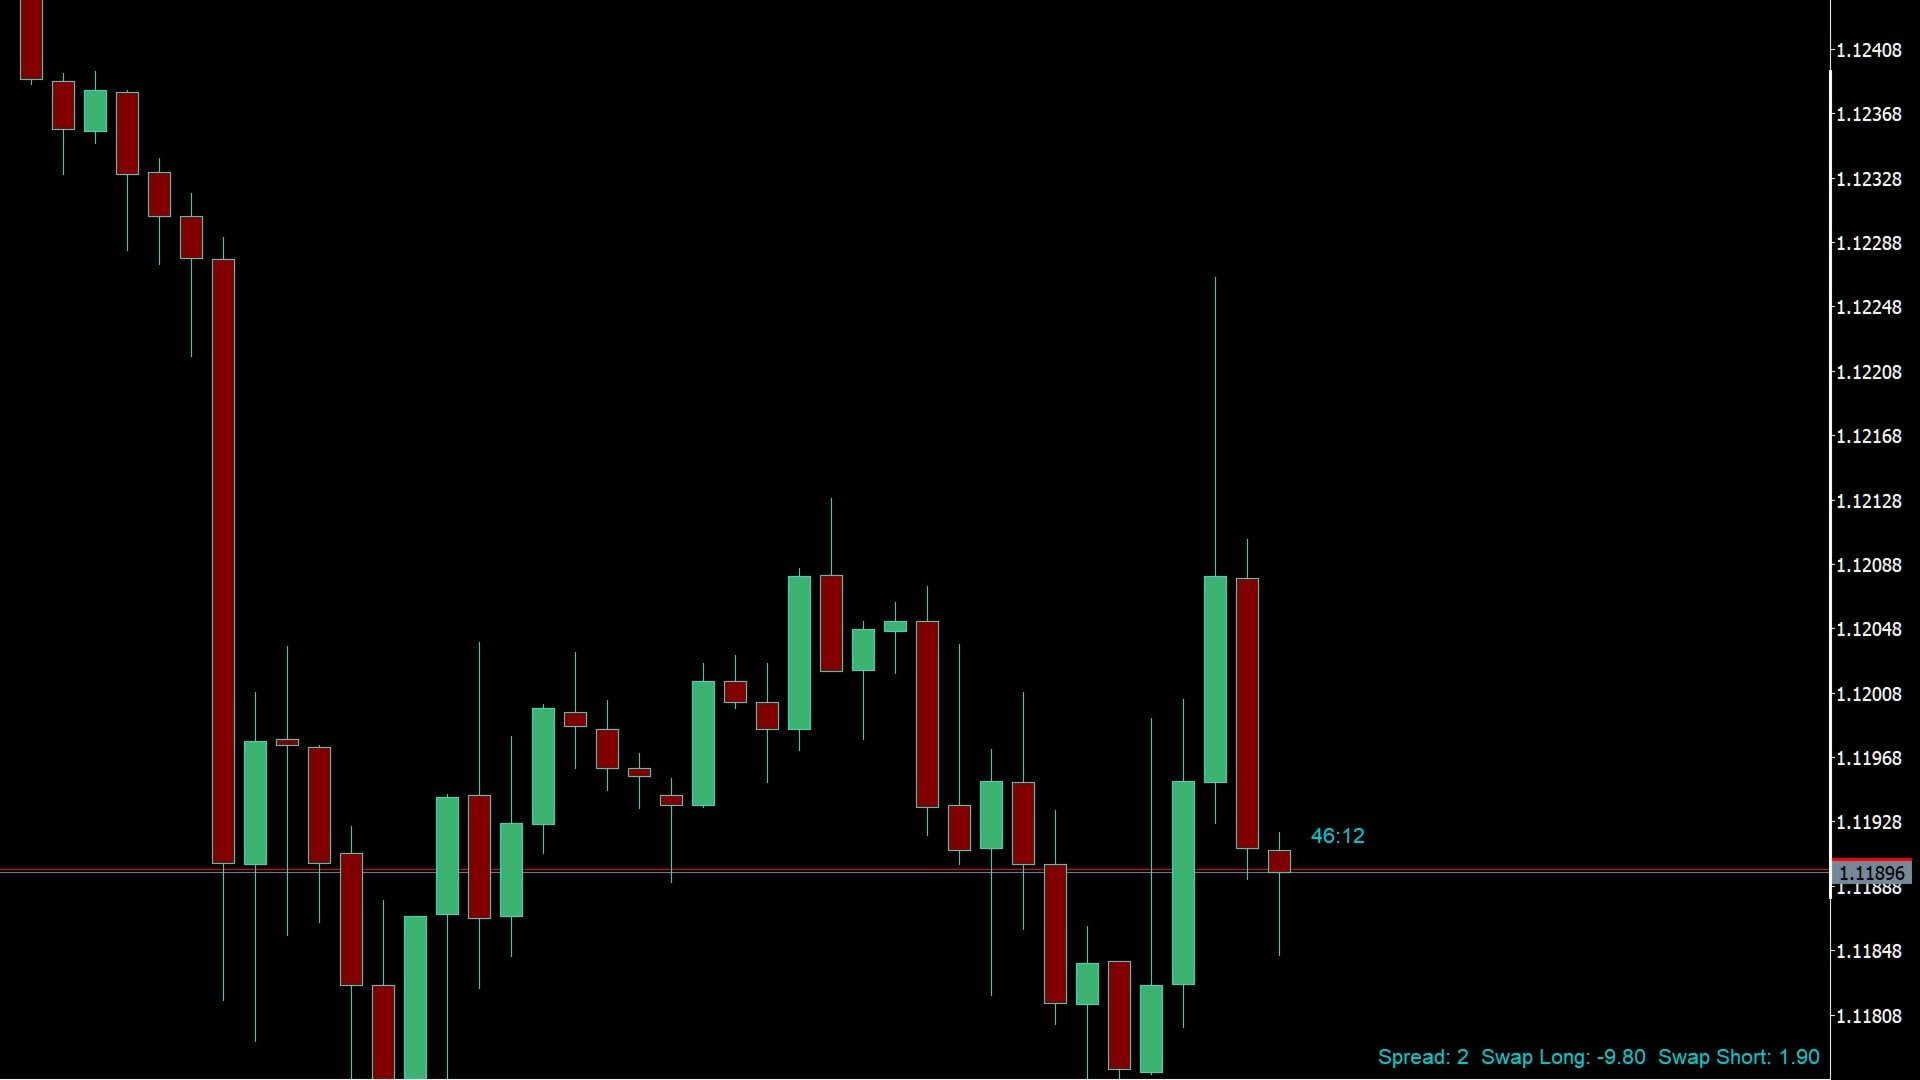
⏱️ CANDLE COUNTDOWN TIMER
- Shows time remaining until the current candle closes.
- Auto-format: MM:SS for intraday TFs, HH:MM for H4+.
- Double-click the timer text to hide/show — no extra buttons cluttering your chart. Hidden state keeps a small "—:—" placeholder so you can double-click to restore it.
📊 SPREAD & SWAP INFO LABEL
- Displays real-time Spread, Swap Long, and Swap Short in the corner you choose (4 corners available).
- Uses native OBJPROP_CORNER + ANCHOR — pixel-perfect placement on any resolution, no text-width estimation.
🔒 SCALE FIX (F KEY)
- One press of the F key toggles CHART_SCALEFIX on/off.
- When enabled, the Y-range is locked to visible candles so your wheel zooms vertically instead of scrolling bars.
🛡️ ROBUST BY DESIGN
- Auto re-subscribes to mouse-wheel events after every chart rebuild (TF change, resize, symbol switch, indicator reload).
- Mouse-scroll mode is restored on removal — never leaves your chart in a broken state.
- Scroll state is persisted in a terminal global variable keyed by ChartID() , surviving timeframe switches.
Controls
| Action | How |
|---|---|
| Horizontal zoom | Mouse wheel |
| Vertical zoom (price axis) | Mouse wheel while Scale Fix is ON |
| Toggle Scale Fix | Press F key |
| Show / Hide timer | Double-click the timer text |
Input Parameters
| Parameter | Default | Description |
|---|---|---|
| Corner | RIGHT_LOWER | Screen corner for the info label (4 options) |
| FontSize | 8 | Text font size |
| FontName | Arial | Font family |
| TextColor | DarkTurquoise | Label & timer text color |
| XOffset / YOffset | 10 / 10 | Pixel gap from the selected corner |
| CountdownYOffset | 5 | Vertical offset of timer above candle high |
| TimerEnabledByDefault | true | Show timer on load |
| HiddenTimerColor | DimGray | Color of "—:—" placeholder when hidden |
| ScaleFixEnabledByDefault | true | Activate Scale Fix on load |
| ScaleXSensitivity | 1.0 | Horizontal zoom speed (range: 0.1 – 2.0) |
| ScaleYSensitivity | 0.1 | Vertical zoom speed (range: 0.01 – 0.5) |
FAQ
Q: Mouse wheel stops working after timeframe change?
A: The utility auto re-subscribes via OnTimer + CHARTEVENT_CHART_CHANGE . If it persists, update your terminal to build 4000+.
A: The utility auto re-subscribes via OnTimer + CHARTEVENT_CHART_CHANGE . If it persists, update your terminal to build 4000+.
Q: How do I disable Scale Fix?
A: Press the F key. The utility removes CHART_SCALEFIX automatically.
A: Press the F key. The utility removes CHART_SCALEFIX automatically.
Q: Timer shows "—:—" in gray — is that a bug?
A: No, it's the hidden state. Double-click to restore.
A: No, it's the hidden state. Double-click to restore.
Q: Do settings reset on TF switch?
A: No. CHART_MOUSE_SCROLL state is saved in a GlobalVariable keyed by ChartID() and restored on reload.
A: No. CHART_MOUSE_SCROLL state is saved in a GlobalVariable keyed by ChartID() and restored on reload.