Bollinger Bands Scanner Dash Volatility Breakout

OVERVIEW
The Bollinger Bands Breakout Scanner Dashboard is a comprehensive technical analysis and monitoring utility designed for MetaTrader 5. Its primary purpose is to scan multiple financial instruments across various timeframes simultaneously to identify potential price breakouts based on the standard Bollinger Bands indicator. This software is built as an interactive dashboard that continuously evaluates market data, processes multi-layered technical filters, calculates dynamic risk parameters using the Average True Range (ATR), and alerts the user when specific technical conditions are met. This tool does not execute automated trades; it functions strictly as a visual and analytical aid for manual trading operations.

OPERATING PRINCIPLE AND CORE ALGORITHM
The foundational algorithm of this scanner relies on the Bollinger Bands volatility indicator. The system evaluates the position of the closing price relative to the upper and lower bands to generate directional signals.
Buy Signal Logic: A bullish breakout signal is triggered when the previous candle's open price is below the Upper Bollinger Band, and its closing price crosses and closes above the Upper Bollinger Band.
Sell Signal Logic: A bearish breakout signal is triggered when the previous candle's open price is above the Lower Bollinger Band, and its closing price crosses and closes below the Lower Bollinger Band.
Signal Validity and Calculation: All primary entry signals are calculated strictly on closed bars (Bar 1). This ensures that the core Bollinger Bands breakout signal is fixed and does not repaint or shift after the candle has closed. If the Fibonacci filter is activated, users should note that it relies on a ZigZag formation which dynamically updates swing points.
Stop Loss and Take Profit Logic: Risk parameters are dynamically calculated using the ATR indicator. The Stop Loss (SL) distance is determined by multiplying the ATR value by a user-defined coefficient. Take Profit 1 (TP1) and Take Profit 2 (TP2) are calculated based on a proportional Risk-to-Reward ratio relative to the Stop Loss distance.

KEY FEATURES AND DASHBOARD INTERFACE
Multi-Symbol and Multi-Timeframe Scanning: The dashboard can process up to 15 symbols and multiple timeframes simultaneously, presenting the data in a unified matrix.
Comprehensive 17-Layer Filtering System: The tool includes 17 optional technical filters (RSI, ADX, Moving Averages, Ichimoku, Awesome Oscillator, Parabolic SAR, Heiken Ashi, CCI, RVI, MACD, Support/Resistance, and Fibonacci). Users can enable or disable these filters to refine signal generation based on their specific analytical requirements.
Interactive Graphical User Interface (GUI): The panel displays vital metrics including Pair, Timeframe, Direction, Signal Time, Entry Price, SL, TP1, TP2, Band Value, and Signal Age. Clicking the 'OPEN' button instantly switches the active chart to the corresponding pair and timeframe.
Visual Chart Plotting: When a signal is selected, the utility automatically plots visual elements on the chart, including entry arrows and dashed lines indicating the exact SL and TP levels.
Alert Mechanisms: Supports terminal pop-up alerts, sound notifications, push notifications to mobile devices, and email alerts.
Color Coding Interpretation: Green text/elements indicate a bullish condition or Buy signal. Red text/elements indicate a bearish condition or Sell signal. Muted gray/blue colors indicate neutral states, inactive elements, or unfulfilled conditions.

PERFORMANCE OPTIMIZATION AND CPU USAGE
Scanning multiple symbols and timeframes with 17 indicators can consume significant CPU and memory resources. To maintain optimal terminal performance:
- Adjust the 'Max pairs to process' parameter to a reasonable limit (e.g., 10-15 pairs).
- Increase the 'Scan interval' to 7-10 seconds to reduce the frequency of recalculations.
- Limit 'Bars analyzed per TF' to the minimum required for your strategy to avoid excessive historical array processing.

OPERATION AND SETUP RECOMMENDATIONS
Recommended Instruments: Major and minor currency pairs with sufficient liquidity (e.g., EURUSD, GBPUSD, USDJPY, XAUUSD).
Recommended Timeframes: M15, M30, H1, H4, and D1.
Account Requirements: Suitable for both Hedging and Netting account types. A low spread ECN account is recommended for optimal entry conditions. Latency is not highly critical as the scanner operates on closed bars, but a stable VPS ensures uninterrupted scanning and alert delivery.

INPUT PARAMETERS LIST

=== Scanner Settings ===
InpSymbols (Default: "EURUSD,GBPUSD,USDJPY,AUDUSD,USDCAD,USDCHF,NZDUSD,EURJPY,GBPJPY,XAUUSD") -> Comma-separated list of symbols to scan. Leave empty to scan the Market Watch.
InpTimeframes (Default: "M5,M15,M30,H1,H4") -> Comma-separated list of timeframes to evaluate.
InpUseWatch (Default: true) -> If true, the system ignores InpSymbols and scans all visible pairs in the Market Watch window.
InpMaxSymbols (Default: 15) -> The maximum number of symbols to process to prevent terminal lag.
InpScanSec (Default: 7) -> The interval in seconds between each scanning cycle.
InpBarsCopy (Default: 120) -> The number of historical bars to copy into memory for indicator calculation.
InpLookback (Default: 100) -> The maximum number of historical bars to check for the most recent breakout signal.
InpDirection (Default: 0) -> Filter signals by direction. 0 = Both, 1 = Buy only, 2 = Sell only.

=== Bollinger Bands Entry Settings ===
InpBBPeriod (Default: 20) -> The averaging period for the Bollinger Bands calculation.
InpBBDeviation (Default: 0.5) -> The standard deviation multiplier for the upper and lower bands.
InpBBPrice (Default: PRICE_CLOSE) -> The applied price used for the Bollinger Bands calculation.

=== ATR SL & TP Settings ===
InpATRPeriod (Default: 14) -> The averaging period for the Average True Range indicator.
InpATRMultSL (Default: 1.5) -> The multiplier applied to the ATR value to calculate the Stop Loss distance.
InpTP1_RR (Default: 1.0) -> The Risk-to-Reward ratio for Take Profit 1 (e.g., 1.0 equals 1:1 RR).
InpTP2_RR (Default: 2.0) -> The Risk-to-Reward ratio for Take Profit 2 (e.g., 2.0 equals 1:2 RR).

=== FILTER: RSI CROSS ===
Use_RSI_Cross_Filter (Default: false) -> Enables the RSI crossover logic filter.
RSI_Length (Default: 14) -> The period for the RSI calculation.
RSI_Price_Source (Default: PRICE_CLOSE) -> The applied price for the RSI.
Oversold (Default: 30.0) -> The lower boundary limit for the RSI filter.
Overbought (Default: 70.0) -> The upper boundary limit for the RSI filter.

=== FILTER: ADX ===
Use_ADX_Filter (Default: false) -> Enables the Average Directional Movement Index trend strength filter.
ADX_Period (Default: 10) -> The calculation period for the ADX.
ADX_Min_Level (Default: 20.0) -> The minimum ADX value required to validate a signal.

=== FILTER: SINGLE MA ===
Use_MA_Filter (Default: true) -> Enables the single Moving Average trend filter.
MA_Period (Default: 50) -> The averaging period for the MA.
MA_Method (Default: MODE_EMA) -> The smoothing method for the MA.
MA_Applied (Default: PRICE_CLOSE) -> The applied price for the MA.
MA_Shift (Default: 0) -> The horizontal shift of the MA.

=== FILTER: ICHIMOKU SENKOU SPAN B ===
Use_Ichimoku_Filter (Default: false) -> Enables the Ichimoku Kinko Hyo cloud filter.
Ichimoku_SenkouB (Default: 52) -> The calculation period for Senkou Span B.
Ichimoku_Shift (Default: 26) -> The horizontal displacement for the Ichimoku cloud.

=== FILTER: RSI 75 ===
Use_RSI75_Filter (Default: false) -> Enables a secondary long-period RSI baseline filter.
RSI_Filter_Period (Default: 75) -> The calculation period for the secondary RSI.
RSI_Filter_Price (Default: PRICE_CLOSE) -> The applied price for the secondary RSI.

=== FILTER: DOUBLE MA ===
Use_DoubleMA_Filter (Default: false) -> Enables the dual Moving Average crossover trend filter.
MA_A_Period (Default: 30) -> The period for the fast MA.
MA_A_Method (Default: MODE_EMA) -> The smoothing method for the fast MA.
MA_A_Applied (Default: PRICE_CLOSE) -> The applied price for the fast MA.
MA_A_Shift (Default: 0) -> The horizontal shift for the fast MA.
MA_B_Period (Default: 140) -> The period for the slow MA.
MA_B_Method (Default: MODE_EMA) -> The smoothing method for the slow MA.
MA_B_Applied (Default: PRICE_CLOSE) -> The applied price for the slow MA.
MA_B_Shift (Default: 0) -> The horizontal shift for the slow MA.

=== FILTER: AWESOME OSCILLATOR ===
Use_AO_Filter (Default: false) -> Enables the Awesome Oscillator filter.
Use_AO_Volume_Filter (Default: false) -> Mandates that AO momentum must exceed defined volume thresholds.
AO_Buy_Min (Default: 4.0) -> The minimum positive AO value for buy signals.
AO_Sell_Max (Default: -4.0) -> The maximum negative AO value for sell signals.
Use_AO_Color_Filter (Default: false) -> Mandates that AO histogram color aligns with the signal direction.
Use_AO_Zero_Filter (Default: false) -> Mandates that the AO must be above zero for buys and below zero for sells.

=== FILTER: PARABOLIC SAR ===
Use_SAR_Filter (Default: false) -> Enables the Parabolic Stop and Reverse filter.
SAR_Step (Default: 0.02) -> The step increment value for the SAR calculation.
SAR_Maximum (Default: 0.2) -> The maximum limit value for the SAR calculation.

=== FILTER: HEIKEN ASHI ===
Use_HeikenAshi_Filter (Default: false) -> Validates signals based on the color/direction of the calculated Heiken Ashi candle.

=== FILTER: CCI TREND ===
Use_CCI_Filter (Default: false) -> Enables the Commodity Channel Index trend filter (above/below zero).
CCI_Period (Default: 50) -> The averaging period for the CCI.
CCI_Applied (Default: PRICE_CLOSE) -> The applied price for the CCI.

=== FILTER: CCI OB & OS ===
Use_CCI_OBOS_Filter (Default: false) -> Enables the Commodity Channel Index overbought/oversold filter.
CCI_OBOS_Period (Default: 14) -> The calculation period for the secondary CCI.
CCI_OBOS_Applied (Default: PRICE_CLOSE) -> The applied price for the secondary CCI.
CCI_Overbought (Default: 100.0) -> The upper boundary threshold for the CCI.
CCI_Oversold (Default: -100.0) -> The lower boundary threshold for the CCI.

=== FILTER: RVI TREND ===
Use_RVI_Filter (Default: false) -> Enables the Relative Vigor Index trend filter.
RVI_Period (Default: 75) -> The calculation period for the RVI.

=== FILTER: RVI SIGNAL ===
Use_RVI_Signal_Filter (Default: false) -> Enables the RVI main line and signal line crossover filter.
RVI_Signal_Period (Default: 20) -> The calculation period for the RVI crossover check.

=== FILTER: MACD SIGNAL ===
Use_MACD_Filter (Default: false) -> Enables the MACD histogram and signal line difference filter.
MACD_FastEMA (Default: 12) -> The period for the fast Exponential Moving Average.
MACD_SlowEMA (Default: 26) -> The period for the slow Exponential Moving Average.
MACD_SignalSMA (Default: 9) -> The period for the signal Simple Moving Average.
MACD_Applied (Default: PRICE_CLOSE) -> The applied price for the MACD.

=== FILTER: MACD LEV 0 ===
Use_MACD_Zero_Filter (Default: false) -> Mandates that the main MACD line must be on the correct side of the zero baseline.

=== FILTER: SUPPORT & RESISTANCE ===
Use_SR_Filter (Default: true) -> Enables the automated Support and Resistance proximity filter.
SR_Period (Default: 50) -> The lookback period in bars to determine the highest high and lowest low.
SR_Zone_Points (Default: 100) -> The tolerance zone size in points to validate a bounce or touch of the SR levels.

=== FILTER: FIBONACCI ===
Use_Fib_Filter (Default: false) -> Enables the Fibonacci retracement zone filter based on ZigZag swings.
Fib_Level_1 (Default: 0.382) -> The primary Fibonacci retracement boundary.
Fib_Level_2 (Default: 0.618) -> The secondary Fibonacci retracement boundary.
ZigZag_Depth (Default: 12) -> The depth parameter for the underlying ZigZag algorithm determining the swing points.
ZigZag_Deviation (Default: 5) -> The deviation parameter for the ZigZag algorithm.
ZigZag_Backstep (Default: 3) -> The backstep parameter for the ZigZag algorithm.

=== Alert & Notifications ===
InpAlertPopup (Default: false) -> Activates terminal pop-up window alerts.
InpAlertSound (Default: false) -> Activates terminal audio alerts.
InpSoundFile (Default: "alert2.wav") -> The specific audio file name to play for sound alerts.
InpAlertPush (Default: false) -> Activates push notifications sent to the MetaQuotes ID mobile application.
InpAlertEmail (Default: false) -> Activates email alerts sent via the terminal's SMTP configuration.
InpEmailSubject (Default: "BB Breakout Signal") -> The subject line text for outgoing email alerts.
InpAlertOnlyNew (Default: false) -> If true, the system will only trigger alerts for newly formed bar signals, ignoring older historical signals upon initialization.

=== Display & Layout ===
InpX (Default: 12) -> The initial horizontal X-axis coordinate for the dashboard.
InpY (Default: 28) -> The initial vertical Y-axis coordinate for the dashboard.
InpScale (Default: 100) -> The magnification scale percentage of the GUI (minimum 70, maximum 180).
InpRowH (Default: 18) -> The height of each data row in pixels.
InpFont (Default: 8) -> The base font size for text elements inside the dashboard.
InpPadX (Default: 8) -> The internal left padding size in pixels.
InpWPair (Default: 68) -> The width of the Pair column in pixels.
InpWTF (Default: 34) -> The width of the Timeframe column in pixels.
InpWArah (Default: 44) -> The width of the Direction column in pixels.
InpWTime (Default: 96) -> The width of the Signal Time column in pixels.
InpWEntry (Default: 64) -> The width of the Entry Price column in pixels.
InpWSL (Default: 64) -> The width of the Stop Loss column in pixels.
InpWTP1 (Default: 64) -> The width of the Take Profit 1 column in pixels.
InpWTP2 (Default: 64) -> The width of the Take Profit 2 column in pixels.
InpWBand (Default: 58) -> The width of the Bollinger Band value column in pixels.
InpWUmur (Default: 42) -> The width of the Signal Age column in pixels.
InpWOpen (Default: 44) -> The width of the Open Chart button column in pixels.
InpShowEmpty (Default: false) -> If true, displays symbols and timeframes on the dashboard even when no valid signal is currently detected.
InpMaxRows (Default: 18) -> The maximum number of visible rows rendered on the dashboard to control screen usage.

=== Sorting ===
InpSortBy (Default: SORT_TIME) -> Determines the default sorting column structure (Time, Pair, Timeframe, or Direction).
InpSortNewest (Default: true) -> If true, sorts data in descending order, displaying the most recent signals at the top.

=== Draw Signal On Current Chart ===
InpDrawOnChart (Default: true) -> If true, the utility draws graphical elements on the active chart corresponding to the selected signal.
InpShowArrow (Default: true) -> Enables the rendering of directional entry arrows on the chart.
InpShowLevels (Default: true) -> Enables the rendering of horizontal dashed lines representing the SL, TP1, and TP2 targets.
InpExtendBars (Default: 30) -> Determines how many future bars the horizontal target lines will extend across the chart.
InpArrowCodeBuy (Default: 233) -> The Wingdings font code character used for the bullish entry arrow.
InpArrowCodeSell (Default: 234) -> The Wingdings font code character used for the bearish entry arrow.
InpArrowSize (Default: 2) -> The graphical size multiplier of the entry arrows.
InpArrowDistance (Default: 15) -> The offset distance in points from the candlestick high/low to place the entry arrow.

=== Theme & Colors ===
InpColBg (Default: C'18,22,28') -> The main background color of the dashboard panel.
InpColHead (Default: C'32,38,48') -> The background color of the dashboard header and title areas.
InpColRow (Default: C'24,28,36') -> The primary background color for alternating data rows.
InpColRow2 (Default: C'28,33,42') -> The secondary background color for alternating data rows.
InpColText (Default: C'220,225,230') -> The default color for neutral text elements.
InpColBull (Default: C'0,230,118') -> The font color representing bullish signals and text.
InpColBear (Default: C'255,82,82') -> The font color representing bearish signals and text.
InpColMute (Default: C'120,128,140') -> The font color for inactive, old, or secondary text elements.
InpColAccent (Default: C'41,98,255') -> The accent color used for borders, active buttons, and titles.
InpColArrowBuy (Default: C'0,230,118') -> The color of the bullish entry arrow drawn on the chart.
InpColArrowSell (Default: C'255,82,82') -> The color of the bearish entry arrow drawn on the chart.
InpColEntry (Default: C'41,98,255') -> The color of the horizontal line depicting the entry level.
InpColSL (Default: C'255,82,82') -> The color of the horizontal line depicting the Stop Loss level.
InpColTP1 (Default: C'0,200,83') -> The color of the horizontal line depicting the Take Profit 1 level.
InpColTP2 (Default: C'0,230,118') -> The color of the horizontal line depicting the Take Profit 2 level.

RISK DISCLAIMER
Trading foreign exchange, commodities, and other financial instruments involves significant risk and may not be suitable for all investors. Past performance does not guarantee future results. This software is an analytical and operational tool designed to assist traders in technical analysis; it does not guarantee financial profit. Always thoroughly test the product on a demo account to understand its operational behavior before considering deployment in live trading environments.
Produits recommandés
Adaptive RSI-OsMA-STO   is an advanced market intelligence tool designed to detect price momentum and high-probability reversal points with absolute precision. By unifying three of the market's most powerful oscillators, this indicator provides dynamic divergence visualization without cluttering your chart workspace. Key Features Triple-Oscillator Confluence:   Seamlessly combines Adaptive RSI, Stochastic, and OsMA into a single integrated panel. This system filters out false signals by cross-re
1. GENERAL OVERVIEW AND ARCHITECTURAL PHILOSOPHY. TradeRadar LITE V3.4 represents an advanced, quantitative analytical multi-symbol and multi-timeframe scanner indicator engineered exclusively for the MetaTrader 5 platform. The overarching architectural philosophy behind this software is to eliminate subjective chart reading by translating standard Price Action and Smart Money Concepts (SMC) into a strict, mathematically driven algorithmic scoring model. Unlike conventional indicators that rely
L'indicateur aide à entrer dans un commerce en suivant la tendance, en même temps, après une certaine correction. Il trouve de forts mouvements de tendance d'une paire de devises sur un nombre donné de barres, et trouve également des niveaux de correction à cette tendance. Si la tendance est suffisamment forte et que la correction devient égale à celle spécifiée dans les paramètres, l'indicateur le signale. Vous pouvez définir différentes valeurs de correction, les valeurs de 38, 50 et 62 (nive
CVD Bubbles RealTime — Order flow, absorption and CVD divergences CVD Bubbles RealTime reads tick data and builds a real-time view of order flow: a cumulative delta (CVD) candle chart in a sub-window, volume bubbles on the price chart, absorption detection and CVD/price divergences. MAIN FEATURES 1) CVD candles (sub-window) - Cumulative Volume Delta drawn as candles: open = previous close, with real   intrabar highs/lows on the live bar. - Green = buyers dominate, red = sellers dominate, yel
ENGLISH VERSION (for MQL5 Market) Product Description: RSI Trend & Volatility Dashboard (Multi-Timeframe Filter) This professional dashboard provides traders with an ultimate market overview inside a single chart. It continuously monitors the trend direction across 5 timeframes simultaneously: M5, M15, M30, H1, and D1 [MQL5]. No more tedious chart switching or multi-window clutter – see everything from quick scalping moves to global institutional daily trends in real-time [MQL5]. Key Adva
HA Pullback Resume MT5 Systematic Trend Retracement and Momentum Resumption Engine The HA Pullback Resume indicator for MetaTrader 5 provides an objective analytical framework designed to identify high-probability trend-continuation setups following shallow corrective pullbacks. Active intraday traders and scalpers frequently encounter execution timing errors during trend pauses: entering prematurely before a correction completes, suffering stop-outs from erratic boundary wicks during quiet cons
ForeCastX AI
Marco Engstermann
ForeCastX AI est un indicateur graphique pour MetaTrader 5. Il affiche une coloration de tendance selon les swings, des flèches d’achat et de vente, des zones d’offre et de demande, un panneau de force acheteur/vendeur sur plusieurs unités de temps, et un tracé optionnel. Ce tracé est un schéma visuel basé sur la structure récente et le panneau. Ce n’est pas une prévision de prix ni un signal de trading à lui seul. Sur le graphique Bougies colorées selon la tendance de swing en cours Flèches lor
Institutional Orderflow Entry Scanner Volume Profile • Value Area • Order Blocks • Multi-Symbol Scanner Turn your chart into a professional institutional order-flow cockpit. This indicator scans up to 60 Market Watch symbols in real time, detects high-probability setups from three proven Value-Area strategies, and delivers clean, actionable entries with institutional-grade risk management — all on a single, flicker-free interface. What It Does The scanner continuously analyses the previous sess
ATlogic
Zaha Feiz
5 (3)
ATLogic  Indicateur ATLogic : Un outil polyvalent pour tous les instruments de trading ATLogic est un outil d'analyse technique complet et convivial conçu pour une large gamme d'instruments financiers, y compris tous les paires de devises, indices et crypto-monnaies. Cet indicateur polyvalent offre aux traders des informations puissantes sur divers marchés : " un message pour me contacter et apprendre à utiliser cet indicateur de manière plus efficace avec mon tuteur IA !" Principales caractéri
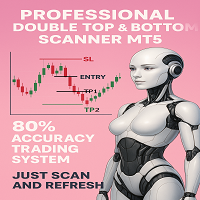
N/B: All our product purchase comes with our free ‘’DAILY   SCALPER EA’’ -   bit.ly/4qlFLNh Whatsapp Developer for yours after successful purchase PROFESSIONAL DOUBLE TOP/BOTTOM PATTERN SCANNER The Ultimate Reversal Trading System for Forex & Crypto Traders  TRANSFORM YOUR TRADING WITH INSTANT PATTERN RECOGNITION Are you tired of missing profitable reversal setups? Exhausted from staring at charts for hours, trying to spot double tops and bottoms? Frustrated with false breakouts and misse
Eclipse Valkyrie
Muhammad Okasha Razaq
Introducing Eclipse Valkyrie , a relative volume and momentum-based trading indicator that combines RVOL analysis, EMA trend confirmation and price breakouts to identify potential BUY/SELL opportunities. Eclipse Valkyrie compares current volume against historical averages to classify market activity as Surge, Normal or Dormant. It combines EMA alignment, candle strength, breakout confirmation and minimum relative volume requirements to identify potential entries, supported by clear chart signal
N/B: All our product purchase comes with our free ‘’DAILY   SCALPER EA’’ -   bit.ly/4qlFLNh Whatsapp Developer for yours after successful purchase THE PERFECT ENTRY INDICATOR  Enter Trades Like a Pro With the Perfect Entry Indicator! No More Guesswork. Just Precision. Double-ZigZag + Fractal Confirmation = Only the Strongest Buy & Sell Setups. Are you tired of false signals, late entries, and endless chart confusion? The Perfect Entry Indicator was built to give traders crystal-clear e
AURUM MID-QUANT PRO v5.60 L'Excellence Quantitative pour le Trading de l'Or (XAU/USD) & de la Volatilité Prenez une longueur d'avance sur les marchés institutionnels avec AURUM MID-QUANT PRO , le moteur de détection de motifs d'action des prix ( Price Action ) et de cassures de niveaux ( Breakout Engine ) le plus abouti sur MetaTrader 5. Développé sur mesure pour capturer la volatilité de l'Or et des actifs majeurs, cet indicateur combine une détection algorithmique ultra-précise et une cartog
TSI Trend Analyzer
Joao Paulo Ferreira Fortes
4.67 (6)
In which direction should I trade today? For “TREND followers”, we need to determine the TREND . This indicator determines the Trend based on the price High, Low and Close of every bar, for a given period and timeframe. Calculating and plotting the Trend UP and Trend DOWN lines. If the:   “Trend UP” line (Green) is above the “Trend DOWN” line (Red), then it is a BULLISH Trend (see "Screenshots" tab). “Trend DOWN” line (Red) is above the “Trend UP” line (Green), then it is a BEARISH Trend (see "
FREE
See trend direction, momentum shifts and pullback signals together. Bankers Trend Tsunami réunit deux moyennes mobiles colorées selon leur pente, une superposition de deux Relative Strength Index (RSI), des zones de Fair Value Gap, des divergences et des signaux configurables sur votre graphique MetaTrader 5. Comparez le mouvement immédiat du prix avec la tendance générale, examinez un retour vers une moyenne mobile et voyez si le momentum est en accord avant de choisir une configuration à étudi
Niubility Trend  Niubility Trend  displays the trend direction for all time frames in real time. You'll see at a glance at which direction the trends are running, how long they last and how powerful they are. All this makes it an easy-to-use trend trading system for beginners, advanced and professional traders. Features Easy to trade Customizable colors and sizes It is non-repainting and non-backpainting It is fantastic as a trailing stop method It implements alerts of all kinds
Candle Timer Countdown v2.5 is an advanced MQL5 indicator designed to enhance your trading precision. It provides a live countdown for each candle while simultaneously analyzing multiple timeframes to detect trend direction and potential early reversals. Key features include: Candle Countdown & Progress Bar: Monitor the exact time remaining for each candle with a clear progress visualization. Advanced Trend Detection: Analyze both fast and slow trends with configurable sensitivity and multi-time
Coral Wick NZDUSD H2 Historical statistics Period: 2023-04-26–2026-09-25 Data split: 70% in-sample / 30% out-of-sample (OOS) Cumulative return over the full period: 40.29% Maximum drawdown: 3.35% Trades: 189 Win rate: 61.38% Profit factor: 1.86 Reference-test risk: 1.00% per trade Broker data: Blueberry Markets Pty Ltd Longest losing streak in the reference test: 5 trades Historical reference backtest of the source strategy; these are not live results. This version defaults to 2.00% risk per
Indicateur Crypto_Forex « Histogramme de tendance » pour MT5, sans refonte. - L'indicateur Histogramme de tendance est beaucoup plus sensible et efficace que les moyennes mobiles croisées standard. - L'indicateur est disponible en deux couleurs : jaune (doré) pour une tendance baissière et vert pour une tendance haussière (les couleurs peuvent être modifiées dans les paramètres). - L'Histogramme de tendance intègre des alertes mobiles et PC. - Il est judicieux de combiner cet indicateur avec d'
The  OBV MTF  is an Enterprise-grade On-Balance Volume indicator that transforms standard OBV into a complete trading system. It combines gradient-aware momentum analysis, divergence detection, multi-timeframe alignment, and dynamic customisable midpoint-filtering in a single intuitive professional volume analysis tool. Core Features 1. 5-State Momentum Engine Aqua (Strong Bullish) : OBV slope rising with positive acceleration SteelBlue (Weak Bullish) : OBV rising but losing momentum Gray (Neutr
Cet indicateur est un indicateur d'analyse automatique des vagues, parfait pour le trading pratique ! Cas... Remarque :   je n'ai pas l'habitude d'utiliser des noms occidentaux pour l'évaluation des vagues. En raison de l'influence de la convention de dénomination de Tang Lun (Tang Zhong Shuo Zen), j'ai nommé la vague de base comme   un stylo   et la bande d'onde secondaire comme   un segment   . en même temps, le segment a la direction de la tendance.Le   segment de tendance principal   est no
L'indicateur Trend Speaker est un outil puissant conçu pour les traders qui souhaitent suivre et analyser facilement les tendances du marché en temps réel. Il fournit des signaux d'achat et de vente clairs et fiables sur le graphique, ce qui rend l'évaluation de la tendance actuelle du marché extrêmement pratique. Grâce à son interface conviviale, le Trend Speaker vous garantit de ne jamais manquer une opportunité de trading potentielle, vous aidant à prendre des décisions éclairées et à amélior
MultiWay EA
PAVEL UDOVICHENKO
4.89 (19)
MultiWay EA est un système de trading automatisé intelligent et efficace, basé sur une puissante stratégie de retour à la moyenne. Grâce à une large diversification sur neuf paires de devises corrélées (et même certaines typiquement “tendancielles”) — AUDNZD, NZDCAD, AUDCAD, USDCAD, EURUSD, GBPUSD, EURCAD, EURGBP et GBPCAD — il capture les mouvements de prix revenant à la moyenne après de forts impulsions directionnelles. Après l’achat, veuillez m’envoyer un message privé pour recevoir les inst
SunSignal ML — AI Gold Signals with Multi-Timeframe Confluence SunSignal ML is an advanced AI-powered signal indicator purpose-built for XAUUSD gold trading. It combines a proprietary adaptive trend algorithm with six machine learning models trained on confirmed price pivots to produce high-confidence entry signals with multi-timeframe validation. The indicator runs efficiently on M1, M5 and M15 timeframes and is designed for traders who want precision entries guided by data rather than guesswor
Giant M5
Artem Konkov
Cet indicateur multitâche poursuit la tradition du géant sur la plate-forme MT5. Il est basé sur des indicateurs de droits d'auteur qui recueillent des signaux de différents graphiques. Très souvent, le prix commence à se déplacer dans la direction indiquée après quelques minutes. La répétition fréquente des signaux dans une direction indique la tendance actuelle. Les signaux pour le commerçant sont les flèches sur le graphique et les alertes. Tout est configuré pour le commerce. Il suffit de
Multi-Timeframe Breakout Pressure and Confirmation Dashboard TAGLINE Track compression, stored pressure, breakout direction, and confirmation in one dashboard. PRODUCT OVERVIEW BreakoutPulse Navigator MT5 is a professional multi-timeframe breakout dashboard for MetaTrader 5. It is designed to detect two different stages of a breakout: 1. Pressure building before the breakout 2. Directional confirmation after price leaves the channel The indicator combines: - Bollinger Band squeeze - ATR
FREE
Fibo Shadow
Robby Suhendrawan
Fibo Shadow (FISH) – The Precision Entry & Zero Floating Indicator for MT5 Maîtrisez l'art du trading de précision avec Fibo Shadow. Fatigué de deviner où entrer sur le marché ? Vous luttez avec des Stop Losses trop larges et manquez l'entrée "parfaite" ? Découvrez Fibo Shadow (FISH) , un indicateur de qualité professionnelle conçu pour automatiser le processus de recherche de points d'entrée par retracement de Fibonacci à haute probabilité. Fibo Shadow n'est pas seulement un autre outil Fibonac
Super Duper Scalper Pro MT5 SuperDuperScalper Pro MT5 est un indicateur de scalping professionnel pour MetaTrader 5, conçu pour les traders qui recherchent des décisions plus rapides, des entrées plus propres et un tableau de bord visuel puissant sans encombrer leurs graphiques. Dans des marchés qui évoluent rapidement, la plupart des traders perdent du temps à passer d'un indicateur à l'autre, à vérifier manuellement la direction de la tendance et à se demander si un signal est assez fort. Supe
RSI SIGNAL Indicator RSI SIGNAL is a technical trading indicator designed to help traders identify high-probability Buy and Sell opportunities by combining RSI momentum analysis with price action and trend confirmation. Main Purpose The indicator analyzes the current market condition and produces clear BUY and SELL signals directly on the chart. Instead of relying on RSI alone, it can use multiple confirmations to reduce weak or misleading signals. Key Features BUY Signals — identifies b
FREE
Les acheteurs de ce produit ont également acheté
Trend Sniper X
Sarvarbek Abduvoxobov
4.87 (46)
Trend Sniper X est un indicateur de suivi de tendance multi-unités de temps pour MetaTrader 5 qui aide les traders à identifier la direction de la tendance et les points d'inversion potentiels avec clarté et précision. pour MT4: https://www.mql5.com/en/market/product/193245 Informations sur le prix : Le prix actuel est un prix promotionnel et est susceptible de changer lors des prochaines mises à jour et nouvelles fonctionnalités. Offre bonus : Pour obtenir GRATUITEMENT l'Auto-Trade Assistant E
Smart Trend Trading System — MetaTrader 5 Après votre achat, envoyez-moi un message sur MQL5 pour recevoir GRATUITEMENT Smart Universal Expert Advisor, ainsi que le cours en ligne, le manuel PDF et l’accès au groupe privé. STTS réunit la direction de la tendance, les signaux d’entrée et de sortie, les zones de retournement et les niveaux de prix importants directement sur votre graphique. Suivez le système manuellement ou connectez un EA compatible distinct pour une exécution automatique selon l
Un nouveau Roi en ville - Indicateur + Gestion des ordres (TP1 + TP2 + TP3) + Envoi optionnel de signaux Telegram INCLUS (GRATUIT) (SYSTÈME COMPLET DE TRADING et DE SIGNAUX) Notre meilleur EA pour l’Or : Gold Slayer Cet indicateur inclut une stratégie avancée, un système de trading avec gestion des ordres personnalisable ainsi qu’un système de retour à la moyenne combinant des extensions d’enveloppes, soutenu par plusieurs filtres intelligents de confirmation comme le RSI afin de détecter des en
Entry Points Pro vous montre où entrer, où placer le stop et avec quel lot trader — avant que vous ne passiez l'ordre. PRIX Actuellement 199 USD : 4 exemplaires à ce prix, ensuite 249 USD. Le prix final est de 349 USD. Je gagne ma vie en tradant sur les marchés, et je le montre, donc je n'ai pas besoin de vendre cet indicateur à tout le monde. C'est un outil pour les traders qui réfléchissent par eux-mêmes, pas un bouton magique. Pas de cassure, pas de trade. Une flèche grise est un signal annu
SuperScalp Pro
Van Minh Nguyen
4.54 (37)
SuperScalp Pro - Professional Multi-Layer Confluence Scalping System SuperScalp Pro est un indicateur de scalping avancé qui améliore le Supertrend classique grâce à plusieurs filtres intelligents de confirmation. Il vous aide à identifier des opportunités de trading Buy/Sell présentant une probabilité de réussite plus élevée, tout en réduisant considérablement les faux signaux. Des flèches Buy et Sell bien visibles apparaissent directement sur le graphique, avec des niveaux de Stop Loss et de T
Gann Made Easy   est un système de trading Forex professionnel et facile à utiliser qui est basé sur les meilleurs principes de trading en utilisant la théorie de mr. WD Gann. L'indicateur fournit des signaux d'ACHAT et de VENTE précis, y compris les niveaux Stop Loss et Take Profit. Vous pouvez échanger même en déplacement en utilisant les notifications PUSH. VEUILLEZ ME CONTACTER APRÈS L'ACHAT POUR RECEVOIR GRATUITEMENT DES INSTRUCTIONS DE TRADING ET D'EXCELLENTS INDICATEURS SUPPLÉMENTAIRES! V
Gardez votre avantage de trading dans votre ligne de mire ! M5 Sniper est un nouvel indicateur de MeanFX. Il combine des signaux de trading précis avec des niveaux de TP/SL adaptatifs — créant ainsi les meilleures opportunités de trading statistiques possibles ! Le prix augmente tous les 5 achats, le prochain prix est de 69$ Envoyez-moi un message après l’achat pour recevoir des conseils/un guide et un EA bonus Qu’est-ce qui le distingue ? Performance statistique éprouvée sur Gold XAUUSD ( fonct
SMC Intraday Formula
VividMind Digital Solutions
5 (26)
Commençons par être honnêtes. Aucun indicateur ne vous rendra rentable à lui seul. Si quelqu’un vous dit le contraire, il vous vend un rêve. Tout indicateur qui affiche des flèches parfaites d’achat/vente peut être rendu impeccable — il suffit de zoomer sur la bonne partie de l’historique et de capturer uniquement les trades gagnants. Nous ne faisons pas cela.  SMC Intraday Formula est un outil. Il lit la structure du marché pour vous, identifie les zones de prix à la probabilité la plus élevée

Zoryk Gold
Reda El Koutbane
4.68 (22)
ZORYK — Système avancé de signaux XAUUSD pour MetaTrader 5 Vous connaissez certainement cette sensation. Vous passez du temps à analyser l’or. Vous attendez le bon point d’entrée. Vous ouvrez enfin la position, puis le prix commence immédiatement à évoluer contre vous. Vous fermez trop tôt, déplacez le Stop Loss ou hésitez pendant quelques secondes. Ensuite, le marché atteint exactement l’objectif que vous aviez initialement prévu, mais sans vous dans la position. Le problème n’était pas toujour
Ultra Indicator
Ihor Otkydach
5 (1)
ULTRA est un indicateur technique « tout-en-un » : il analyse le marché de manière autonome, génère des signaux de trading, affiche les niveaux permettant de définir des ordres stop-loss et suggère le moment opportun pour clôturer les positions afin de sécuriser les bénéfices ou de minimiser les pertes. En d'autres termes, peu importe que vous ne sachiez pas analyser le marché, déterminer les niveaux (où placer votre stop-loss) ou que vous ayez du mal à gérer votre capital. ULTRA s'occupera de t
GoldenX Entry MT5
VividMind Digital Solutions
5 (17)
GoldenX Entry est un indicateur MT5 doté d’un algorithme adaptatif Smart Entry Trend, d’un système de scoring des signaux, d’un détecteur de régime de marché et d’un filtre de volatilité. Chaque signal inclut un niveau d’entrée calculé, trois niveaux de Take-Profit (TP1, TP2, TP3) ainsi qu’un niveau de Stop-Loss. Il est construit sur plusieurs couches analytiques conçues pour s’adapter à différentes conditions de marché, combinant un système analytique multicouche avec un optimiseur intégré et u
Currency Strength Wizard   est un indicateur très puissant qui vous offre une solution tout-en-un pour un trading réussi. L'indicateur calcule la puissance de telle ou telle paire de devises en utilisant les données de toutes les devises sur plusieurs périodes. Ces données sont représentées sous la forme d'un indice de devise facile à utiliser et de lignes électriques de devise que vous pouvez utiliser pour voir la puissance de telle ou telle devise. Tout ce dont vous avez besoin est d'attacher
Gold Trend Coach MT5
Cristhian Alexander Gaibor Cuasquer
4.27 (11)
Des signaux d'achat et de vente sans repaint pour l'or (XAUUSD) sur MetaTrader 5. Chaque signal arrive avec un stop loss et trois take profits. Un filtre Smart Money Concepts avec BOS et CHoCH, pour trader dans le sens de la structure, pas contre elle. Un Mentor en direct sur votre panneau qui vous guide à chaque étape, de l'entrée jusqu'au TP3. Et des alertes directement sur votre téléphone et sur votre propre canal Telegram. C'est ça, Gold Trend Coach. Ne tradez plus jamais seul. KIT ACHETEUR
Auto Optimized SpeedAngle est un système de vectorisation du momentum de niveau institutionnel qui élimine l'ajustement de courbe ( curve-fitting ) grâce à une optimisation continue par avancement ( Walk-Forward Optimization , WFO). Plutôt que de s'appuyer sur des entrées statiques qui se dégradent lorsque les régimes de marché changent, l'indicateur recalibre dynamiquement ses paramètres en utilisant une validation hors échantillon ( Out-of-Sample , OOS), garantissant ainsi que les signaux affi
Boba Analysis Suite
Trade Ready Solutions LLC
5 (2)
Boba Analysis Suite Boba Analysis Suite est un indicateur d’analyse pour MetaTrader 5. Il réunit la structure du marché, les zones de prix pertinentes et le contexte général du marché dans une même vue graphique. Développé à partir de l’expérience pratique d’un trader et formateur en trading, il accompagne une démarche d’analyse structurée : évaluer la direction du marché, identifier les niveaux importants et analyser plusieurs unités de temps conjointement. Une analyse en contexte La significat
FX Power MT5 NG
Daniel Stein
5 (33)
FX Power : Analysez la force des devises pour des décisions de trading plus intelligentes Aperçu FX Power est l'outil essentiel pour comprendre la force réelle des principales devises et de l'or, quelles que soient les conditions du marché. En identifiant les devises fortes à acheter et les faibles à vendre, FX Power simplifie vos décisions de trading et révèle des opportunités à forte probabilité. Que vous suiviez les tendances ou anticipiez les retournements à l'aide de valeurs extrêmes de D
Indicateur multi-devises de force et de momentum MT5 Dynamic Forex28 Navigator est l'évolution de nos indicateurs populaires de longue date, qui réunit la puissance de cinq en un : Advanced Currency Strength28 Indicator (700 avis) Advanced Currency IMPULSE with ALERT (530 avis) Currency Strength EXOTICS GOLD Impulse with Alert CS28 Combo Signals (bonus actuel) Pas besoin d'acheter quatre indicateurs et de les empiler sur vos graphiques. Tout est réuni dans un seul indicateur puissant : la force
M1 Sniper MT5
Oleg Rodin
5 (7)
M1 SNIPER   est un système d'indicateurs de trading facile à utiliser. Il s'agit d'un indicateur à flèche conçu pour l'unité de temps M1. Cet indicateur peut être utilisé seul pour le scalping sur l'unité de temps M1 ou intégré à votre système de trading existant. Bien que conçu spécifiquement pour le trading sur l'unité de temps M1, ce système peut également être utilisé avec d'autres unités de temps. Initialement, j'avais conçu cette méthode pour le trading du XAUUSD et du BTCUSD. Cependant, j
Atomic Analyst MT5
Issam Kassas
4.51 (65)
Atomic Analyst — MetaTrader 5 Après votre achat, envoyez-moi un message sur MQL5 pour recevoir GRATUITEMENT Smart Universal Expert Advisor, ainsi que le cours en ligne, le manuel PDF et l’accès au groupe privé. Atomic Analyst réunit l’action des prix, la direction de la tendance, les signaux d’entrée et de sortie, le Stop Loss et plusieurs niveaux de Take Profit directement sur votre graphique. REPÉREZ LE SIGNAL. COMPRENEZ LA CONFIGURATION. Atomic Analyst présente son analyse sous forme d’inform
Unix Scalper
Issam Kassas
4 (4)
Unix Scalper — MetaTrader 5 Après votre achat, envoyez-moi un message sur MQL5 pour recevoir GRATUITEMENT Smart Universal Expert Advisor, ainsi que le cours en ligne, le manuel PDF et l’accès au groupe privé. Repérez la configuration. Consultez le plan. Choisissez comment intervenir. UNIX Scalper réunit l’analyse du marché, les décisions BUY/SELL/WAIT et les niveaux Entry, Stop Loss, TP1 et TP2 dans un panneau organisé. VISUALISEZ LE SIGNAL ET LE PLAN • Des décisions claires : BUY, SELL ou WAIT.
Smc Pro ToolKit
Talal N Z Aljarusha
5 (13)
SMC PRO TOOLKIT — SMART MONEY ANALYSIS & STRUCTURED TRADE PLANNING SMC Pro ToolKit is a professional Smart Money Concepts analysis workspace for MetaTrader 5. It combines market structure, multi-timeframe analysis, institutional price zones, setup evaluation, confirmation tools, volume context, alerts, and risk planning inside one organized chart environment. One workspace. Multiple layers of confirmation. One structured trading plan. OPEN COMPLETE USER GUIDE MULTI-CONDITION SETUP ENGINE At
Azimuth Pro
Ottaviano De Cicco
5 (7)
Azimuth Pro V2: Synthetic Fractal Structure and Confirmed Entries for MT5 Overview Azimuth Pro is a multi-level swing structure indicator by Merkava Labs . Four nested swing layers, swing-anchored VWAP, ABC pattern detection, three-timeframe structural filtering, and closed-bar confirmed entries — one chart, one workflow from micro-swings to macro-cycles. This is not a blind signal product. It is a structure-first workflow for traders who care about location, context, and timing. 1. What Change
Apex Patterns PRO Achetez l'indicateur - Obtenez GRATUITEMENT l'Expert Advisor basé sur celui-ci. Intelligence auto-optimisée des figures chartistes et des cassures Les scanners de figures traditionnels s'appuient sur des paramètres fixes, sous-performant souvent lorsque la volatilité et les structures du marché changent. Apex Patterns PRO est conçu pour s'adapter aux conditions changeantes du marché en combinant la reconnaissance des figures chartistes structurelles, le filtrage du momentum et
Prochaine mise à jour — Version 2.52 bientôt disponible ! [NOUVEAU] Préparez-vous à découvrir 4 nouvelles fonctionnalités majeures conçues pour améliorer votre analyse du marché et votre flux de travail de trading Nous faisons passer l’analyse du marché au niveau supérieur avec 4 nouvelles fonctionnalités conçues pour répondre à vos besoins en trading. Découvrez : 1. TRADE OVERVIEW DASHBOARD 2. CONFLUENCE AT ZONE 3. STRONG & WEAK HIGH/LOW 4. OTE 1. TRADE OVERVIEW DASHBOARD Un tableau de bord qu
Divergence Bomber
Ihor Otkydach
4.89 (94)
Chaque acheteur de cet indicateur reçoit également gratuitement : L’outil exclusif « Bomber Utility », qui accompagne automatiquement chaque opération de trading, fixe les niveaux de Stop Loss et de Take Profit, et clôture les positions selon les règles de la stratégie Des fichiers de configuration (set files) pour adapter l’indicateur à différents actifs Des set files pour configurer le Bomber Utility selon différents modes : « Risque Minimum », « Risque Équilibré » et « Stratégie d’Attente »
Power Candles MT5
Daniel Stein
4.58 (12)
Power Candles V3 - Indicateur de force à optimisation automatique Power Candles V3 transforme la force des devises et des instruments en un plan de trading exploitable sur chaque graphique auquel il est associé. Au lieu de se contenter de colorer les bougies, il effectue une optimisation automatique en temps réel en arrière-plan et vous fournit les meilleurs niveaux de Stop Loss, Take Profit et seuils de signal pour le symbole que vous avez sous les yeux. Un simple clic suffit pour l'adopter en
Gold Entry Sniper
Tahir Mehmood
5 (23)
Gold Entry Sniper – Tableau de Bord ATR Multi-Unités de Temps pour Scalping et Swing Trading sur l'Or Gold Entry Sniper est un indicateur avancé pour MetaTrader 5 qui fournit des signaux d'achat/vente précis sur XAUUSD et autres actifs, basé sur la logique de Trailing Stop ATR et l' analyse multi-unités de temps . Caractéristiques et Avantages Clés Analyse Multi-Unités de Temps – Affiche les tendances en M1, M5, M15 sur un seul tableau. Trailing Stop Basé sur l'ATR – Ajuste automatiquement selon
Gold Sniper Scalper Pro
Ich Khiem Nguyen
3.9 (10)
Gold Sniper Scalper Pro est un indicateur pour MetaTrader 5 conçu spécifiquement pour détecter les figures de fausse cassure (false breakout) sur XAUUSD. Il identifie la structure piège à 4 barres où le prix franchit la limite d'un range, attire les traders de cassure, puis inverse — confirmant que le mouvement était une fausse cassure. L'indicateur évalue chaque configuration selon 17 facteurs de qualité, la traite à travers un pipeline de confluence à 4 couches, la vérifie contre un moteur de
Naked Forex Tweezer Pro Indicator Tweezer Pro Indicator is a pattern recognition indicator for Forex, Stocks, Indices, Futures, Commodities and Cryptos. The standard Tweezer is a two bar pattern. Our enhanced version is a multi-bar pattern. We filter the patterns for you so that you only get the     best and most effective patterns   and ignore the noise. The Tweezer pattern is a simple and effective pattern to trade. The strategy that comes with the Tweezer is based on price action. The Twe
Adaptive Price Action Engine Achetez un indicateur, obtenez l'EA gratuitement Analyse auto-optimisée des tendances et des figures de chandeliers Multi-Timeframe Les marchés évoluent constamment, et tous les modèles de Price Action n’ont pas la même valeur dans toutes les conditions de marché. Adaptive Price Action Engine a été conçu pour s’adapter aux changements du marché en combinant structure de tendance, analyse Multi-Timeframe, figures de chandeliers et optimisation statistique au sein d’un
Plus de l'auteur
Overview MACD Signal with Multi Filters is an advanced technical analysis indicator engineered for MetaTrader 5 (MT5). The software combines the classic Moving Average Convergence Divergence (MACD) oscillator architecture with a modular 14-filter confirmation engine (MultiFilterSuite). It is developed to assist manual traders, quantitative analysts, and algorithmic system developers in identifying momentum shifts, trend continuations, and structural turning points while filtering out sideways ma
Parabolic SAR Multi-Filter System MT5: Algorithmic Trend Reversal Engine 1. PRODUCT OVERVIEW & OPERATIONAL ARCHITECTURE Parabolic SAR Multi-Filter System MT5 is a professional multi-component technical analysis indicator engineered for the MetaTrader 5 terminal. The indicator combines J. Welles Wilder's classic Parabolic Time/Price System with an advanced modular filtering architecture comprising 17 distinct secondary validation engines. The primary objective of this software is to eliminate f
Hull Trend Arrows MT5 with Multi-Filter Suite - Technical Documentation 1. Overview and Analytical Purpose Hull Trend Arrows MT5 with Multi-Filter Suite is an algorithmic technical indicator for MetaTrader 5. It integrates the low-lag calculation engine of the Hull Moving Average (HMA) with fourteen modular confirmation filters to identify directional momentum transitions, calculate inflection points, and display non-repainting entry signals on the chart. Standard moving averages introduce sign
FREE
Product Overview: Relative Vigor Index Multi-Filter Technical System The Relative Vigor Index (RVI) Multi-Filter Indicator is a comprehensive technical analysis engine developed for the MetaTrader 5 terminal. Designed to identify cyclical momentum shifts, trend continuations, and structural market turning points, this analytical system couples the classic Relative Vigor Index formula with an advanced multi-layered confirmation matrix consisting of 17 distinct technical filters. Rather than rely
FREE
HA Signal MultiFilter MT5 - Technical Operational Manual & Architecture Guide 1. SYSTEM OVERVIEW & ARCHITECTURAL FOUNDATION HA Signal MultiFilter MT5 is a specialized analytical indicator developed for MetaTrader 5 terminal to identify directional momentum expansions and structural trend continuations[cite: 2]. By synthesizing smoothed Heiken Ashi candlestick price discovery with a modular 15-layer secondary confirmation filter suite, the system extracts high-probability market shifts while fil
FREE
1. OVERVIEW Harmonic Dashboard is a specialized multi-symbol and multi-timeframe analytical indicator designed for MetaTrader 5 (MT5). The software systematically scans financial instruments across multiple timeframes to identify six classical harmonic chart patterns: Gartley, Bat, Butterfly, Crab, Cypher, and Shark. The application consolidates multi-asset scanner results, trend filter validation metrics, price level projections, and interactive chart navigation controls into a single graphic
Overview The MA Cross Scanner Pro is an advanced, highly optimized multi-symbol and multi-timeframe analytical dashboard engineered specifically for the MetaTrader 5 terminal. Designed for technical analysts, systemic traders, and quantitative researchers, this utility serves as a comprehensive market surveillance engine. Its primary objective is to continuously monitor a customized array of financial instruments across numerous timeframes simultaneously, detecting precise moving average crosso
CCI MultiFilter Overbought Oversold Signal Pro MT5 Technical Specification & Operational Manual  1. Overview and System Identity CCI MultiFilter Overbought Oversold Signal Pro MT5 is an institutional-grade technical analysis indicator engineered natively for MetaTrader 5. Developed for quantitative analysts, systematic manual traders, and multi-asset operators, the system provides an objective algorithmic framework to identify cyclical market extremes, momentum shifts, and structural trend cont
WPR Williams Percent Range All Pair Timeframe Scanner Dashboard Overview WPR Scanner Dashboard Pro is a multi-symbol, multi-timeframe market scanning indicator and visual chart overlay utility built for MetaTrader 4 (MT4). The tool monitors Williams Percent Range (WPR) momentum exhaustion and threshold breakouts across multiple currency pairs, metals, indices, and CFDs simultaneously from a single chart window. In addition to its core WPR detection engine, the indicator incorporates an optiona
WAE Waddah Attar Explosion Multi Pair TimeFrame Scanner 1. Overview - WAE Scanner Dashboard is a technical analysis indicator and multi-symbol, multi-timeframe market scanner built for MetaTrader 4 (MT4). - It automates multi-chart monitoring by scanning volatility-driven momentum breakouts based on the Waddah Attar Explosion (WAE) methodology across multiple currency pairs, crosses, indices, or metals simultaneously. - Candidate signals are processed through a modular 15-filter technical conf
UT Bot Trend Multi Pair Timeframe Scan Dashboard Overview UT Bot Scanner Dashboard is a multi-pair and multi-timeframe technical indicator and market scanner developed natively for MetaTrader 4 (MT4). It continuously monitors selected Forex pairs, precious metals, indices, or active Market Watch symbols across multiple timeframes simultaneously to detect dynamic Average True Range (ATR) volatility trailing stop crossovers. Instead of manually cycling through dozens of individual charts to monit
TDI Traders Dynamic Index RSI Scanner All Pair TF Overview TDI & RSI Dynamic Line Dashboard Scanner is a multi-symbol and multi-timeframe analytical indicator designed for MetaTrader 4. The tool monitors multiple currency pairs, commodities, or indices across selected chart timeframes simultaneously to detect crossover events derived from the Traders Dynamic Index (TDI) and dual Relative Strength Index (RSI) Dynamic Lines. Every detected signal is evaluated against an optional 15-module technica
Stochastic Scanner Dashboard for MetaTrader 4 Stochastic Overbought Oversold Scanner Dashboard All Pair Time frame Overview - Stochastic Scanner Dashboard is a multi-symbol and multi-timeframe technical analysis indicator and market scanner built for MetaTrader 4 (MT4). - The tool continuously monitors user-defined currency pairs, metals, or Market Watch symbols across multiple timeframes from one chart. - It detects momentum shifts using configurable Stochastic Oscillator strategies and valida
SSL Channel Trend Scanner Dashboard Multi Pair Multi TimeFrame Overview SSL Channel Multi-Filter Dashboard is a technical analysis indicator and multi-symbol, multi-timeframe market scanner built for MetaTrader 4. It continuously monitors multiple currency pairs, commodities, or other broker instruments across user-selected timeframes to detect directional channel crossovers confirmed by an optional 15-module technical filter suite. Validated signals are organized in an interactive on-chart dash
Relative Vigor Index RVI All Pair and Timeframe Scanner Dashboard Overview RVI Scanner Dashboard is a multi-pair and multi-timeframe technical indicator and interactive scanner panel for MetaTrader 4 (MT4). Built around the Relative Vigor Index (RVI) oscillator, it continuously monitors multiple currency pairs, commodities, or indices across selected timeframes from one chart window. The tool detects directional momentum crossovers, validates setups through an optional 15-module technical conf
RSI Parabolic Overbought Oversold Multi pair Timeframe Scanner 1. Overview - RSI Parabolic Scanner Dashboard is a multi-symbol, multi-timeframe technical analysis indicator and real-time market scanner engineered for MetaTrader 4 (MT4). - It continuously monitors user-defined currency pairs, metals, or visible Market Watch instruments across multiple chart timeframes to identify momentum reversals and overbought or oversold market conditions. - The indicator combines two selectable RSI-based si
RSI Divergence Multi Pair Timeframe Scan Dashboard Overview - Product Type: Multi-symbol, multi-timeframe technical analysis indicator and interactive market dashboard scanner for MetaTrader 4 (MT4). - Core Purpose: Continuously monitors configured currency pairs, precious metals, indices, or active Market Watch symbols across multiple chart timeframes simultaneously to identify Regular and Hidden Relative Strength Index (RSI) divergence setups in one unified terminal window. - Structured Trade
Overview - Product Identity: Pola MultiCandle Scanner Dashboard is a multi-pair and multi-timeframe technical analysis indicator and market scanner developed for MetaTrader 4 (MT4). - Core Purpose: Continuously monitors user-defined currency pairs, precious metals, or Market Watch instruments across multiple timeframes to detect structured multi-candle price action formations, validate setups through a modular 15-indicator confluence suite, calculate volatility-adjusted Stop Loss (SL) and dual
MACD Signal Trend Cross Scanner All Pair Dashboard Overview MACD Scanner Dashboard is a technical analysis utility and multi-symbol, multi-timeframe dashboard indicator designed for MetaTrader 4[cite: 1]. Its primary objective is to monitor MACD crossover events across multiple currency pairs and chart timeframes simultaneously from a single active chart window[cite: 1]. Instead of manually switching between dozens of charts, traders can observe real-time market momentum, directional bias, calc
MA Moving Average Cross Scanner All Pair Timeframe Dashboard Overview MA Cross Scanner is an analytical multi-symbol and multi-timeframe technical indicator equipped with an interactive on-chart dashboard panel for MetaTrader 4[cite: 1]. The tool is engineered to monitor Moving Average (MA) crossover events across multiple currency pairs and timeframes simultaneously, consolidating signal detection, modular trend/momentum filtering, and Average True Range (ATR) risk-reward level calculations in
Ichimoku Tenkan Kijun Cross Scanner All Pair TimeFrame Overview TK Cross Scanner Dashboard is a technical analysis indicator and multi-asset market scanner engineered for the MetaTrader 4 platform. The utility monitors multiple currency pairs, commodities, and timeframes simultaneously to detect Ichimoku Tenkan-sen and Kijun-sen crossovers (TK Cross). In addition to automated signal scanning, the software calculates dynamic Stop Loss (SL) and dual Take Profit (TP1 and TP2) reference levels usin
Ichimoku Senkou Span B Scanner All Pair Timeframe Overview Senkou Span B Scanner Dashboard MT4 is a technical analysis indicator and multi-asset market scanner designed for MetaTrader 4. The tool monitors multiple currency pairs, commodities, and timeframes simultaneously from a single chart window to detect price interactions with the Ichimoku Kinko Hyo Senkou Span B boundary. In addition to scanning for signal candidates, the indicator integrates a 15-module secondary confirmation suite, calc
Heiken Ashi Multi Currency Pair Time Frame Scan Dashboard Overview Heiken Ashi Multi Timeframe Scanner Dashboard is a technical analysis utility and multi-symbol, multi-timeframe market scanner developed for the MetaTrader 4 platform. The tool is designed to monitor multiple currency pairs, commodities, or indices simultaneously from a single chart window. Instead of manually switching between dozens of charts and timeframes to inspect Heiken Ashi candle formations, traders can view active dire
Pro Harmonic Pattern Scanner All Pair Time Frame Dashboard Harmonic Pattern Scanner Dashboard MT4 is an analytical multi-symbol and multi-timeframe technical indicator designed for MetaTrader 4. It automatically scans price action across selected currency pairs, metals, or Market Watch instruments to identify classic XABCD harmonic structures, calculate Fibonacci-based entry, Stop Loss, and Take Profit zones, and validate setups through an integrated modular trend and momentum filter suite. Op
Fractal Breakout Scanner Multi Pair Timeframe Dashboard Overview Fractal Breakout Scanner Dashboard is a technical analysis indicator and multi-symbol, multi-timeframe scanning utility designed for MetaTrader 4. The tool monitors multiple currency pairs, commodities, and indices simultaneously to detect price breakouts beyond confirmed Bill Williams Fractal swing highs and swing lows. Rather than requiring manual chart switching across dozens of instruments, the indicator aggregates real-time b
Institutional Candle Price Engulfing Scan All Pair Timeframe Engulfing Scanner Dashboard is a technical analysis utility and multi-symbol, multi-timeframe candlestick pattern scanner for MetaTrader 4. It detects Bullish Engulfing and Bearish Engulfing setups across multiple currency pairs and timeframes simultaneously, displaying active signals in an interactive on-chart table alongside ATR-based Stop Loss and Take Profit reference levels. 1. Overview and Technical Purpose - Product Category:
Pinbar Marubozu Rejection Candlestick Scanner All Pair Timeframe Overview Candle Pattern Scanner Dashboard is a technical analysis utility and multi-pair, multi-timeframe scanner indicator designed for MetaTrader 4. The indicator continuously monitors multiple currency pairs, commodities, or indices across selected timeframes to detect specific Japanese candlestick price action formations—namely Candle Rejection, Full-Body Marubozu, and Classic Pin Bar structures. When a valid candlestick forma
Chaikin Oscillator Scanner All Pair Timeframe Dashboard Overview Chaikin Oscillator Scanner Dashboard is a technical analysis utility and multi-symbol, multi-timeframe market scanner designed for MetaTrader 4 (MT4)[cite: 1]. The indicator monitors multiple currency pairs, commodities, or indices simultaneously across selected chart timeframes to identify Chaikin Oscillator zero-line crossover events[cite: 1]. Detected setups are presented in an interactive on-chart table complete with automated
CCI Signal Trend Overbought Oversold Scanner All Pair TimeFrame Dashboard CCI Multi Timeframe Scanner Dashboard is a technical analysis utility and multi-symbol market scanner developed for MetaTrader 4. The indicator monitors multiple currency pairs and timeframes simultaneously using Commodity Channel Index (CCI) calculations combined with an optional multi-indicator confirmation suite and Average True Range (ATR) volatility projections. 1. Operating Principle and Signal Validity - Core Cal
BB Bollinger Bands Breakout Scanner All Pair Time Frame Bollinger Bands Breakout Scanner Dashboard is a technical analysis utility and multi-symbol, multi-timeframe market scanner engineered for MetaTrader 4 (MT4). The software continuously monitors multiple currency pairs, commodities, or indices across user-defined timeframes to detect confirmed Bollinger Bands breakout setups. Every detected signal is evaluated through an optional modular confirmation suite and automatically paired with vola
Filtrer:
Aucun avis
Répondre à l'avis