Einstein Pivot Point Pro

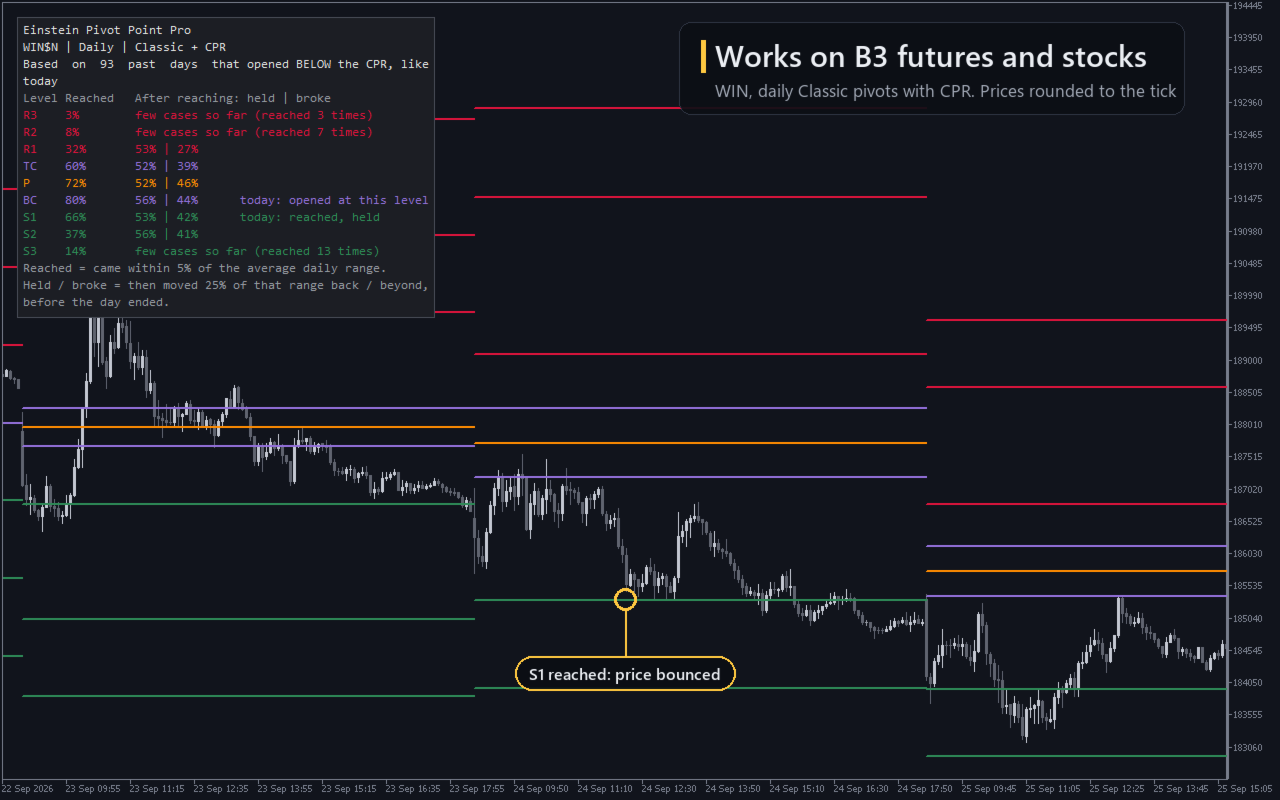
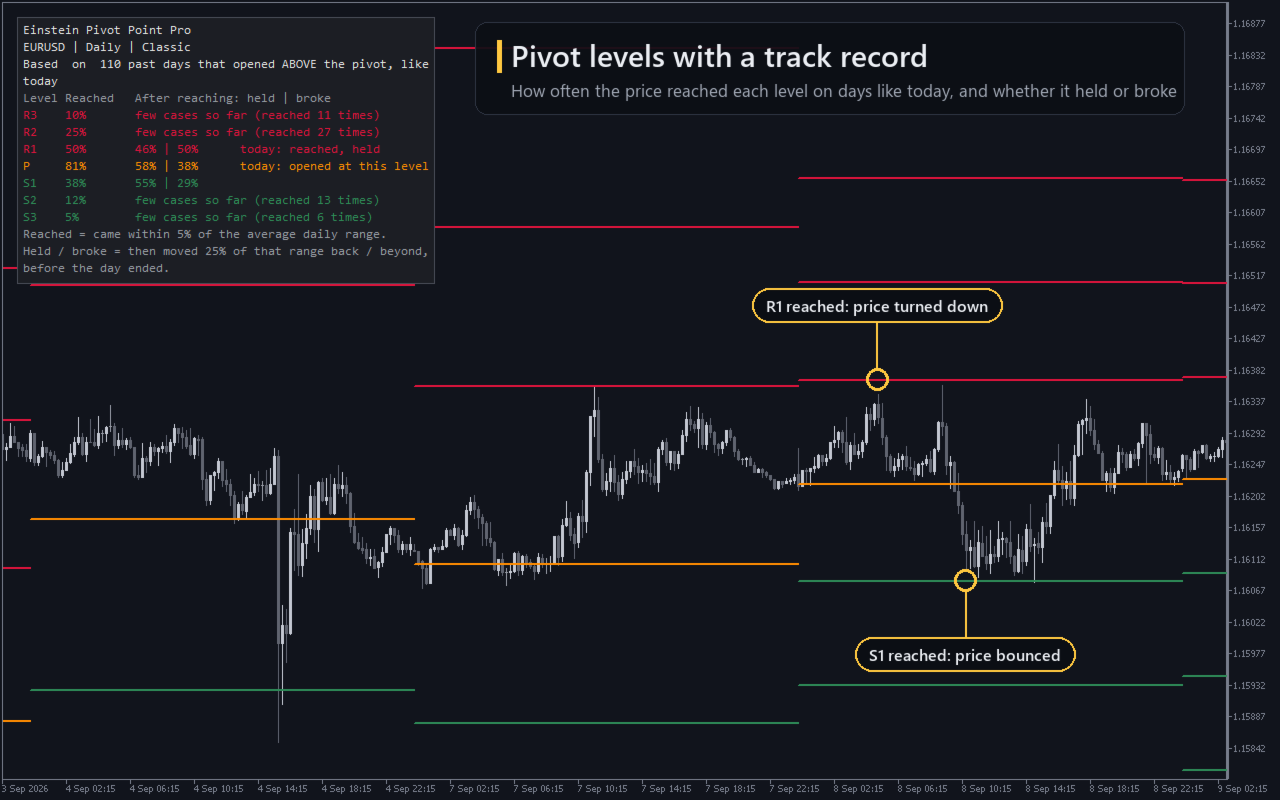
Einstein Pivot Point Pro draws daily, weekly or monthly pivot levels and shows how the price behaved at each level in the past, on days like today.

Most pivot indicators stop at the lines. This one adds a small panel that answers three plain questions for every level:

  • Reached: how often did the price get to this level?
  • Held: when it got there, how often did it come back?
  • Broke: and how often did it go through?

The numbers only count past days that looked like today. By default, "like today" means days that opened on the same side of the pivot: if today opened above P, the panel counts only past days that also opened above P.

HOW TO READ THE PANEL

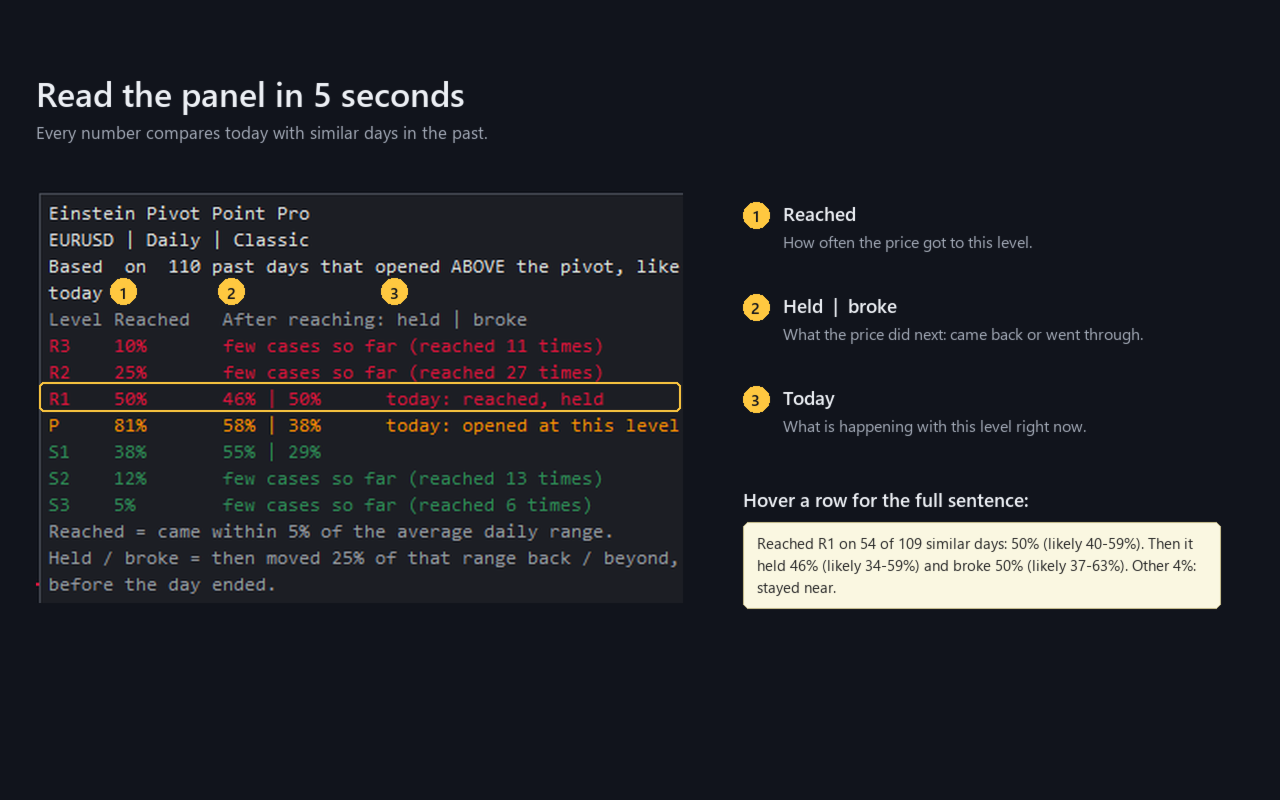
Example taken from a EURUSD chart (the numbers change with the symbol and with each new day):

  • Header: "Based on 110 past days that opened ABOVE the pivot, like today"
  • Row: R1 | 50% | 46% | 50% | today: reached, held

This row means: on 50% of those 110 days the price reached R1. When it did, it came back 46% of the time and went through 50% of the time (in the other 4%, the price stayed near the level until the end of the day). Today the price has already reached R1 and came back.

  • Hover over a row to read it as a sentence, with the likely range of each number, for example "50% (likely 40-59%)".
  • When there are too few similar days to trust a percentage, the panel says "few cases so far" instead of showing a number.
  • The footer explains the rules in plain words, using the values you set.
  • The last column shows what is happening in the current period: reached, reached and held, reached and broke, or opened at this level.

WHAT "REACHED", "HELD" AND "BROKE" MEAN

All distances are measured in the average range of the period (the average daily range, for daily pivots). That is why the same settings work on EURUSD, gold, indices or B3 futures.

  • Reached: the price came within 5% of the average daily range of the level.
  • Held: after reaching it, the price moved 25% of that range back, before the day ended.
  • Broke: after reaching it, the price moved 25% of that range beyond the level, before the day ended.

The first one to happen is the one that counts. The order of events inside the day is read from M15 bars (adjustable), not guessed from a daily candle. If both happen inside the same M15 bar, the day is not counted as held or broke, instead of guessing.

PIVOT FORMULAS

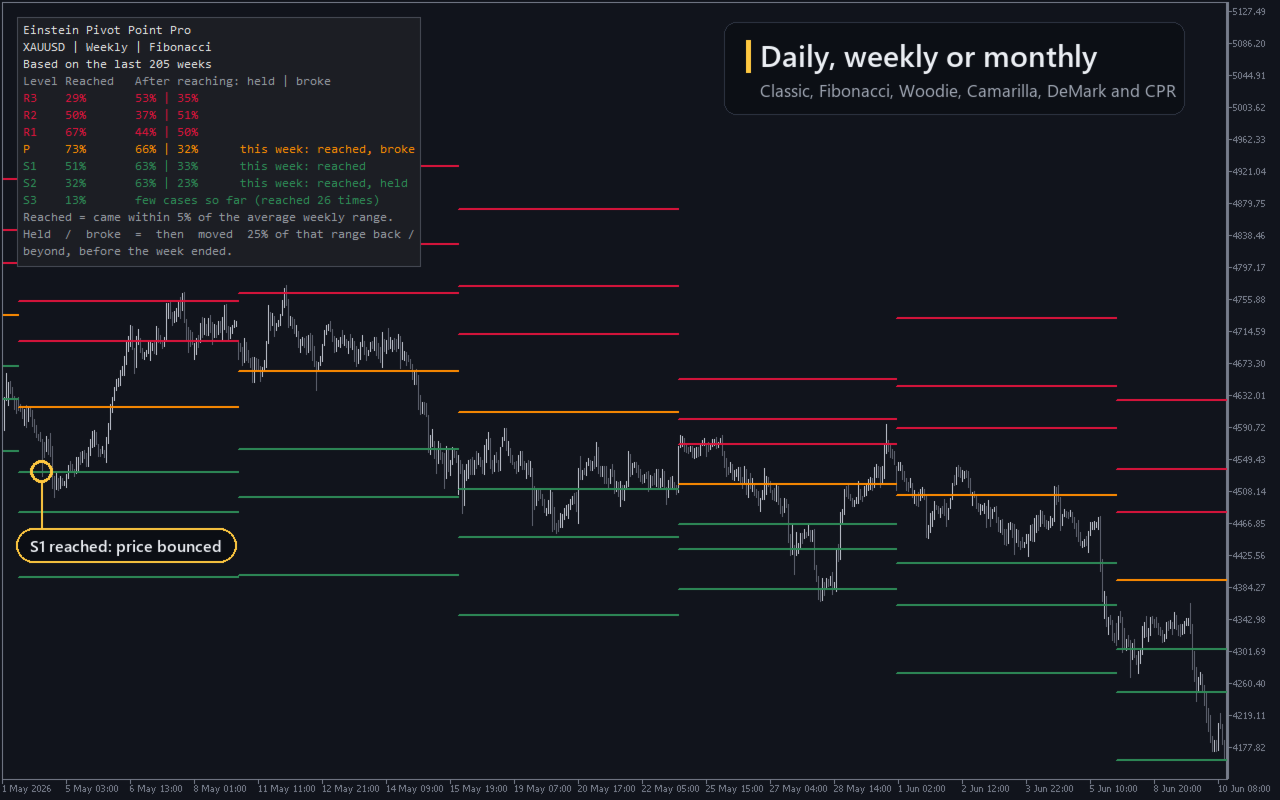
  • Classic, Fibonacci, Woodie (with R3 and S3), Camarilla (R1 to R4, S1 to S4) and DeMark.
  • Optional CPR lines (TC and BC) on top of any formula, including Camarilla.
  • Daily, weekly or monthly pivots. Several instances can run on the same chart, for example daily Classic and weekly Camarilla.

NO REPAINTING

Levels are calculated when each period starts, from the previous closed period, and never change afterwards. In our tests, comparing 355,000 candles in the Strategy Tester, there were 0 differences. The statistics use only closed periods: they stay the same during the period and are updated when a new one starts.

ALERTS

  • Alert when a level is touched: popup (on by default), sound, push notification and e-mail.
  • At most one alert per level per period.
  • Touches that happened before you attached the indicator do not trigger alerts.
  • You choose which levels alert: all of them, only resistances and supports, or only the pivot and CPR.

FOREX AND B3

  • Works on hedging accounts (Forex) and netting accounts (B3).
  • With default settings, the daily open, high, low and close built by the indicator matched the broker's D1 bars on EURUSD, XAUUSD, PETR4 and WIN in our tests.
  • Sunday candle: merge into Monday (default), merge into Friday, keep as a separate day, or ignore.
  • Configurable day start hour, for brokers whose server day does not match your trading day.
  • Optional time window to use only the regular session.
  • Opening gaps are handled: a level jumped by the gap is evaluated from the other side, and the gap itself does not count as a touch.
  • Weeks follow the calendar, so a Monday holiday does not break the week.
  • Label and panel prices are rounded to the symbol's tick (WIN in steps of 5, WDO in steps of 0.5).

FOR EA DEVELOPERS

12 fixed buffers, also shown in the Data Window:

0 P, 1 R1, 2 R2, 3 R3, 4 R4, 5 S1, 6 S2, 7 S3, 8 S4, 9 TC, 10 BC, 11 ATR ref (average range of the period, in price).

  • Levels the chosen formula does not have are EMPTY_VALUE (for example R4 and S4 outside Camarilla).
  • TC and BC are always calculated, even with the CPR lines hidden.
  • Buffer numbers will not change in future versions, and new inputs will only be added at the end of the list.

In iCustom, each input group counts as one parameter: pass the group name before its inputs. From an EA, turn off the panel, the labels and the alerts, otherwise they appear on the EA's chart. Example with default settings:

int handle = iCustom(_Symbol, _Period, "Market\\Einstein Pivot Point Pro",
   "Pivot levels", 0, 0, false,                  // Daily, Classic, CPR lines hidden
   "Sessions", PERIOD_M15, 0, 0, false, "09:00", "18:30",
   "Touch rules", 0.05, 0.25, 0.25, 14,
   "Statistics", true, 250, 1, 30,
   "Alerts", false, 0, true, false, "alert.wav", false, false,   // alerts off
   "Appearance", true, clrDarkOrange, clrCrimson, clrSeaGreen, clrMediumPurple,
   1, STYLE_SOLID, false, true, 8,               // labels off
   "Panel", false);                              // panel off

double r1[];
if(CopyBuffer(handle, 1, 0, 1, r1) == 1 && r1[0] != EMPTY_VALUE)
   Print("R1 now: ", r1[0]);

If the M15 history is not ready when the EA starts, the buffers stay empty until the next tick. Always check for EMPTY_VALUE.

GOOD TO KNOW

  • The statistics can only look as far back as the history in your terminal. With the defaults (daily pivots, M15 bars) that is about 4 years of Forex. For weekly and monthly pivots, set "Calculation timeframe" to H1 and raise "Max bars in chart" (Tools > Options > Charts). Monthly samples stay small, and the panel says so.
  • Daylight saving time is not adjusted automatically. If your broker's server clock does not follow it, the start of the day shifts by one hour for part of the year; adjust "Day starts at hour" if needed.
  • B3: the daily close used is the last trade, not the settlement price. On continuous futures series (such as WIN$ or WIN$N, depending on the broker), the contract roll can shift the levels of the roll day.
  • B3 time window: to use only the regular session, turn on "Use only bars inside a time window" and type the session hours of your symbol, in the server time of your broker. B3 changes its trading hours during the year, so check the current hours.
  • With Woodie or DeMark, the CPR lines use the classic pivot, so the middle of the CPR can differ from the P drawn. This is expected.
  • On a chart timeframe higher than the pivot period (for example daily pivots on W1), no lines are drawn and the panel explains why.
  • A day that opens right on a level is left out of that level's statistics and does not alert for it.
  • Each instance removes only its own objects. When you run more than one, move one panel (corner or offset) so they do not overlap.
  • It loads in a fraction of a second with 100,000 bars.

Risk notice: trading involves substantial risk of loss. Einstein Pivot Point Pro is an analysis tool and does not open trades. Its statistics describe how the price behaved in the past and do not guarantee future results.
Produits recommandés
AutoFibonacci draws Fibonacci retracement and extension levels automatically. It finds the significant swing high and low on the chart itself, so the levels appear without you drawing anything, and they update as new highs and lows form. Drawing Fibonacci by hand has a practical problem: you choose the swing. Two traders looking at the same chart pick different points and get different levels. This indicator removes that step. It works on any symbol and any timeframe. How the range is chosen Thr
FREE
Harmonic Pattern Suite Pro Introduction Harmonic Pattern Suite Pro is an indicator designed to identify and display harmonic structures on the chart based on X-A-B-C-D sequences. Its purpose is to present pattern formations that meet geometric and proportional criteria, providing a clear visual representation directly on the chart. The indicator automates the detection process, removing the need for manual measurement of ratios and allowing the user to review the structural configuration withou
FREE
Important Lines
Terence Gronowski
4.88 (24)
This indicator displays Pivot-Lines, preday high and low, preday close and the minimum and maximum of the previous hour. You just have to put this single indicator to the chart to have all these important lines, no need to setup many single indicators. Why certain lines are important Preday high and low : These are watched by traders who trade in a daily chart. Very often, if price climbs over or falls under a preday low/high there is an acceleration in buying/selling. It is a breakout out of a
FREE
Dynamic Pivot Zones
Vincent Jose Proenca
Dynamic Pivot Zones – Your Level Assistant on the Chart This indicator is a bit like a GPS for your trading . It shows you where the price likes to hang out, where it gets nervous, and where it flies through. No more calculating pivots by hand or guessing support and resistance levels. What it does: Automatically plots H1, H4, and D1 pivots . Shows support and resistance zones : R1, R2, S1, S2. Lines are colored and easy to read , so you can instantly see what’s hot or cold. Why you’ll love it:
FREE
This indicator is stand alone version from  MP Pivot Levels  (All in one) containing Woodie Pivots. Woodie’s pivot points are made up of multiple key levels, calculated from past price points, in order to frame trades in a simplistic manner. The key levels include the ‘pivot’ itself, and multiple support and resistance levels (usually up to three each). Traders use these levels as a guide for future price movements when setting up trades. The pivot : (Previous high + previous low + 2 x previous
FREE
Pivot Point Fibo RSJ est un indicateur qui trace les lignes de support et de résistance de la journée en utilisant les taux de Fibonacci. Cet indicateur spectaculaire crée jusqu'à 7 niveaux de support et de résistance via Pivot Point en utilisant les taux de Fibonacci. C'est fantastique de voir comment les prix respectent chaque niveau de ce support et de cette résistance, où il est possible de percevoir les points d'entrée/sortie possibles d'une opération. Caractéristiques Jusqu'à 7 niveaux
FREE
Smc Session Killzone and Breakout The Smc Session Killzone and Breakout indicator automates the institutional session trading model for MetaTrader 5. It draws the Asian, London, and New York session ranges as labelled boxes on the chart, detects when price sweeps beyond the Asian session high or low, and fires a non-repainting entry signal after a Market Structure Shift is confirmed. All signals are based on closed bars and do not repaint. The underlying model follows the sequence that institut
FREE
Dynamic Key Levels
Rodrigo Ivan Ahumada Pena
Key Levels S/R — Dynamic Support & Resistance Structure Key Levels S/R is a precise and reliable indicator that identifies true Support and Resistance levels based on confirmed swing structure. Instead of guessing or repainting, it waits for market validation before marking any level — giving traders clean, trustworthy zones to work with. This tool is ideal for breakout traders, pullback traders, and anyone who uses pending orders at structurally meaningful price levels. How the Logic Works The
FREE
Pivot Points are used by Forex traders to find support and resistance levels based on the previous day's price action. There are various ways to calculate pivot points, including averaging the open, high, low, and close of the previous day's chart price. Forex Traders use a combination of pivot points with moving averages to find trading opportunities in the currency markets. Pivot points are very useful tools that use the previous bars' highs, lows and closings to project support and resist
FREE
B2U Market State System Part of the B2U Market State System A professional indicator suite designed to analyze market structure, trend state, and momentum. B2U Market State System 의 구성 요소입니다. 시장 구조, 추세 상태, 모멘텀을 입체적으로 분석하기 위한 전문 인디케이터 시스템입니다. Highlights structurally validated reaction zones after FVG inversion. The New Generation of Inversion Fair Value Gaps B2U IFVG BOX & Zone visually analyzes market reaction zones formed after Fair Value Gap (FVG) inversion. 차세대 Inversion Fair Value Gaps FVG 반
FREE
Support and Resistance Levels with Breaks is a MetaTrader 5 indicator designed to detect important support and resistance levels based on pivot points and identify price breaks with volume confirmation. The indicator analyzes price movements around key market levels and highlights breakouts only when the volume condition is satisfied. This helps traders distinguish stronger price movements from low-volume level breaks. There are even better indicators—get them here. https://www.mql5.com/en/users
FREE
Daily Support and Resistance Levels est un indicateur professionnel qui calcule et affiche automatiquement les niveaux clés de prix pour le trading intraday selon la méthode classique des Points Pivots. Fonctionnalités clés : Calcul automatique du Point Pivot (PP) 3 niveaux de résistance (R1, R2, R3) 3 niveaux de support (S1, S2, S3) Affichage du plus haut/bas de la veille Panneau d’information en temps réel Indicateur de biais du marché (Haussier/Baissier) Distance aux niveaux les plus proches
FREE
ZigZag Support and Resistance Levels
Tshidiso Ephraim Mpakanyane
2 (1)
ZigZag Support and Resistance Levels (v2.0)  est un indicateur pour MetaTrader 5 qui identifie les niveaux de support et de résistance à partir des points pivots du ZigZag, avec désormais un panneau de contrôle interactif directement sur le graphique. Il regroupe les niveaux proches en zones à l’aide d’une méthode de clustering afin de faciliter la visualisation des zones où le prix a réagi à plusieurs reprises, et distingue les niveaux cassés (breakout) des niveaux actifs (extension). Principa
FREE
Pivot MT5
Dmitrij Isaenko
The indicator draws daily support and resistance lines on the chart, as well as the Pivot level (reversal level). Adapted to work in MT5 The standard timeframe for calculating support and resistance levels is D1. You can choose other timeframes according to your strategy (for example, for M1-M15, the optimal timeframe for calculations is H1) The function for calculating support and resistance levels has been updated; in this calculation option, fibonacci levels are taken into account, respec
FREE
Little useful tool - you manually select range on chart by dragging vertical blue lines and indicator shows support and resistance zones for this range and extends them outside of selected range.  Useful for: * Range trading * Range breakout * Range breakout & retest * Good entry during pullback in trend phase when previous high is retested * Good for scalping on short timeframes * Good for trades on longer timeframes around selected important zones like daily high or low
FREE
Professional Support & Resistance PRO Trade with Confidence. Let the Market Structure Guide You. Professional Support & Resistance PRO is an advanced MT5 indicator that automatically detects and plots high-probability Support and Resistance levels using intelligent price action analysis. Instead of cluttering your chart with unnecessary lines, it identifies the most significant levels where the market is most likely to react. Whether you're a scalper, day trader, swing trader, or position trader
FREE
DS Smart Concepts SMC
Darkstone Capital LTD
Darkstone Smart Concepts SMC V1.2 Smart Money Concepts Market Structure Indicator for MetaTrader 5 Darkstone Smart Concepts SMC V1.2 is a MetaTrader 5 indicator designed to display Smart Money Concepts market structure elements directly on the chart. The indicator provides automated visual analysis of: Break of Structure (BOS) Change of Character (CHoCH) Fair Value Gaps (FVG) Order Blocks Liquidity levels Displacement movements Premium and Discount zones The system is designed to help traders an
FREE
Dual Striker - un nouvel Expert Advisor pour le trading de l'Or. Signal en direct +150% ->   Compte Réel Sans Martingale ni moyennage de positions Testez-le gratuitement dans votre plateforme de trading :   Expert Advisor Dual Striker Candle Countdown — Temps précis jusqu’à la clôture de la bougie pour MT5 Candle Countdown est un outil simple et précis qui affiche le temps restant avant la clôture de la bougie actuelle directement sur le graphique. Lorsque l’entrée dépend de la clôture de la b
FREE
PivotForge
Alexandre Vincent Traber
Aperçu PivotForge calcule et trace les Points Pivots Journaliers ou Hebdomadaires directement sur votre graphique, avec la méthode Classique ou Fibonacci. Les niveaux se mettent à jour automatiquement au début de chaque nouvelle période. Fonctionnement Utilise la dernière bougie journalière ou hebdomadaire complétée comme période de référence Calcule le Pivot (PP), les Résistances (R1-R3) et Supports (S1-S3) via formules Classiques ou Fibonacci Trace des lignes horizontales sur toute la période
FREE
Supertrend Premium Institutional Edition   is an advanced ATR-based trend-following indicator designed to identify market direction, generate entry signals, and provide real-time trading information. The indicator automatically detects   bullish and bearish trends , displays   buy and sell signals   when trend reversals occur, and includes a professional dashboard showing current trend status, ATR value, active trend band, and signal direction. Key features include: Automatic trend detection usi
FREE
Nexora EA Monitoring System — Free Remote Position Monitor for MetaTrader 5 (VPS-Friendly) Nexora Monitor is a free, read-only MetaTrader 5 indicator that displays a live dashboard of your open positions — designed for traders who run an Expert Advisor on a VPS and want to check its status from a separate MT5 desktop terminal without remoting into the VPS itself. Attach it to a chart on any MT5 desktop terminal (Windows or Mac) logged into the same trading account and it reconstructs a clear s
FREE
AliPivot Points is a Meta Trader 5 Indicator that draws you the latest pivot points. You can choose from timeframes ranging from 1 Minute to 1 Month. Calculation methods for pivot points includes: Classic Pivot Points Camarilla Pivot Points Fibonacci Pivot Points Woodie Pivot Points You can personalize the line colors, style, and width to suit your preference. The indicator displays values on the right side of the chart. AliPivot Points values can also be utilized by developers for creating Expe
FREE
Automatic Trendlines
Pasi Hakamaki
4.69 (51)
The indicator draws trendlines on chart. This indicator has six inputs. User can specify alternative labels for both lines. If multiple instances of the indicator are used, the labels must differ. User can set width and color of the lines and depth which specifies what significant peaks should be used. For example, Depth=10 sets trendlines using the current peaks and valleys that have at least 10 bars to the right and to the left and that have highs/lows less/greater than the peak's high/low. In
FREE
PZ Penta O MT5
PZ TRADING SLU
3.8 (5)
The Penta-O is a 6-point retracement harmonacci pattern which usually precedes big market movements. Penta-O patterns can expand and repaint quite a bit. To make things easier this indicator implements a twist: it waits for a donchian breakout in the right direction before signaling the trade. The end result is an otherwise repainting indicator with a very reliable trading signal. The donchian breakout period is entered as an input. [ Installation Guide | Update Guide | Troubleshooting | FAQ | A
FREE
Italo Levels Indicator MT5
Italo Santana Gomes
5 (6)
BUY INDICATOR AND GET EA FOR FREE AS A BONUS + SOME OTHER GIFTS! ITALO LEVELS INDICATOR  is the best levels indicator ever created, and why is that? Using high volume zones on the market and Fibonacci the Indicator works on all time-frames and assets, indicator built after 7 years of experience on forex and many other markets. You know many levels indicators around the internet are not complete, does not help, and it's difficult to trade, but the   Italo Levels Indicator is different , the Ital
Rainbow MT5
Jamal El Alama
4 (1)
Description : Rainbow MT5 is a technical indicator based on Moving Average with period 34 and very easy to use. When price crosses above MA and MA changes color to green, then this is a signal to buy. When price crosses below MA and MA changes color to red, then this is a signal to sell. The Expert advisor ( Rainbow EA MT5 ) based on Rainbow MT5 indicator is now available here . MT4 version is available here .
FREE
Get ALERTS for break of your TRENDLINES, SUPPORT LINES, RESISTANCE LINE, ANY LINE!! 1. Draw a line on the chart (Trend, support, resistance, whatever you like) and give it a name (e.g. MY EURUSD line) 2. Load the Indicator and input the Line Name the same name in Indicator INPUT so system knows the name of your line (= MY EURUSD line) 3. Get Alerts when Price breaks the line and closes Works on All Time frames and charts LEAVE A COMMENT AND IF THERE IS ENOUGH INTEREST I WILL WRITE AN EA WHICH W
FREE
The Advanced Support and Resistance Indicator for MetaTrader 5 leverages sophisticated pivot point detection algorithms to autonomously identify and visualize critical price levels on the chart. Utilizing a configurable pivot period (default: 20 bars) and data source (High/Low or Open/Close), it intelligently scans historical price action within a user-defined loopback window (default: 290 bars) to pinpoint pivot highs and lows with strict validation criteria for enhanced precision. Pivots are d
FREE
The   Pivot Point indicator   automatically calculates and displays the pivot point line and support and resistance levels. Pivot can be calculated according to the Classic, Floor, Fibonacci, Woodie, Camarilla or DeMark formula. It is also possible to select the period for calculating the indicator. A trader can choose from daily, weekly, monthly, or user-defined periods. Types of pivots Classic Floor Fibonacci Woodie Camarilla DeMark Main features The indicator shows the current and historic
FREE
MT4 Version Most indicators draw lines. This one draws the battlefield. If you ever bought an EA or indicator based on a perfect equity curve — and then watched it bleed out live — you’re not alone. The problem? Static logic in a dynamic market. Fibonacci Bollinger Bands   adapts. It combines Bollinger structure with customizable Fibonacci levels to mark   zones of control   — where price reacts, pauses, or reverses. No magic. Just logic that follows volatility. Why this tool matters   It
FREE
Les acheteurs de ce produit ont également acheté
SMART TREND TRADING SYSTEM — OFFRE SPÉCIALE Votre système de trading. Votre EA d’automatisation. Votre formation et votre accompagnement. Achetez Smart Trend Trading System pour MT5 à 99 USD et recevez Smart Universal Expert Advisor GRATUITEMENT pour automatiser ses signaux. STTS réunit la direction de la tendance, les signaux d’entrée et de sortie, les zones de retournement et les niveaux de prix importants directement sur votre graphique. Suivez le système manuellement ou connectez l’EA inclus
Trend Sniper X
Sarvarbek Abduvoxobov
4.9 (39)
Trend Sniper X est un indicateur de suivi de tendance multi-unités de temps pour MetaTrader 5 qui aide les traders à identifier la direction de la tendance et les points d'inversion potentiels avec clarté et précision. pour MT4: https://www.mql5.com/en/market/product/193245 Informations sur le prix : Le prix actuel est un prix promotionnel et est susceptible de changer lors des prochaines mises à jour et nouvelles fonctionnalités. Offre bonus : Pour obtenir GRATUITEMENT l'Auto-Trade Assistant E
Neuro Poseidon MT5
Daria Rezueva
4.75 (53)
Neuro Poseidon is a new indicator by Daria Rezueva. It combines precise trading signals with adaptive TP/SL levels - creating best possible trades as a result! Message me and get  Neuro Poseidon Assistant  as a gift to automize your trading process! What makes it stand out? 1. Proven profitability on all assets and timeframes 2. Only confirmed BUY and SELL signals present on the chart 3. Adaptive TP & SL levels generated by the software for each trade 4. Easy to understand - suitable for al
Zoryk Gold
Reda El Koutbane
5 (12)
ZORYK — Système avancé de signaux XAUUSD pour MetaTrader 5 Vous connaissez certainement cette sensation. Vous passez du temps à analyser l’or. Vous attendez le bon point d’entrée. Vous ouvrez enfin la position, puis le prix commence immédiatement à évoluer contre vous. Vous fermez trop tôt, déplacez le Stop Loss ou hésitez pendant quelques secondes. Ensuite, le marché atteint exactement l’objectif que vous aviez initialement prévu, mais sans vous dans la position. Le problème n’était pas toujour
SuperScalp Pro
Van Minh Nguyen
4.65 (34)
SuperScalp Pro - Professional Multi-Layer Confluence Scalping System SuperScalp Pro est un indicateur avancé de scalping qui améliore le Supertrend classique grâce à plusieurs filtres intelligents de confirmation. Il aide à identifier des opportunités de Buy/Sell présentant une probabilité plus élevée, tout en réduisant considérablement les faux signaux. Des flèches Buy et Sell claires apparaissent directement sur le graphique, tandis que les niveaux de Stop Loss et Take Profit basés sur l’ATR s
Commençons par être honnêtes. Aucun indicateur ne vous rendra rentable à lui seul. Si quelqu’un vous dit le contraire, il vous vend un rêve. Tout indicateur qui affiche des flèches parfaites d’achat/vente peut être rendu impeccable — il suffit de zoomer sur la bonne partie de l’historique et de capturer uniquement les trades gagnants. Nous ne faisons pas cela.  SMC Intraday Formula est un outil. Il lit la structure du marché pour vous, identifie les zones de prix à la probabilité la plus élevée
Gann Made Easy   est un système de trading Forex professionnel et facile à utiliser qui est basé sur les meilleurs principes de trading en utilisant la théorie de mr. WD Gann. L'indicateur fournit des signaux d'ACHAT et de VENTE précis, y compris les niveaux Stop Loss et Take Profit. Vous pouvez échanger même en déplacement en utilisant les notifications PUSH. VEUILLEZ ME CONTACTER APRÈS L'ACHAT POUR RECEVOIR GRATUITEMENT DES INSTRUCTIONS DE TRADING ET D'EXCELLENTS INDICATEURS SUPPLÉMENTAIRES! V
Unix Scalper
Issam Kassas
4 (4)
UNIX SCALPER — OFFRE SPÉCIALE Repérez la configuration. Consultez le plan. Choisissez comment intervenir. Achetez UNIX Scalper pour MT5 à 99 USD et recevez Smart Universal Expert Advisor GRATUITEMENT pour automatiser ses signaux. UNIX Scalper réunit l’analyse du marché, les décisions BUY/SELL/WAIT et les niveaux Entry, Stop Loss, TP1 et TP2 dans un panneau organisé. Suivez le plan de trading manuellement ou connectez l’EA inclus pour une exécution automatique selon vos paramètres. Le prix actuel
M1 Sniper MT5
Oleg Rodin
5 (7)
M1 SNIPER   est un système d'indicateurs de trading facile à utiliser. Il s'agit d'un indicateur à flèche conçu pour l'unité de temps M1. Cet indicateur peut être utilisé seul pour le scalping sur l'unité de temps M1 ou intégré à votre système de trading existant. Bien que conçu spécifiquement pour le trading sur l'unité de temps M1, ce système peut également être utilisé avec d'autres unités de temps. Initialement, j'avais conçu cette méthode pour le trading du XAUUSD et du BTCUSD. Cependant, j
GoldenX Entry MT5
Kareem Abbas
5 (16)
GoldenX Entry est un indicateur MT5 doté d’un algorithme adaptatif Smart Entry Trend, d’un système de scoring des signaux, d’un détecteur de régime de marché et d’un filtre de volatilité. Chaque signal inclut un niveau d’entrée calculé, trois niveaux de Take-Profit (TP1, TP2, TP3) ainsi qu’un niveau de Stop-Loss. Il est construit sur plusieurs couches analytiques conçues pour s’adapter à différentes conditions de marché, combinant un système analytique multicouche avec un optimiseur intégré et u
La légende est de retour : Entry Points Pro 10. La relance de l'indicateur légendaire qui s'est maintenu 3 ans dans le Top-3 du MQL5 Market. Des centaines d'avis enthousiastes (589 sur les deux versions), des milliers de traders l'utilisent chaque jour, 31 000+ téléchargements de la démo   MT4+MT5 . J'ai lu chacun de vos avis publiés en cinq ans — et au lieu de promettre, j'ai intégré les réponses directement dans la version 10. Par un auteur présent sur les marchés depuis 1999, qui tient à l'ho
Reversion King Indicator
Eugen-alexandru Zibileanu
5 (9)
Un nouveau Roi en ville - Indicateur + Gestion des ordres (TP1 + TP2 + TP3) + Envoi optionnel de signaux Telegram INCLUS (GRATUIT) (SYSTÈME COMPLET DE TRADING et DE SIGNAUX) Notre meilleur EA pour l’Or : Gold Slayer Cet indicateur inclut une stratégie avancée, un système de trading avec gestion des ordres personnalisable ainsi qu’un système de retour à la moyenne combinant des extensions d’enveloppes, soutenu par plusieurs filtres intelligents de confirmation comme le RSI afin de détecter des en
Tokyo mt5 Indicator
Vasiliy Strukov
5 (1)
Le Tokyo Indicator offre une vue d'ensemble visuelle et claire de l'orientation de la tendance, des signaux de trading potentiels et des conditions du marché. Sa ligne de tendance en escalier, codée par couleur, distingue les phases haussières (en bleu) des phases baissières (en magenta). Des flèches directionnelles associées mettent en évidence les opportunités d'achat et de vente potentielles lors des changements de tendance. Un tableau de bord intégré regroupe le signal actuel, l'orientation
Welcome to ENTRY IN THE ZONE AND SMC MULTI TIMEFRAME Entry In The Zone and SMC Multi Timeframe is a real-time market analysis tool based on Smart Money Concepts (SMC), designed to analyze market structure, price direction, and key trading zones. It supports both Single-Timeframe Analysis and Multi-Timeframe Analysis, providing a clearer view of the overall market structure across multiple timeframes, with real-time BUY / SELL signals that do not repaint. It is designed to help filter trading opp
Market Structure Order Block Dashboard MT5 est un indicateur MT5 conçu pour les traders qui veulent lire la structure de marché et les principales zones de réaction du prix directement sur le graphique. Il combine BOS, ChoCH, Order Blocks, Fair Value Gaps (FVG), Liquidité, Kill Zones, Volume Profile, et un dashboard compact pour une analyse rapide. Cet indicateur s'adresse aux traders qui utilisent la structure de marché, les concepts ICT et Smart Money comme cadre de décision. Il peut aider à r
Adaptive Price Action Engine Achetez un indicateur, obtenez l'EA gratuitement Analyse auto-optimisée des tendances et des figures de chandeliers Multi-Timeframe Les marchés évoluent constamment, et tous les modèles de Price Action n’ont pas la même valeur dans toutes les conditions de marché. Adaptive Price Action Engine a été conçu pour s’adapter aux changements du marché en combinant structure de tendance, analyse Multi-Timeframe, figures de chandeliers et optimisation statistique au sein d’un
Currency Strength Wizard   est un indicateur très puissant qui vous offre une solution tout-en-un pour un trading réussi. L'indicateur calcule la puissance de telle ou telle paire de devises en utilisant les données de toutes les devises sur plusieurs périodes. Ces données sont représentées sous la forme d'un indice de devise facile à utiliser et de lignes électriques de devise que vous pouvez utiliser pour voir la puissance de telle ou telle devise. Tout ce dont vous avez besoin est d'attacher
FiboSniper Pro
Van Minh Nguyen
5 (3)
FiboSniper Pro – Multi-Filter Fibonacci System with Auto SL/TP and Control Panel FiboSniper Pro est un indicateur technique qui combine des Fibonacci Envelopes dynamiques avec plusieurs filtres de confirmation afin de générer des signaux Buy et Sell sélectionnés. Les niveaux de Fibonacci sont calculés à partir de Moving Average et ATR, puis filtrés par ADX, EMA, RSI, ATR, Volume, Time et la structure des bougies. L’indicateur affiche directement sur le graphique les niveaux automatiques de Stop
Atomic Analyst MT5
Issam Kassas
4.45 (58)
ATOMIC ANALYST — OFFRE SPÉCIALE Votre analyse de marché. Votre EA d’automatisation. Votre formation et votre accompagnement. Achetez Atomic Analyst pour MT5 à 99 USD et recevez Smart Universal Expert Advisor GRATUITEMENT pour automatiser ses signaux. Atomic Analyst réunit l’action des prix, la direction de la tendance, les signaux d’entrée et de sortie, le Stop Loss et plusieurs niveaux de Take Profit directement sur votre graphique. Tradez manuellement à l’aide de son analyse ou connectez l’EA
Divergence Bomber
Ihor Otkydach
4.89 (94)
Chaque acheteur de cet indicateur reçoit également gratuitement : L’outil exclusif « Bomber Utility », qui accompagne automatiquement chaque opération de trading, fixe les niveaux de Stop Loss et de Take Profit, et clôture les positions selon les règles de la stratégie Des fichiers de configuration (set files) pour adapter l’indicateur à différents actifs Des set files pour configurer le Bomber Utility selon différents modes : « Risque Minimum », « Risque Équilibré » et « Stratégie d’Attente »
SMART PRICE ACTION CONCEPTS — OFFRE SPÉCIALE Observez la structure. Identifiez les zones. Construisez votre plan de trading. Achetez Smart Price Action Concepts pour MT5 à 49 USD et recevez Smart Universal Expert Advisor GRATUITEMENT. Réunissez Smart Money Concepts (SMC), analyse de style ICT et action des prix sur un graphique organisé. Identifiez la structure du marché, les blocs d’ordres, les niveaux de référence de liquidité et les déséquilibres, puis choisissez les éléments à afficher avec
Superhero
Ihor Otkydach
5 (3)
L'indicateur SUPERHERO est un système de trading multidevises conçu selon un principe « tout compris ». Cet indicateur analyse le marché de manière autonome et fournit des signaux indiquant quand ouvrir et clôturer des positions. Il utilise des ordres Stop Loss et Take Profit. Le rapport R:R est de 1:1. Ce système peut envoyer des notifications push sur votre smartphone, ce qui vous permet de passer des ordres « où que vous soyez », sans avoir à rester devant un ordinateur. C'est la solution idé
Volatility Master for MetaTrader is a real-time dashboard tool that scans up to  50 symbols  to identify high-volatility , trending markets instantly. With bullish/bearish signals, customizable alerts, and a user-friendly interface, it helps you avoid range-bound conditions and focus on high-probability trades. Clarity leads to confidence. Trade confidently and protect your capital effectively with this powerful dashboard. We don't offer free or bonus indicators in exchange of reviews from you.
Power Candles MT5
Daniel Stein
4.58 (12)
Power Candles V3 - Indicateur de force à optimisation automatique Power Candles V3 transforme la force des devises et des instruments en un plan de trading exploitable sur chaque graphique auquel il est associé. Au lieu de se contenter de colorer les bougies, il effectue une optimisation automatique en temps réel en arrière-plan et vous fournit les meilleurs niveaux de Stop Loss, Take Profit et seuils de signal pour le symbole que vous avez sous les yeux. Un simple clic suffit pour l'adopter en
Axiom Matrix
Issam Kassas
5 (8)
Axiom Matrix — OFFRE SPÉCIALE Achetez Axiom Matrix pour 49 USD et recevez Smart Universal Expert Advisor GRATUITEMENT. Explorez le marché. Comparez les configurations. Choisissez votre graphique. Axiom Matrix réunit l’analyse de plusieurs symboles et unités de temps dans un tableau de bord. Repérez où concentrer votre attention sans ouvrir chaque graphique. Analysez les symboles de l’Observation du marché ou votre sélection sur plusieurs unités de temps. Comparez tendance, momentum, volume, vola
Trend Catcher ind mt5
Ramil Minniakhmetov
5 (18)
INDICATEUR DE DÉTECTEUR DE TENDANCE L'indicateur de détecteur de tendance analyse les mouvements de prix du marché grâce à une combinaison d'indicateurs d'analyse de tendance adaptatifs, propriétaires et personnalisés. Il identifie la véritable direction du marché en filtrant les fluctuations à court terme et en se concentrant sur la force de la dynamique sous-jacente, l'expansion de la volatilité et la structure des prix. Il utilise également une combinaison d'indicateurs personnalisés de lis
IQ FX Gann Levels a precision trading indicator based on W.D. Gann’s square root methods . It plots real-time, non-repainting support and resistance levels to help traders confidently spot intraday and scalping opportunities with high accuracy. William Delbert Gann (W.D. Gann) was an exceptional market analyst, whose trading technique was based on a complex blend of mathematics, geometry, astrology, and ancient mathematics which proved to be extremely accurate. We don't offer free or bonus indic
RelicusRoad Pro MT5
Relicus LLC
4.96 (24)
RelicusRoad Pro : Système d'Exploitation Quantitatif du Marché 70% DE RÉDUCTION ACCÈS À VIE (DURÉE LIMITÉE) - REJOIGNEZ 2 000+ TRADERS Pourquoi la plupart des traders échouent-ils même avec des indicateurs "parfaits" ? Parce qu'ils tradent des concepts isolés dans le vide. Un signal sans contexte est un pari. Pour gagner, il faut de la CONFLUENCE . RelicusRoad Pro est un Écosystème Quantitatif complet . Il cartographie la "Fair Value Road", distinguant le bruit des cassures structurelles. Arrête
ATstrong
Zaha Feiz
5 (1)
ATSTRONG PRO: Indicateur de Structure de Marché & Cassure Moteur de Détection de Cassures | 5 Cibles TP Dynamiques | Tableau de Bord en Direct | Sans Repainting Prix de Lancement Prix Actuel: 59 $ — Le prix augmente de 10 $ après chaque 10 ventes. ATSTRONG PRO est un indicateur avancé de cassure (breakout) et de structure de marché institutionnelle conçu pour MetaTrader 5. Il détecte les pivots de swing à haute probabilité, identifie les zones d'accumulation groupées de support et de résistan
CRT Candle Range Theory HTF MT5 - Ultimate CRT Indicator : Concepts ICT avancés et système de trading Malaysian SnR Maîtrisez les traces des Market Makers avec l'indicateur Candle Range Theory le plus avancé. Libérez la véritable puissance des Smart Money Concepts (SMC) et tradez avec la même précision que les institutions grâce à l'Ultimate CRT Indicator. Conçu exclusivement pour les traders sérieux, cet indicateur automatise la théorie CRT, un pilier central des concepts ICT (Inner Circle Trad
Plus de l'auteur
Einstein Pivot Point
Luis Cesar Nunes Dos Santos
Einstein Pivot Point indicator shows you hourly, weekly or monthly pivot points and support and resistance levels. You can choose 3 different formula for the support and resistance levels (Classic Formula, Woodie Pivot Points and Fibonacci Pivot Points). Einstein Pivot Point   will automatically calculate the p ivot point   and   support  and  resistance levels  on the basis of market data. Trading requires reference points (support and resistance), which are used to determine when to enter the
Filtrer:
Aucun avis
Répondre à l'avis