Einstein Pivot Point Pro

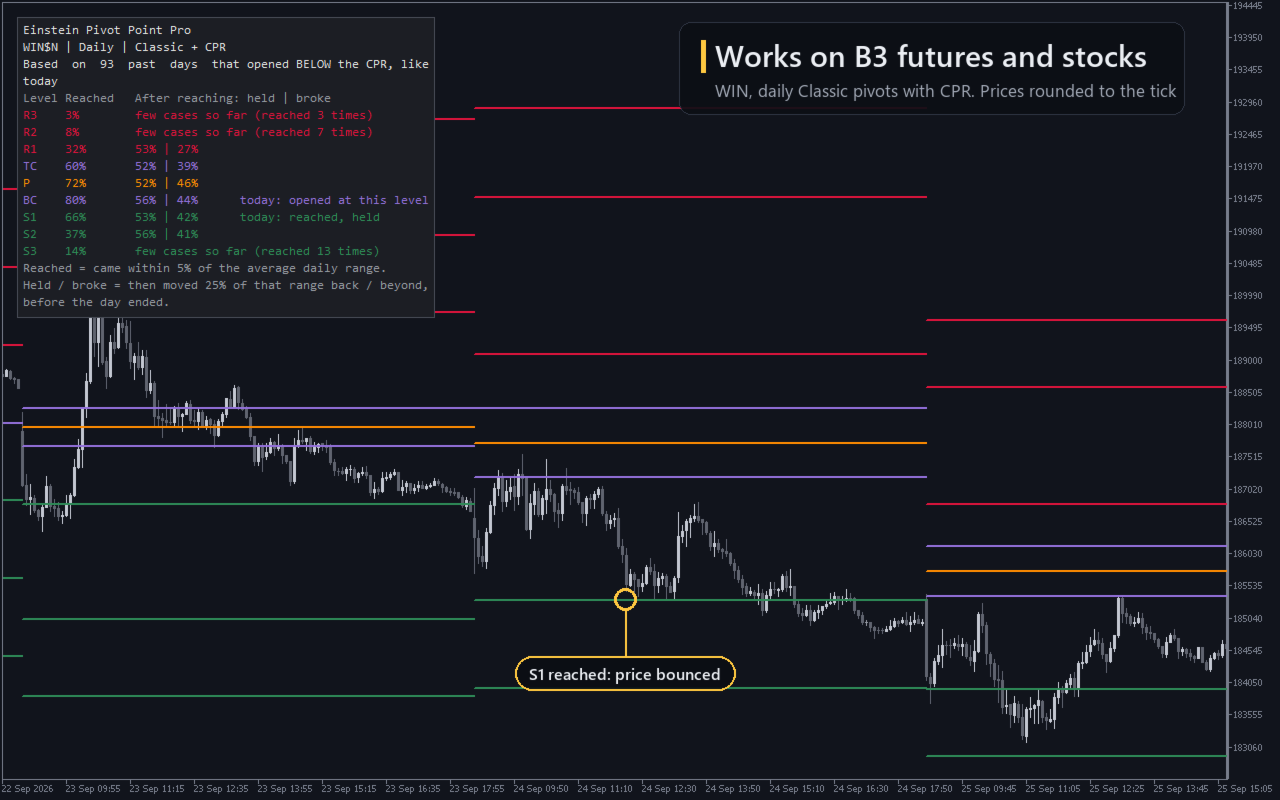
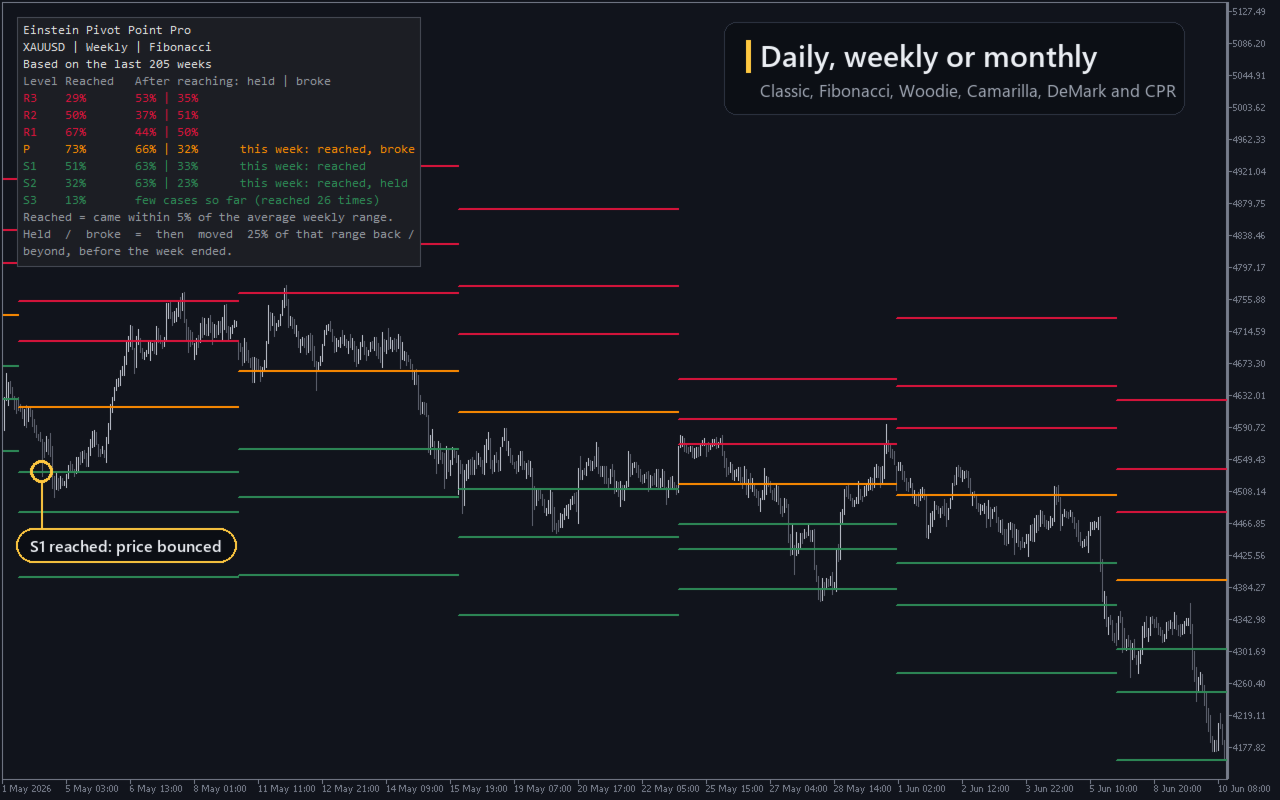
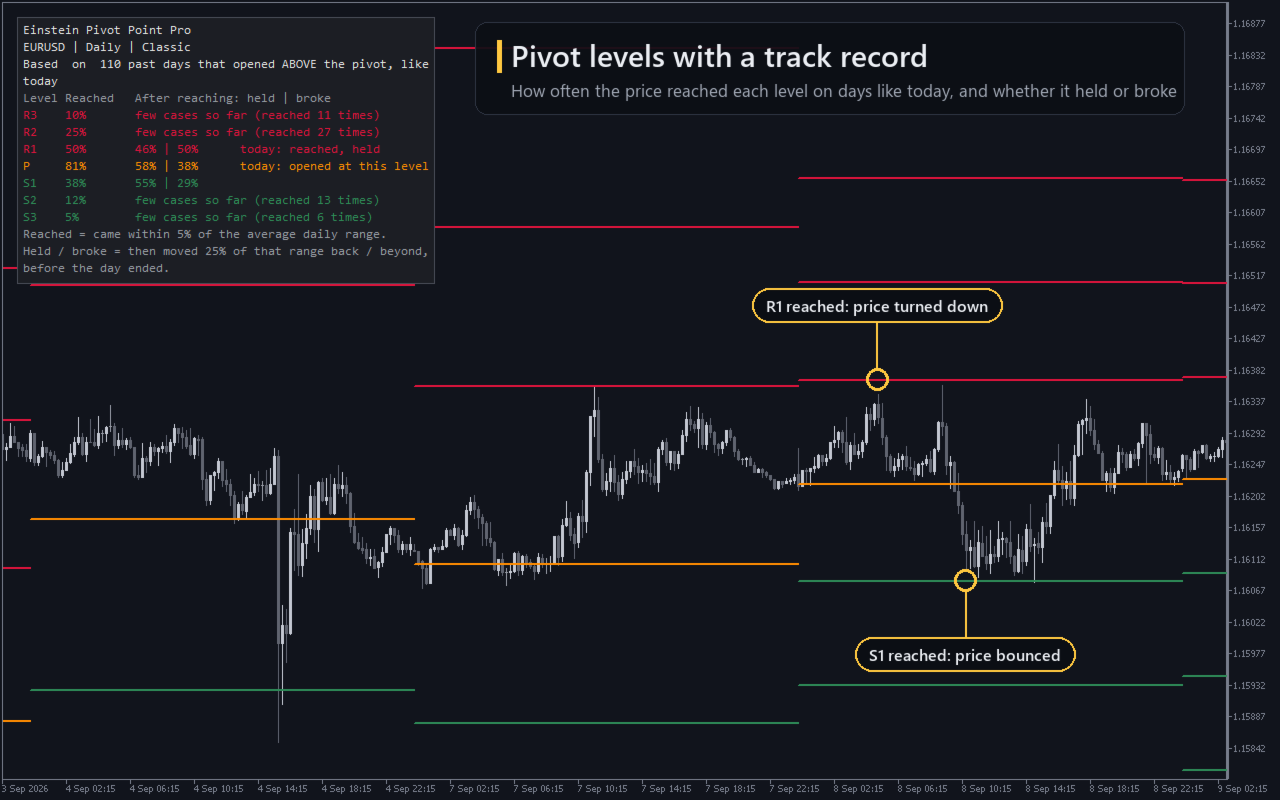
Einstein Pivot Point Pro draws daily, weekly or monthly pivot levels and shows how the price behaved at each level in the past, on days like today.

Most pivot indicators stop at the lines. This one adds a small panel that answers three plain questions for every level:

  • Reached: how often did the price get to this level?
  • Held: when it got there, how often did it come back?
  • Broke: and how often did it go through?

The numbers only count past days that looked like today. By default, "like today" means days that opened on the same side of the pivot: if today opened above P, the panel counts only past days that also opened above P.

HOW TO READ THE PANEL

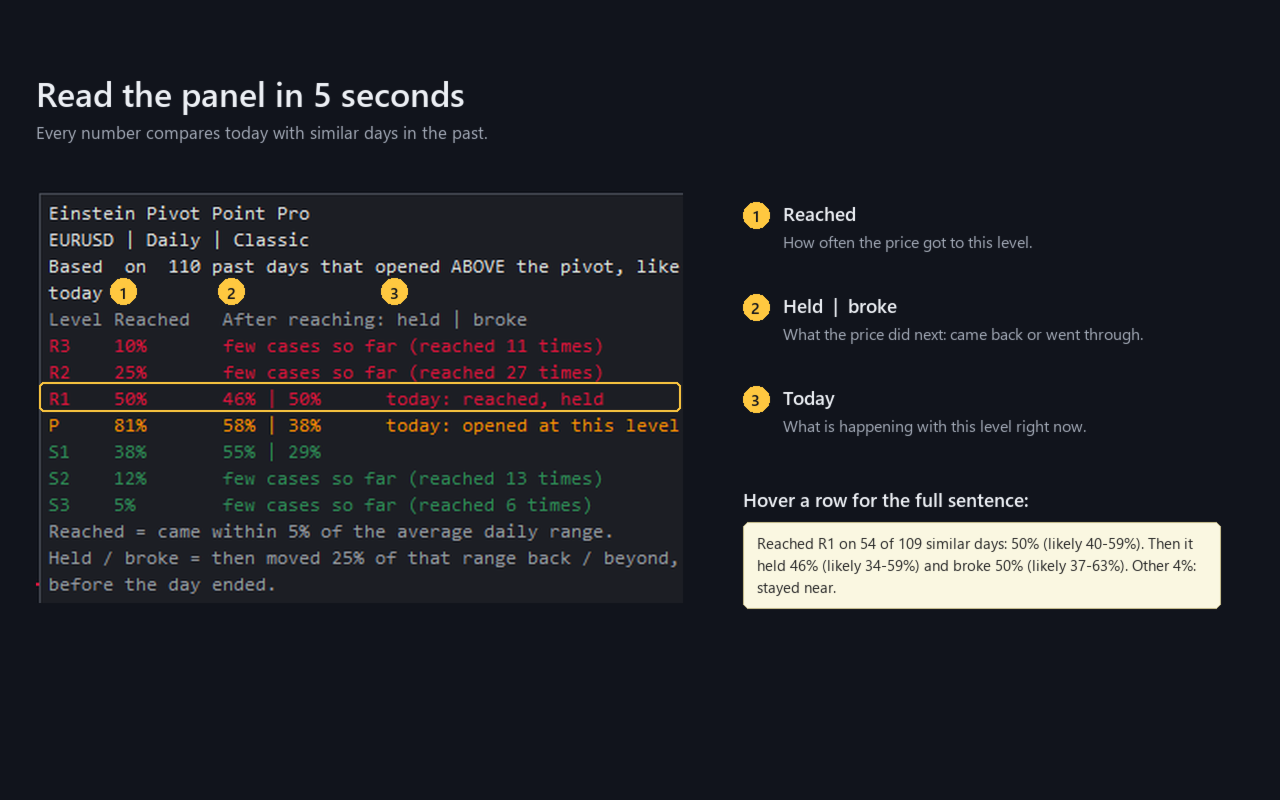
Example taken from a EURUSD chart (the numbers change with the symbol and with each new day):

  • Header: "Based on 110 past days that opened ABOVE the pivot, like today"
  • Row: R1 | 50% | 46% | 50% | today: reached, held

This row means: on 50% of those 110 days the price reached R1. When it did, it came back 46% of the time and went through 50% of the time (in the other 4%, the price stayed near the level until the end of the day). Today the price has already reached R1 and came back.

  • Hover over a row to read it as a sentence, with the likely range of each number, for example "50% (likely 40-59%)".
  • When there are too few similar days to trust a percentage, the panel says "few cases so far" instead of showing a number.
  • The footer explains the rules in plain words, using the values you set.
  • The last column shows what is happening in the current period: reached, reached and held, reached and broke, or opened at this level.

WHAT "REACHED", "HELD" AND "BROKE" MEAN

All distances are measured in the average range of the period (the average daily range, for daily pivots). That is why the same settings work on EURUSD, gold, indices or B3 futures.

  • Reached: the price came within 5% of the average daily range of the level.
  • Held: after reaching it, the price moved 25% of that range back, before the day ended.
  • Broke: after reaching it, the price moved 25% of that range beyond the level, before the day ended.

The first one to happen is the one that counts. The order of events inside the day is read from M15 bars (adjustable), not guessed from a daily candle. If both happen inside the same M15 bar, the day is not counted as held or broke, instead of guessing.

PIVOT FORMULAS

  • Classic, Fibonacci, Woodie (with R3 and S3), Camarilla (R1 to R4, S1 to S4) and DeMark.
  • Optional CPR lines (TC and BC) on top of any formula, including Camarilla.
  • Daily, weekly or monthly pivots. Several instances can run on the same chart, for example daily Classic and weekly Camarilla.

NO REPAINTING

Levels are calculated when each period starts, from the previous closed period, and never change afterwards. In our tests, comparing 355,000 candles in the Strategy Tester, there were 0 differences. The statistics use only closed periods: they stay the same during the period and are updated when a new one starts.

ALERTS

  • Alert when a level is touched: popup (on by default), sound, push notification and e-mail.
  • At most one alert per level per period.
  • Touches that happened before you attached the indicator do not trigger alerts.
  • You choose which levels alert: all of them, only resistances and supports, or only the pivot and CPR.

FOREX AND B3

  • Works on hedging accounts (Forex) and netting accounts (B3).
  • With default settings, the daily open, high, low and close built by the indicator matched the broker's D1 bars on EURUSD, XAUUSD, PETR4 and WIN in our tests.
  • Sunday candle: merge into Monday (default), merge into Friday, keep as a separate day, or ignore.
  • Configurable day start hour, for brokers whose server day does not match your trading day.
  • Optional time window to use only the regular session.
  • Opening gaps are handled: a level jumped by the gap is evaluated from the other side, and the gap itself does not count as a touch.
  • Weeks follow the calendar, so a Monday holiday does not break the week.
  • Label and panel prices are rounded to the symbol's tick (WIN in steps of 5, WDO in steps of 0.5).

FOR EA DEVELOPERS

12 fixed buffers, also shown in the Data Window:

0 P, 1 R1, 2 R2, 3 R3, 4 R4, 5 S1, 6 S2, 7 S3, 8 S4, 9 TC, 10 BC, 11 ATR ref (average range of the period, in price).

  • Levels the chosen formula does not have are EMPTY_VALUE (for example R4 and S4 outside Camarilla).
  • TC and BC are always calculated, even with the CPR lines hidden.
  • Buffer numbers will not change in future versions, and new inputs will only be added at the end of the list.

In iCustom, each input group counts as one parameter: pass the group name before its inputs. From an EA, turn off the panel, the labels and the alerts, otherwise they appear on the EA's chart. Example with default settings:

int handle = iCustom(_Symbol, _Period, "Market\\Einstein Pivot Point Pro",
   "Pivot levels", 0, 0, false,                  // Daily, Classic, CPR lines hidden
   "Sessions", PERIOD_M15, 0, 0, false, "09:00", "18:30",
   "Touch rules", 0.05, 0.25, 0.25, 14,
   "Statistics", true, 250, 1, 30,
   "Alerts", false, 0, true, false, "alert.wav", false, false,   // alerts off
   "Appearance", true, clrDarkOrange, clrCrimson, clrSeaGreen, clrMediumPurple,
   1, STYLE_SOLID, false, true, 8,               // labels off
   "Panel", false);                              // panel off

double r1[];
if(CopyBuffer(handle, 1, 0, 1, r1) == 1 && r1[0] != EMPTY_VALUE)
   Print("R1 now: ", r1[0]);

If the M15 history is not ready when the EA starts, the buffers stay empty until the next tick. Always check for EMPTY_VALUE.

GOOD TO KNOW

  • The statistics can only look as far back as the history in your terminal. With the defaults (daily pivots, M15 bars) that is about 4 years of Forex. For weekly and monthly pivots, set "Calculation timeframe" to H1 and raise "Max bars in chart" (Tools > Options > Charts). Monthly samples stay small, and the panel says so.
  • Daylight saving time is not adjusted automatically. If your broker's server clock does not follow it, the start of the day shifts by one hour for part of the year; adjust "Day starts at hour" if needed.
  • B3: the daily close used is the last trade, not the settlement price. On continuous futures series (such as WIN$ or WIN$N, depending on the broker), the contract roll can shift the levels of the roll day.
  • B3 time window: to use only the regular session, turn on "Use only bars inside a time window" and type the session hours of your symbol, in the server time of your broker. B3 changes its trading hours during the year, so check the current hours.
  • With Woodie or DeMark, the CPR lines use the classic pivot, so the middle of the CPR can differ from the P drawn. This is expected.
  • On a chart timeframe higher than the pivot period (for example daily pivots on W1), no lines are drawn and the panel explains why.
  • A day that opens right on a level is left out of that level's statistics and does not alert for it.
  • Each instance removes only its own objects. When you run more than one, move one panel (corner or offset) so they do not overlap.
  • It loads in a fraction of a second with 100,000 bars.

Risk notice: trading involves substantial risk of loss. Einstein Pivot Point Pro is an analysis tool and does not open trades. Its statistics describe how the price behaved in the past and do not guarantee future results.
Prodotti consigliati
AutoFibonacci draws Fibonacci retracement and extension levels automatically. It finds the significant swing high and low on the chart itself, so the levels appear without you drawing anything, and they update as new highs and lows form. Drawing Fibonacci by hand has a practical problem: you choose the swing. Two traders looking at the same chart pick different points and get different levels. This indicator removes that step. It works on any symbol and any timeframe. How the range is chosen Thr
FREE
Harmonic Pattern Suite Pro Introduction Harmonic Pattern Suite Pro is an indicator designed to identify and display harmonic structures on the chart based on X-A-B-C-D sequences. Its purpose is to present pattern formations that meet geometric and proportional criteria, providing a clear visual representation directly on the chart. The indicator automates the detection process, removing the need for manual measurement of ratios and allowing the user to review the structural configuration withou
FREE
Important Lines
Terence Gronowski
4.88 (24)
This indicator displays Pivot-Lines, preday high and low, preday close and the minimum and maximum of the previous hour. You just have to put this single indicator to the chart to have all these important lines, no need to setup many single indicators. Why certain lines are important Preday high and low : These are watched by traders who trade in a daily chart. Very often, if price climbs over or falls under a preday low/high there is an acceleration in buying/selling. It is a breakout out of a
FREE
Dynamic Pivot Zones
Vincent Jose Proenca
Dynamic Pivot Zones – Your Level Assistant on the Chart This indicator is a bit like a GPS for your trading . It shows you where the price likes to hang out, where it gets nervous, and where it flies through. No more calculating pivots by hand or guessing support and resistance levels. What it does: Automatically plots H1, H4, and D1 pivots . Shows support and resistance zones : R1, R2, S1, S2. Lines are colored and easy to read , so you can instantly see what’s hot or cold. Why you’ll love it:
FREE
This indicator is stand alone version from  MP Pivot Levels  (All in one) containing Woodie Pivots. Woodie’s pivot points are made up of multiple key levels, calculated from past price points, in order to frame trades in a simplistic manner. The key levels include the ‘pivot’ itself, and multiple support and resistance levels (usually up to three each). Traders use these levels as a guide for future price movements when setting up trades. The pivot : (Previous high + previous low + 2 x previous
FREE
Pivot Point Fibo RSJ è un indicatore che traccia le linee di supporto e resistenza del giorno utilizzando i tassi di Fibonacci. Questo spettacolare indicatore crea fino a 7 livelli di supporto e resistenza tramite Pivot Point utilizzando i tassi di Fibonacci. È fantastico come i prezzi rispettino ogni livello di questo supporto e resistenza, dove è possibile percepire possibili punti di entrata/uscita di un'operazione. Caratteristiche Fino a 7 livelli di supporto e 7 livelli di resistenza Im
FREE
Smc Session Killzone and Breakout The Smc Session Killzone and Breakout indicator automates the institutional session trading model for MetaTrader 5. It draws the Asian, London, and New York session ranges as labelled boxes on the chart, detects when price sweeps beyond the Asian session high or low, and fires a non-repainting entry signal after a Market Structure Shift is confirmed. All signals are based on closed bars and do not repaint. The underlying model follows the sequence that institut
FREE
Dynamic Key Levels
Rodrigo Ivan Ahumada Pena
Key Levels S/R — Dynamic Support & Resistance Structure Key Levels S/R is a precise and reliable indicator that identifies true Support and Resistance levels based on confirmed swing structure. Instead of guessing or repainting, it waits for market validation before marking any level — giving traders clean, trustworthy zones to work with. This tool is ideal for breakout traders, pullback traders, and anyone who uses pending orders at structurally meaningful price levels. How the Logic Works The
FREE
Pivot Points are used by Forex traders to find support and resistance levels based on the previous day's price action. There are various ways to calculate pivot points, including averaging the open, high, low, and close of the previous day's chart price. Forex Traders use a combination of pivot points with moving averages to find trading opportunities in the currency markets. Pivot points are very useful tools that use the previous bars' highs, lows and closings to project support and resist
FREE
B2U Market State System Part of the B2U Market State System A professional indicator suite designed to analyze market structure, trend state, and momentum. B2U Market State System 의 구성 요소입니다. 시장 구조, 추세 상태, 모멘텀을 입체적으로 분석하기 위한 전문 인디케이터 시스템입니다. Highlights structurally validated reaction zones after FVG inversion. The New Generation of Inversion Fair Value Gaps B2U IFVG BOX & Zone visually analyzes market reaction zones formed after Fair Value Gap (FVG) inversion. 차세대 Inversion Fair Value Gaps FVG 반
FREE
Support and Resistance Levels with Breaks is a MetaTrader 5 indicator designed to detect important support and resistance levels based on pivot points and identify price breaks with volume confirmation. The indicator analyzes price movements around key market levels and highlights breakouts only when the volume condition is satisfied. This helps traders distinguish stronger price movements from low-volume level breaks. There are even better indicators—get them here. https://www.mql5.com/en/users
FREE
Daily Support and Resistance Levels è un indicatore professionale che calcola e mostra automaticamente i livelli chiave di prezzo per il trading intraday basato sui Punti Pivot classici. Caratteristiche: Calcolo automatico Pivot (PP) 3 resistenze (R1–R3) 3 supporti (S1–S3) Massimo/Minimo del giorno precedente Pannello informativo in tempo reale Bias di mercato (Rialzista/Ribassista) Distanza ai livelli più vicini Colori e stile personalizzabili Aggiornamento automatico giornaliero Funziona su tu
FREE
ZigZag Support and Resistance Levels
Tshidiso Ephraim Mpakanyane
2 (1)
ZigZag Support and Resistance Levels (v2.0)  è un indicatore per MetaTrader 5 che identifica i livelli di supporto e resistenza sulla base dei punti pivot dello ZigZag, ora dotato di un pannello di controllo interattivo direttamente sul grafico. Raggruppa i livelli vicini in zone utilizzando un metodo di clustering, aiutando a visualizzare le aree in cui il prezzo ha reagito più volte, e distingue i livelli rotti (breakout) dai livelli attivi (extension). Caratteristiche principali 1. Rilevamen
FREE
Pivot MT5
Dmitrij Isaenko
The indicator draws daily support and resistance lines on the chart, as well as the Pivot level (reversal level). Adapted to work in MT5 The standard timeframe for calculating support and resistance levels is D1. You can choose other timeframes according to your strategy (for example, for M1-M15, the optimal timeframe for calculations is H1) The function for calculating support and resistance levels has been updated; in this calculation option, fibonacci levels are taken into account, respec
FREE
Little useful tool - you manually select range on chart by dragging vertical blue lines and indicator shows support and resistance zones for this range and extends them outside of selected range.  Useful for: * Range trading * Range breakout * Range breakout & retest * Good entry during pullback in trend phase when previous high is retested * Good for scalping on short timeframes * Good for trades on longer timeframes around selected important zones like daily high or low
FREE
Professional Support & Resistance PRO Trade with Confidence. Let the Market Structure Guide You. Professional Support & Resistance PRO is an advanced MT5 indicator that automatically detects and plots high-probability Support and Resistance levels using intelligent price action analysis. Instead of cluttering your chart with unnecessary lines, it identifies the most significant levels where the market is most likely to react. Whether you're a scalper, day trader, swing trader, or position trader
FREE
DS Smart Concepts SMC
Darkstone Capital LTD
Darkstone Smart Concepts SMC V1.2 Smart Money Concepts Market Structure Indicator for MetaTrader 5 Darkstone Smart Concepts SMC V1.2 is a MetaTrader 5 indicator designed to display Smart Money Concepts market structure elements directly on the chart. The indicator provides automated visual analysis of: Break of Structure (BOS) Change of Character (CHoCH) Fair Value Gaps (FVG) Order Blocks Liquidity levels Displacement movements Premium and Discount zones The system is designed to help traders an
FREE
Dual Striker - un nuovo Expert Advisor per il trading sull'Oro. Segnale live +150% ->   Conto Reale Senza Martingala e senza mediazione delle posizioni Provalo gratuitamente sulla tua piattaforma di trading:   Expert Advisor Dual Striker Candle Countdown — Tempo preciso fino alla chiusura della candela per MT4 Candle Countdown è uno strumento semplice e preciso che mostra il tempo rimanente fino alla chiusura della candela corrente direttamente sul grafico. Quando l’ingresso dipende dalla chiu
FREE
PivotForge
Alexandre Vincent Traber
Panoramica PivotForge calcola e traccia i Punti Pivot Giornalieri o Settimanali direttamente sul grafico, usando il metodo Classico o Fibonacci. I livelli si aggiornano automaticamente all'inizio di ogni nuovo periodo. Come funziona Utilizza la precedente candela giornaliera o settimanale completata come periodo di riferimento Calcola il Pivot (PP), Resistenze (R1-R3) e Supporti (S1-S3) con formule Classiche o Fibonacci Disegna linee orizzontali lungo il periodo corrente, ciascuna etichettata c
FREE
Supertrend Premium Institutional Edition   is an advanced ATR-based trend-following indicator designed to identify market direction, generate entry signals, and provide real-time trading information. The indicator automatically detects   bullish and bearish trends , displays   buy and sell signals   when trend reversals occur, and includes a professional dashboard showing current trend status, ATR value, active trend band, and signal direction. Key features include: Automatic trend detection usi
FREE
Nexora EA Monitoring System — Free Remote Position Monitor for MetaTrader 5 (VPS-Friendly) Nexora Monitor is a free, read-only MetaTrader 5 indicator that displays a live dashboard of your open positions — designed for traders who run an Expert Advisor on a VPS and want to check its status from a separate MT5 desktop terminal without remoting into the VPS itself. Attach it to a chart on any MT5 desktop terminal (Windows or Mac) logged into the same trading account and it reconstructs a clear s
FREE
AliPivot Points is a Meta Trader 5 Indicator that draws you the latest pivot points. You can choose from timeframes ranging from 1 Minute to 1 Month. Calculation methods for pivot points includes: Classic Pivot Points Camarilla Pivot Points Fibonacci Pivot Points Woodie Pivot Points You can personalize the line colors, style, and width to suit your preference. The indicator displays values on the right side of the chart. AliPivot Points values can also be utilized by developers for creating Expe
FREE
Automatic Trendlines
Pasi Hakamaki
4.69 (51)
The indicator draws trendlines on chart. This indicator has six inputs. User can specify alternative labels for both lines. If multiple instances of the indicator are used, the labels must differ. User can set width and color of the lines and depth which specifies what significant peaks should be used. For example, Depth=10 sets trendlines using the current peaks and valleys that have at least 10 bars to the right and to the left and that have highs/lows less/greater than the peak's high/low. In
FREE
PZ Penta O MT5
PZ TRADING SLU
3.8 (5)
The Penta-O is a 6-point retracement harmonacci pattern which usually precedes big market movements. Penta-O patterns can expand and repaint quite a bit. To make things easier this indicator implements a twist: it waits for a donchian breakout in the right direction before signaling the trade. The end result is an otherwise repainting indicator with a very reliable trading signal. The donchian breakout period is entered as an input. [ Installation Guide | Update Guide | Troubleshooting | FAQ | A
FREE
Italo Levels Indicator MT5
Italo Santana Gomes
5 (6)
BUY INDICATOR AND GET EA FOR FREE AS A BONUS + SOME OTHER GIFTS! ITALO LEVELS INDICATOR  is the best levels indicator ever created, and why is that? Using high volume zones on the market and Fibonacci the Indicator works on all time-frames and assets, indicator built after 7 years of experience on forex and many other markets. You know many levels indicators around the internet are not complete, does not help, and it's difficult to trade, but the   Italo Levels Indicator is different , the Ital
Rainbow MT5
Jamal El Alama
4 (1)
Description : Rainbow MT5 is a technical indicator based on Moving Average with period 34 and very easy to use. When price crosses above MA and MA changes color to green, then this is a signal to buy. When price crosses below MA and MA changes color to red, then this is a signal to sell. The Expert advisor ( Rainbow EA MT5 ) based on Rainbow MT5 indicator is now available here . MT4 version is available here .
FREE
Get ALERTS for break of your TRENDLINES, SUPPORT LINES, RESISTANCE LINE, ANY LINE!! 1. Draw a line on the chart (Trend, support, resistance, whatever you like) and give it a name (e.g. MY EURUSD line) 2. Load the Indicator and input the Line Name the same name in Indicator INPUT so system knows the name of your line (= MY EURUSD line) 3. Get Alerts when Price breaks the line and closes Works on All Time frames and charts LEAVE A COMMENT AND IF THERE IS ENOUGH INTEREST I WILL WRITE AN EA WHICH W
FREE
The Advanced Support and Resistance Indicator for MetaTrader 5 leverages sophisticated pivot point detection algorithms to autonomously identify and visualize critical price levels on the chart. Utilizing a configurable pivot period (default: 20 bars) and data source (High/Low or Open/Close), it intelligently scans historical price action within a user-defined loopback window (default: 290 bars) to pinpoint pivot highs and lows with strict validation criteria for enhanced precision. Pivots are d
FREE
The   Pivot Point indicator   automatically calculates and displays the pivot point line and support and resistance levels. Pivot can be calculated according to the Classic, Floor, Fibonacci, Woodie, Camarilla or DeMark formula. It is also possible to select the period for calculating the indicator. A trader can choose from daily, weekly, monthly, or user-defined periods. Types of pivots Classic Floor Fibonacci Woodie Camarilla DeMark Main features The indicator shows the current and historic
FREE
MT4 Version Most indicators draw lines. This one draws the battlefield. If you ever bought an EA or indicator based on a perfect equity curve — and then watched it bleed out live — you’re not alone. The problem? Static logic in a dynamic market. Fibonacci Bollinger Bands   adapts. It combines Bollinger structure with customizable Fibonacci levels to mark   zones of control   — where price reacts, pauses, or reverses. No magic. Just logic that follows volatility. Why this tool matters   It
FREE
Gli utenti di questo prodotto hanno anche acquistato
SMART TREND TRADING SYSTEM — OFFERTA SPECIALE Il tuo sistema di trading. Il tuo EA per l’automazione. La tua formazione e il tuo supporto. Acquista Smart Trend Trading System per MT5 a 99 USD e ricevi Smart Universal Expert Advisor GRATIS per automatizzare i segnali del sistema. STTS riunisce la direzione del trend, i segnali di entrata e uscita, le zone di inversione e i livelli di prezzo importanti direttamente sul grafico. Segui il sistema manualmente oppure collega l’EA incluso per eseguire
Trend Sniper X
Sarvarbek Abduvoxobov
4.9 (39)
Trend Sniper X è un indicatore trend-following multi-timeframe per MetaTrader 5 che aiuta i trader a identificare la direzione del trend e i potenziali punti di inversione con chiarezza e precisione. per MT4: https://www.mql5.com/en/market/product/193245 Informazioni sul prezzo: Il prezzo attuale è promozionale ed è soggetto a modifiche con il rilascio di futuri aggiornamenti e nuove funzionalità. Offerta Bonus: Per ricevere GRATIS l'Auto-Trade Assistant EA per questo indicatore, invia un messa
Neuro Poseidon MT5
Daria Rezueva
4.75 (53)
Neuro Poseidon is a new indicator by Daria Rezueva. It combines precise trading signals with adaptive TP/SL levels - creating best possible trades as a result! Message me and get  Neuro Poseidon Assistant  as a gift to automize your trading process! What makes it stand out? 1. Proven profitability on all assets and timeframes 2. Only confirmed BUY and SELL signals present on the chart 3. Adaptive TP & SL levels generated by the software for each trade 4. Easy to understand - suitable for al
Zoryk Gold
Reda El Koutbane
5 (12)
ZORYK — Sistema avanzato di segnali XAUUSD per MetaTrader 5 Conosci sicuramente questa sensazione. Passi molto tempo ad analizzare l’oro. Aspetti il punto d’ingresso corretto. Finalmente apri l’operazione e il prezzo inizia immediatamente a muoversi contro di te. Chiudi troppo presto, sposti lo Stop Loss o esiti per alcuni secondi. Successivamente il mercato raggiunge esattamente l’obiettivo che avevi previsto inizialmente, ma senza di te nella posizione. Il problema non era sempre la direzione.
SuperScalp Pro
Van Minh Nguyen
4.65 (34)
SuperScalp Pro - Professional Multi-Layer Confluence Scalping System SuperScalp Pro è un indicatore avanzato per lo scalping che migliora il Supertrend classico attraverso diversi filtri intelligenti di conferma. Aiuta a identificare opportunità di Buy/Sell con una probabilità maggiore, riducendo significativamente i falsi segnali. Le frecce Buy e Sell vengono visualizzate direttamente sul grafico, mentre i livelli di Stop Loss e Take Profit basati sull’ATR vengono calcolati automaticamente in t
Cominciamo con la verità. Nessun indicatore da solo ti renderà profittevole. Se qualcuno ti dice il contrario, ti sta vendendo un sogno. Qualsiasi indicatore che mostra frecce perfette di acquisto/vendita può essere reso impeccabile — basta ingrandire la giusta sezione della storia e catturare solo i trade vincenti. Noi non lo facciamo.  SMC Intraday Formula è uno strumento. Legge la struttura del mercato per te, identifica le zone a più alta probabilità e ti mostra esattamente come appare la t
Gann Made Easy è un sistema di trading Forex professionale e facile da usare che si basa sui migliori principi del trading utilizzando la teoria di mr. WD Gann. L'indicatore fornisce segnali ACQUISTA e VENDI accurati, inclusi i livelli di Stop Loss e Take Profit. Puoi fare trading anche in movimento utilizzando le notifiche PUSH. CONTATTAMI DOPO L'ACQUISTO PER RICEVERE GRATUITAMENTE LE ISTRUZIONI DI TRADING E OTTIMI INDICATORI EXTRA! Probabilmente hai già sentito parlare molte volte dei metodi d
Unix Scalper
Issam Kassas
4 (4)
UNIX SCALPER — OFFERTA SPECIALE Individua il setup. Esamina il piano. Scegli come operare. Acquista UNIX Scalper per MT5 a 99 USD e ricevi Smart Universal Expert Advisor GRATIS per automatizzarne i segnali. UNIX Scalper riunisce analisi di mercato, indicazioni BUY/SELL/WAIT e livelli Entry, Stop Loss, TP1 e TP2 in un unico pannello organizzato. Segui il piano di trading manualmente oppure collega l’EA incluso per eseguire automaticamente le operazioni secondo le impostazioni scelte. Il prezzo at
M1 Sniper MT5
Oleg Rodin
5 (7)
M1 SNIPER   è un sistema di indicatori di trading facile da usare. Si tratta di un indicatore a freccia progettato per l'intervallo temporale M1. L'indicatore può essere utilizzato come sistema autonomo per lo scalping sull'intervallo temporale M1 e come parte del tuo sistema di trading esistente. Sebbene questo sistema di trading sia stato progettato specificamente per il trading sull'intervallo temporale M1, può comunque essere utilizzato anche con altri intervalli temporali. Inizialmente ho p
GoldenX Entry MT5
Kareem Abbas
5 (16)
GoldenX Entry è un indicatore per MT5 con un algoritmo adattivo Smart Entry Trend, un sistema di scoring dei segnali, un rilevatore del regime di mercato e un filtro di volatilità. Ogni segnale include un livello di ingresso calcolato, tre livelli di Take-Profit (TP1, TP2, TP3) e un livello di Stop-Loss. È costruito su più livelli analitici progettati per adattarsi a diverse condizioni di mercato, combinando un sistema analitico multilivello con un ottimizzatore integrato e un sistema di traccia
La leggenda ritorna: Entry Points Pro 10. Il rilancio del leggendario indicatore che per 3 anni è rimasto nella Top-3 del MQL5 Market. Centinaia di recensioni entusiaste (589 su due versioni), migliaia di trader lo usano ogni giorno per operare, 31.000+ download della demo   MT4+MT5 . Ho letto ogni vostra recensione degli ultimi cinque anni — e invece di promesse ho inserito nella versione 10 le risposte. Dall'autore che opera sui mercati dal 1999 e tiene all'onestà, alla propria reputazione e a
Reversion King Indicator
Eugen-alexandru Zibileanu
5 (9)
Un nuovo Re in città - Indicatore + Gestione ordini (TP1 + TP2 + TP3) + Invio opzionale di segnali Telegram INCLUSO (GRATIS) (SISTEMA COMPLETO DI TRADING e SEGNALI) Il nostro miglior EA per l’Oro: Gold Slayer Questo indicatore include una strategia avanzata, un sistema di trading con gestione ordini personalizzabile e un sistema mean reversion che combina estensioni di envelope, supportato da molteplici filtri intelligenti di conferma come RSI per individuare ingressi di inversione ad alta proba
Tokyo mt5 Indicator
Vasiliy Strukov
5 (1)
Il Tokyo Indicator offre una chiara panoramica visiva della direzione del trend, dei potenziali segnali di trading e delle condizioni di mercato. La sua linea di trend a gradini, codificata a colori, distingue le fasi rialziste (in blu) da quelle ribassiste (in magenta). Frecce direzionali dedicate evidenziano potenziali opportunità di acquisto e vendita al variare del trend visualizzato. Una dashboard integrata riunisce in un'unica visualizzazione pratica il segnale corrente, il bias di mercato
Welcome to ENTRY IN THE ZONE AND SMC MULTI TIMEFRAME Entry In The Zone and SMC Multi Timeframe is a real-time market analysis tool based on Smart Money Concepts (SMC), designed to analyze market structure, price direction, and key trading zones. It supports both Single-Timeframe Analysis and Multi-Timeframe Analysis, providing a clearer view of the overall market structure across multiple timeframes, with real-time BUY / SELL signals that do not repaint. It is designed to help filter trading opp
Market Structure Order Block Dashboard MT5 è un indicatore MT5 progettato per i trader che vogliono leggere la struttura di mercato e le principali zone di reazione del prezzo direttamente sul grafico. Combina BOS, ChoCH, Order Blocks, Fair Value Gaps (FVG), Liquidità, Kill Zones, Volume Profile e un pannello compatto per un'analisi rapida. Questo indicatore è rivolto ai trader che utilizzano la struttura di mercato, i concetti ICT e Smart Money come quadro decisionale. Può aiutare a individuare
Adaptive Price Action Engine Acquista un indicatore, ricevi l'EA gratis Analisi Auto-Ottimizzata del Trend e dei Pattern Candlestick Multi-Timeframe I mercati cambiano continuamente e non tutti i pattern di Price Action hanno lo stesso valore in ogni condizione di mercato. Adaptive Price Action Engine è progettato per adattarsi alle condizioni di mercato in continua evoluzione, combinando struttura del trend, analisi Multi-Timeframe, pattern Candlestick e ottimizzazione statistica in un unico fr
Currency Strength Wizard   è un indicatore molto potente che ti fornisce una soluzione all-in-one per un trading di successo. L'indicatore calcola la potenza di questa o quella coppia forex utilizzando i dati di tutte le valute su più intervalli di tempo. Questi dati sono rappresentati in una forma di indice di valuta facile da usare e linee elettriche di valuta che puoi utilizzare per vedere il potere di questa o quella valuta. Tutto ciò di cui hai bisogno è collegare l'indicatore al grafico ch
FiboSniper Pro
Van Minh Nguyen
5 (3)
FiboSniper Pro – Multi-Filter Fibonacci System with Auto SL/TP and Control Panel FiboSniper Pro è un indicatore tecnico che combina Fibonacci Envelopes dinamici con diversi filtri di conferma per generare segnali Buy e Sell selezionati. I livelli di Fibonacci vengono calcolati sulla base di Moving Average e ATR e successivamente filtrati tramite ADX, EMA, RSI, ATR, Volume, Time e struttura delle candele. L’indicatore visualizza direttamente sul grafico i livelli automatici di Stop Loss e Take Pr
Atomic Analyst MT5
Issam Kassas
4.45 (58)
ATOMIC ANALYST — OFFERTA SPECIALE La tua analisi di mercato. Il tuo EA per l’automazione. La tua formazione e il tuo supporto. Acquista Atomic Analyst per MT5 a 99 USD e ricevi Smart Universal Expert Advisor GRATIS per automatizzare i segnali dell’indicatore. Atomic Analyst riunisce l’azione del prezzo, la direzione del trend, i segnali di entrata e uscita, lo Stop Loss e diversi livelli di Take Profit direttamente sul grafico. Opera manualmente utilizzando la sua analisi oppure collega l’EA in
Divergence Bomber
Ihor Otkydach
4.89 (94)
Ogni acquirente dell’indicatore riceverà inoltre gratuitamente: L’utilità esclusiva “Bomber Utility”, che gestisce automaticamente ogni operazione, imposta i livelli di Stop Loss e Take Profit e chiude le posizioni secondo le regole della strategia I file di configurazione (set file) per adattare l’indicatore a diversi asset I set file per configurare il Bomber Utility in tre modalità: “Rischio Minimo”, “Rischio Bilanciato” e “Strategia di Attesa” Una guida video passo-passo per installare, con
SMART PRICE ACTION CONCEPTS — OFFERTA SPECIALE Osserva la struttura. Identifica le zone. Costruisci il tuo piano di trading. Acquista Smart Price Action Concepts per MT5 a 49 USD e ricevi Smart Universal Expert Advisor GRATIS. Riunisci Smart Money Concepts (SMC), analisi in stile ICT e azione del prezzo in un grafico organizzato. Identifica la struttura del mercato, gli order block, i livelli di riferimento della liquidità e gli squilibri, poi scegli quali elementi visualizzare tramite lo Smart
Superhero
Ihor Otkydach
5 (3)
L'indicatore SUPERHERO è un sistema di trading multivaluta progettato secondo un approccio "all-inclusive". L'indicatore analizza autonomamente il mercato e fornisce segnali su quando aprire e chiudere le posizioni. Utilizza ordini Stop Loss e Take Profit. Il rapporto R:R è 1:1. Questo sistema è in grado di inviare notifiche push sul tuo smartphone, consentendoti di effettuare operazioni "in mobilità" senza dover rimanere incollato al PC. È perfetto per le società di trading proprietario. UN OMA
Volatility Master for MetaTrader is a real-time dashboard tool that scans up to  50 symbols  to identify high-volatility , trending markets instantly. With bullish/bearish signals, customizable alerts, and a user-friendly interface, it helps you avoid range-bound conditions and focus on high-probability trades. Clarity leads to confidence. Trade confidently and protect your capital effectively with this powerful dashboard. We don't offer free or bonus indicators in exchange of reviews from you.
Power Candles MT5
Daniel Stein
4.58 (12)
Power Candles V3 - Indicatore di forza ad ottimizzazione automatica Power Candles V3 trasforma la forza delle valute e degli strumenti in un piano di trading attuabile su ogni grafico a cui è collegato. Invece di limitarsi a colorare le candele, esegue un'auto-ottimizzazione in tempo reale in background e ti fornisce i migliori valori di Stop Loss, Take Profit e soglia di segnale per il simbolo che hai davanti. Basta un clic per adottarlo nel trading live: i raggi di ingresso, Stop Loss e Take P
Axiom Matrix
Issam Kassas
5 (8)
Axiom Matrix — OFFERTA SPECIALE Acquista Axiom Matrix a 49 USD e ricevi Smart Universal Expert Advisor GRATIS. Esplora il mercato. Confronta i setup. Scegli il prossimo grafico. Axiom Matrix riunisce analisi su più simboli e timeframe in una dashboard. Individua dove concentrarti senza controllare ogni grafico separatamente. Analizza l’Osservazione del mercato o i simboli scelti su più timeframe. Confronta trend, momentum, volume, volatilità e qualità del mercato. Esplora i setup con Best Axiom
Trend Catcher ind mt5
Ramil Minniakhmetov
5 (18)
INDICATORE TREND CATCHER L'indicatore Trend Catcher analizza i movimenti dei prezzi di mercato, utilizzando una combinazione di indicatori di analisi del trend proprietari dell'autore e personalizzati. Identifica la vera direzione del mercato filtrando il rumore a breve termine e concentrandosi sulla forza del momentum sottostante, sull'espansione della volatilità e sul comportamento della struttura dei prezzi. Utilizza inoltre una combinazione di indicatori personalizzati di smoothing e filtr
IQ FX Gann Levels a precision trading indicator based on W.D. Gann’s square root methods . It plots real-time, non-repainting support and resistance levels to help traders confidently spot intraday and scalping opportunities with high accuracy. William Delbert Gann (W.D. Gann) was an exceptional market analyst, whose trading technique was based on a complex blend of mathematics, geometry, astrology, and ancient mathematics which proved to be extremely accurate. We don't offer free or bonus indic
RelicusRoad Pro MT5
Relicus LLC
4.96 (24)
RelicusRoad Pro: Sistema Operativo Quantitativo di Mercato 70% DI SCONTO ACCESSO A VITA (TEMPO LIMITATO) - UNISCITI A 2.000+ TRADER Perché la maggior parte dei trader fallisce anche con indicatori "perfetti"? Perché operano su Singoli Concetti isolati. Un segnale senza contesto è una scommessa. Per vincere serve CONFLUENZA . RelicusRoad Pro non è un semplice indicatore. È un Ecosistema Quantitativo completo . Mappa la "Fair Value Road", distinguendo tra rumore e rotture strutturali. Smetti di in
ATstrong
Zaha Feiz
5 (1)
ATSTRONG PRO: Indicatore di Struttura di Mercato & Breakout Motore di Rilevamento Breakout | 5 Obiettivi TP Dinamici | Pannello Dashboard Live | Nessun Repainting Prezzo di Lancio Prezzo Attuale: $59 — Il prezzo aumenta di $10 dopo ogni 10 vendite. ATSTRONG PRO è un avanzato indicatore di breakout e struttura di mercato istituzionale progettato per MetaTrader 5. Rileva pivot di swing ad alta probabilità, identifica zone raggruppate di accumulo di supporto e resistenza e segnala Break of Struc
CRT Candle Range Theory HTF MT5 - Ultimate CRT Indicator: Concetti ICT avanzati e sistema di trading Malaysian SnR Padroneggia le orme dei Market Maker con l'indicatore Candle Range Theory più avanzato. Sblocca il vero potere degli Smart Money Concepts (SMC) e fai trading con la stessa precisione delle istituzioni grazie all'Ultimate CRT Indicator. Costruito esclusivamente per i trader seri, questo indicatore automatizza la teoria CRT, un pilastro centrale dei Concetti ICT (Inner Circle Trader),
Altri dall’autore
Einstein Pivot Point
Luis Cesar Nunes Dos Santos
Einstein Pivot Point indicator shows you hourly, weekly or monthly pivot points and support and resistance levels. You can choose 3 different formula for the support and resistance levels (Classic Formula, Woodie Pivot Points and Fibonacci Pivot Points). Einstein Pivot Point   will automatically calculate the p ivot point   and   support  and  resistance levels  on the basis of market data. Trading requires reference points (support and resistance), which are used to determine when to enter the
Filtro:
Nessuna recensione
Rispondi alla recensione